Square
Following
Hot
News
Notifications
Profile
Share your thoughts
placeholder
Article
$SIGN It plunged 13% in a day, and I’m still holding my long position in my live account, so I’ll own the unrealized loss. The current price is 0.0080, with a 24h high of 0.0092 and a low of 0.0079, and trading volume of 9.5M—the drop came on heavy volume, not a low-volume slide. That shows some holders are genuinely selling, but 9.5M is not exceptionally high for SIGN; this looks more like a chain reaction after panic selling was triggered.
I won’t make empty claims about the fundamentals: for an infrastructure token like SIGN, the thesis rests on adoption and real on-chain demand, not candle
SIGN-2.90%
11/09 intraday levels update! For U.S. stocks, only extreme levels will be provided; nearby levels won’t be shared and will be covered on the livestream.
BTC / ETH / SOL / Gold
BTC always waits for a volume surge: 1, 2, 3. The previous two levels, 757 and 735, were extremely precise. The next volume-surge levels are 71600 and 69650! Spot on. Place your orders.
Overall plan: Crypto still has room to fall. Look for short entries when prices rebound into resistance zones, and go long after sharp drops into support zones. For gold, watch the topping area above and wait for pullback opportunities b
post-image
BTC-0.67%
ETH-1.26%
SOL-0.77%
XAUUSD+0.75%
Trenches
ZIG
Z
bade
b
ZIG
0x8c...1145
Market Cap
$.
Change
.
24h Vol
$.
Holders
.
牛逼
牛
bade
b
牛逼
0x96...7777
Market Cap
$.
Change
.
24h Vol
$.
Holders
.
BTC
B
bade
b
BTC
C5xp...pump
Market Cap
$.
Change
.
24h Vol
$.
Holders
.
STONK
S
bade
b
STONK
6GmA...UNgx
Market Cap
$.
Change
.
24h Vol
$.
Holders
.
ANSEM
A
bade
b
ANSEM
9cRC...pump
Market Cap
$.
Change
.
24h Vol
$.
Holders
.
#BTCFlashCrash $BTC #ShareWeekly
Short answer first. I think this was a leverage flush, but a flush that landed on a weak spot, and that is why I’m not calling it finished.

What happened

Late Sunday, BTC fell about 2.8% in roughly 15 minutes, from near 75,600 to a low around 73,510, then recovered most of it. About $745 million was liquidated in one hour, and $715 million of that was longs. That is about 96% longs, and it works out to roughly $255 million of long liquidations for every 1% of price drop, by my math. Over the full 24 hours, different trackers show anywhere from $850 million t
BTC-0.65%
  • 6
TODAY LIVE TECNICAL WITH SIGNALS
live-cover
LIVE1,936
I'm dying laughing
The most spot-on image from the Jensen Huang discussion
post-image
Nvidia's Biggest Crisis Yet? Jensen Huang Scandal Raises Questions About AI Chip Exports: What Should NVDA Investors Watch?

The AI chip market is fiercely competitive, but few expected Nvidia's latest challenge to come from a personal scandal involving its leadership.
After Jensen Huang admitted to an extramarital affair, the company's board announced an independent investigation, focusing on whether he had become a target of a foreign intelligence operation.
What makes the matter truly sensitive is its connection to business relationships and AI chip exports.
Nvidia's high-end GPUs are not o
SPCX+8.74%
  • 31
Ethereum’s rebound is much weaker than Bitcoin’s, and no bottoming pattern has appeared on the daily chart#美国10月CPI即将公布
ETH-1.26%
BTC-0.67%
Jensen Huang controversy sets the market ablaze! Is NVDA’s 2.2% drop just the beginning, or are investors overly nervous?

NVIDIA shares fell as much as about 2.2% after hours, and the market is beginning to worry that the Jensen Huang incident could become a new risk for NVDA.
The controversy has several dimensions: personal reputation, board governance, foreign intelligence risks, and AI chip export controls.
Among these, management uncertainty may be what the market amplifies most.
Jensen Huang is the soul of NVIDIA. From GPUs to AI data centers, his strategic decisions have a huge impact o
NVDA+2.80%
  • 38
Everyone in the group is calling for a rally, so I’m going contrarian—precious metals’ market cap surged by over $600 billion in 90 minutes. That kind of move isn’t driven by retail; it’s safe-haven money rushing to get positioned. Stare at charts long enough and you start seeing what you want to see, but the numbers are right there this time—you can’t deny them. There’s only one question left: is this a short-term spike, or the start of a major capital rotation? Can $BTC reach a certain coin? We’ll know before that coin’s price point.
post-image
BTC-0.67%
  • 2
$XTSLA Trend Watch: Cybertruck Makes Way for Cybercab—Acceleration or a Production Gap?

Musk said on November 6 that the Texas Gigafactory would likely phase out Cybertruck production around mid-2027, freeing up capacity for Cybercab. He also mentioned plans to introduce a more energy-efficient battery pack next year, with capacity reduced to around 40 kWh.
Tokenized Tesla is now trading at $360.14, up 0.47% over 24 hours, with approximately 212k USDT in trading volume—the news broke several days ago, and the price has barely moved.
The automotive business could face a short-term revenue gap,
post-image
TSLA+5.38%
#牛逼 bought 0x9665f094d862f4d5c221843e019b463d3c607777
🎁# New week: climb the ranks for merch worth 150 USDT
The Gate Square Comment Challenge continues. Start the week with a thoughtful comment 👇

🏆 Climb the weekly leaderboard for Gate merch
1st place wins Gate merch worth 150 USDT. Make your mark in the comments this week.

🎉 Start with a first-comment reward
Register, then leave your first valid comment on another user’s post to receive a 10 USDT Futures Position Voucher.

Share what resonates, explain a different view, or ask a thoughtful question. Keep participating to unlock comment check-in rewards.

👉 Join now for first-comment rewar
post-image
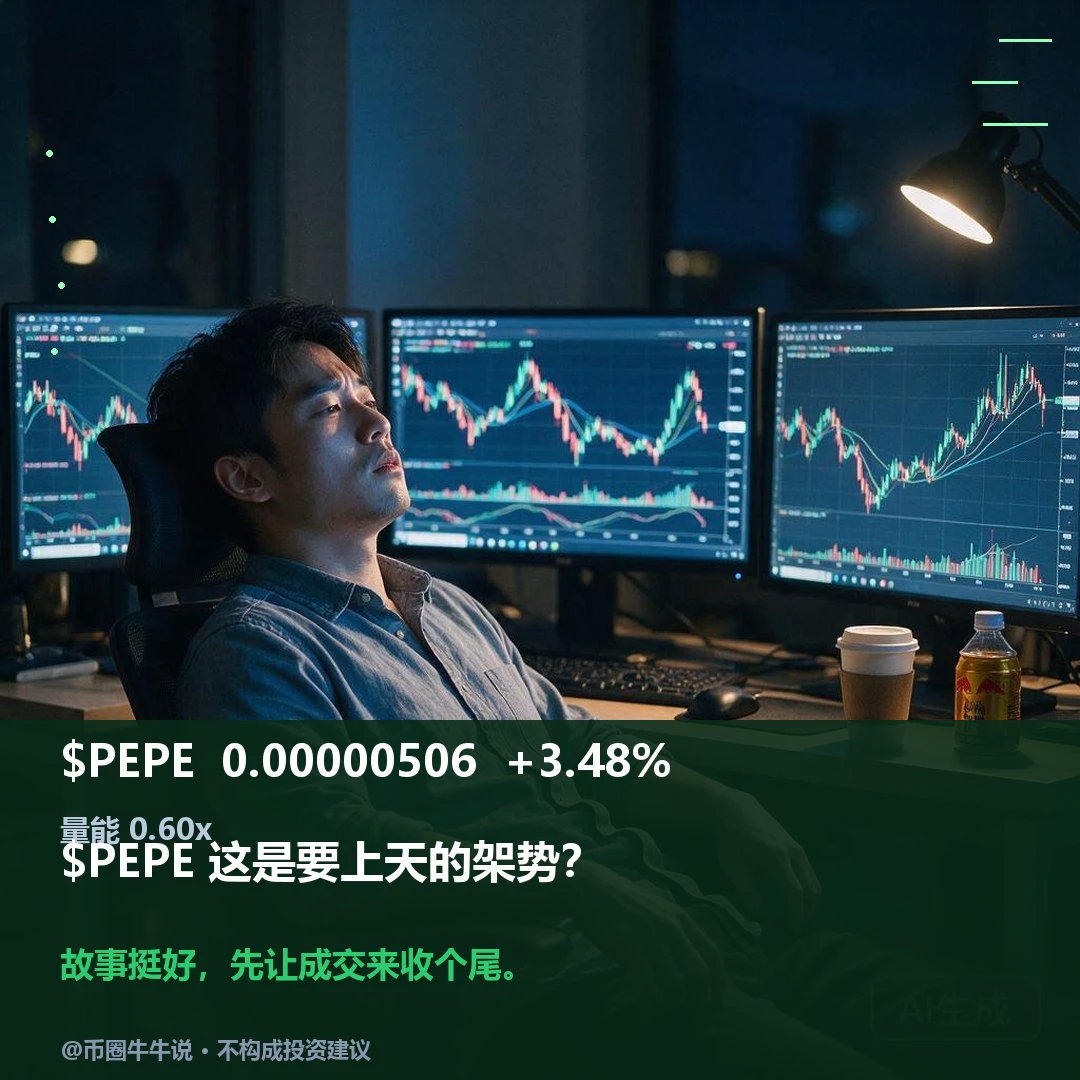
$PEPE Currently trading at 0.00000506, up 3.48% over 24H (range: 0.0000048–0.00000519). The 1H trend is strong, with RSI at 54; the 4H trend is strong, with RSI at 56. If the price breaks above 0.00000519 decisively, watch for further upside. If it falls below the 0.0000048 support level, the short-term structure may weaken. Market volatility is high; for observation only.
post-image
PEPE+0.97%
🔹Sudden flash crash before BTC’s weekly close! A wick down to $73,510, with $715 million in long po
live-cover
LIVE1,968
What Is Walk-Forward Backtesting? Why Might a Fixed Historical Dataset Fail to Adapt to a Changing Crypto Market?

In the cryptocurrency market, a strategy may perform exceptionally well during an uptrend over the past two years, yet incur frequent losses in the choppy market that follows.

This does not necessarily mean the strategy has no value at all; the market environment may have changed. If a trading strategy is developed and tested using only a fixed set of historical data, it may not fully reflect how well it can adapt across different periods.

One method worth learning about is Walk
post-image
Everyone, immediately imagine yourself as a spoiled bad woman.
post-image
$BTC Today's BTC short strategy played out as expected, with the morning setup capturing over 1,000 points

The morning call publicly outlined scaling into shorts in the 755–759 range, with a stop-loss set above 765; the live trade also entered precisely at 755

Price action fully matched expectations, continuing lower after meeting resistance. It touched the 744 level in the afternoon, when we advised taking profit on half the position to lock in gains. The single-trade strategy netted over 1,100 points, while the remaining position is still open, targeting the 735 level

Trading is all about
BTC-0.65%
#USIranTalksShowNewProgress
#美伊谈判出现新进展 $XBRUSD $XTIUSD #ShareWeekly
Oil fell more than 16% last week, its steepest weekly drop since 2020, and today’s headline is that talks are showing progress. I’d ask a different question than most people: how much of a deal is already in the price?

What is already priced

Brent went from about 118 a week ago to 98.32 at Friday’s close, a drop of about 17% by my math. Before the war, in February, Brent was around 68 to 70. So even after this fall, oil sits roughly 40% above its pre-war level. That tells me the market has paid for hope, not for a deal. F
XBRUSD-1.26%
XTIUSD-0.49%
  • 1
Load More

Join 40 M users in our growing community

⚡️ Join 40 M users in the crypto craze discussion

💬 Engage with your favorite top creators

👍 See what interests you

Trending Topics

USCPIDataIncoming

26.7k Views1.83k Discussing

The U.S. October CPI report will be released on November 10 at 8:30 a.m. ET. September CPI came in at 3.7% year over year, and markets will be watching closely for signs that inflation is cooling, especially in core CPI. A softer-than-expected reading could strengthen rate-cut expectations, while hotter inflation may pressure risk assets through higher Treasury yields and a stronger dollar. How do you think this CPI print will move $BTC, U.S. stocks and gold?

RedBullDoublePodiumInBrazil

1.25k Views30.52k Discussing

BTCFlashCrash

59.21k Views66.2k Discussing

View More