Square
Following
Hot
News
Notifications
Profile
Share your thoughts
placeholder
Article
Many traders expect a pullback after BTC rises, hoping for a better entry opportunity. But a retest isn’t always an opportunity; sometimes it can signal that a downtrend is starting again. The key is to determine whether the support level is holding and whether the overall market trend remains healthy.

First, assess the strength of the support level. If a price zone has seen rebounds multiple times in the past, it may indicate strong buying demand there. When the price returns to this zone, watch closely to see whether buyers step back in.

Second, watch for changes in trading volume. If volu
BTC-0.67%
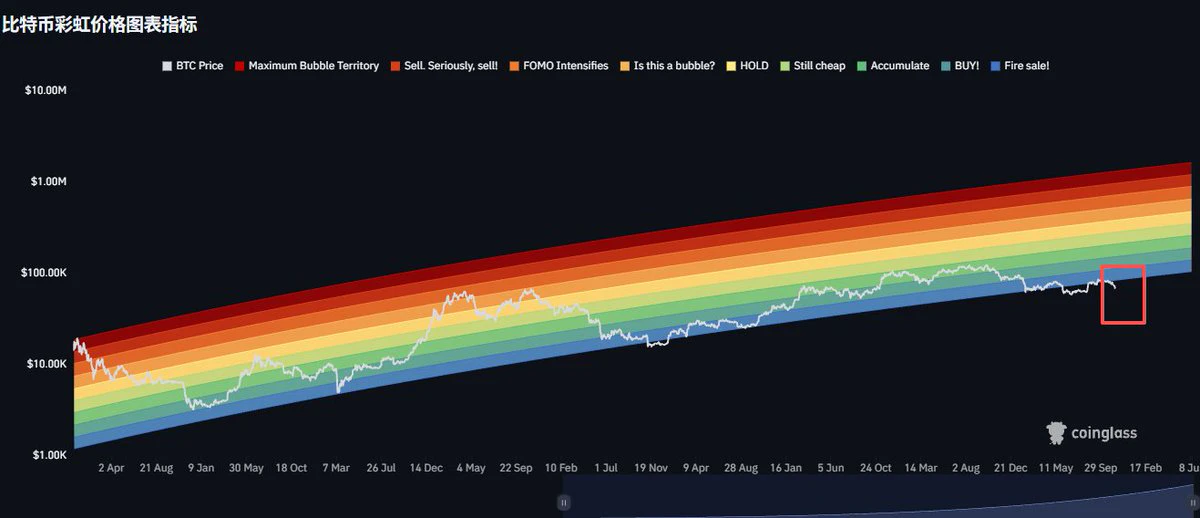
The Bitcoin cycle rainbow chart has failed too.
It keeps falling; even the rainbow has to bend down.
post-image
BTC-0.67%
Trenches
mihao
m
bade
b
mihao
4Cxj...pump
Market Cap
$.
Change
.
24h Vol
$.
Holders
.
IDOL
I
bade
b
IDOL
0x3b...ab07
Market Cap
$.
Change
.
24h Vol
$.
Holders
.
FOOD
F
bade
b
FOOD
FTu5...pump
Market Cap
$.
Change
.
24h Vol
$.
Holders
.
Sakura
S
bade
b
Sakura
9sFG...pump
Market Cap
$.
Change
.
24h Vol
$.
Holders
.
AGT
A
bade
b
AGT
0x5d...e274
Market Cap
$.
Change
.
24h Vol
$.
Holders
.
During a BTC Pullback, How Can You Tell a Normal Correction from a Trend Reversal?

In BTC trading, one of the most common mistakes is treating every drop as a trend reversal. As soon as the price pulls back, people rush to close their positions or even open short positions. But sometimes the market is simply undergoing a normal correction in an uptrend, after which the price strengthens again.

So, how can you distinguish a normal pullback from a genuine trend reversal?

First, watch the structure of highs and lows. In a healthy uptrend, the price typically forms progressively higher highs an
post-image
BTC-0.67%
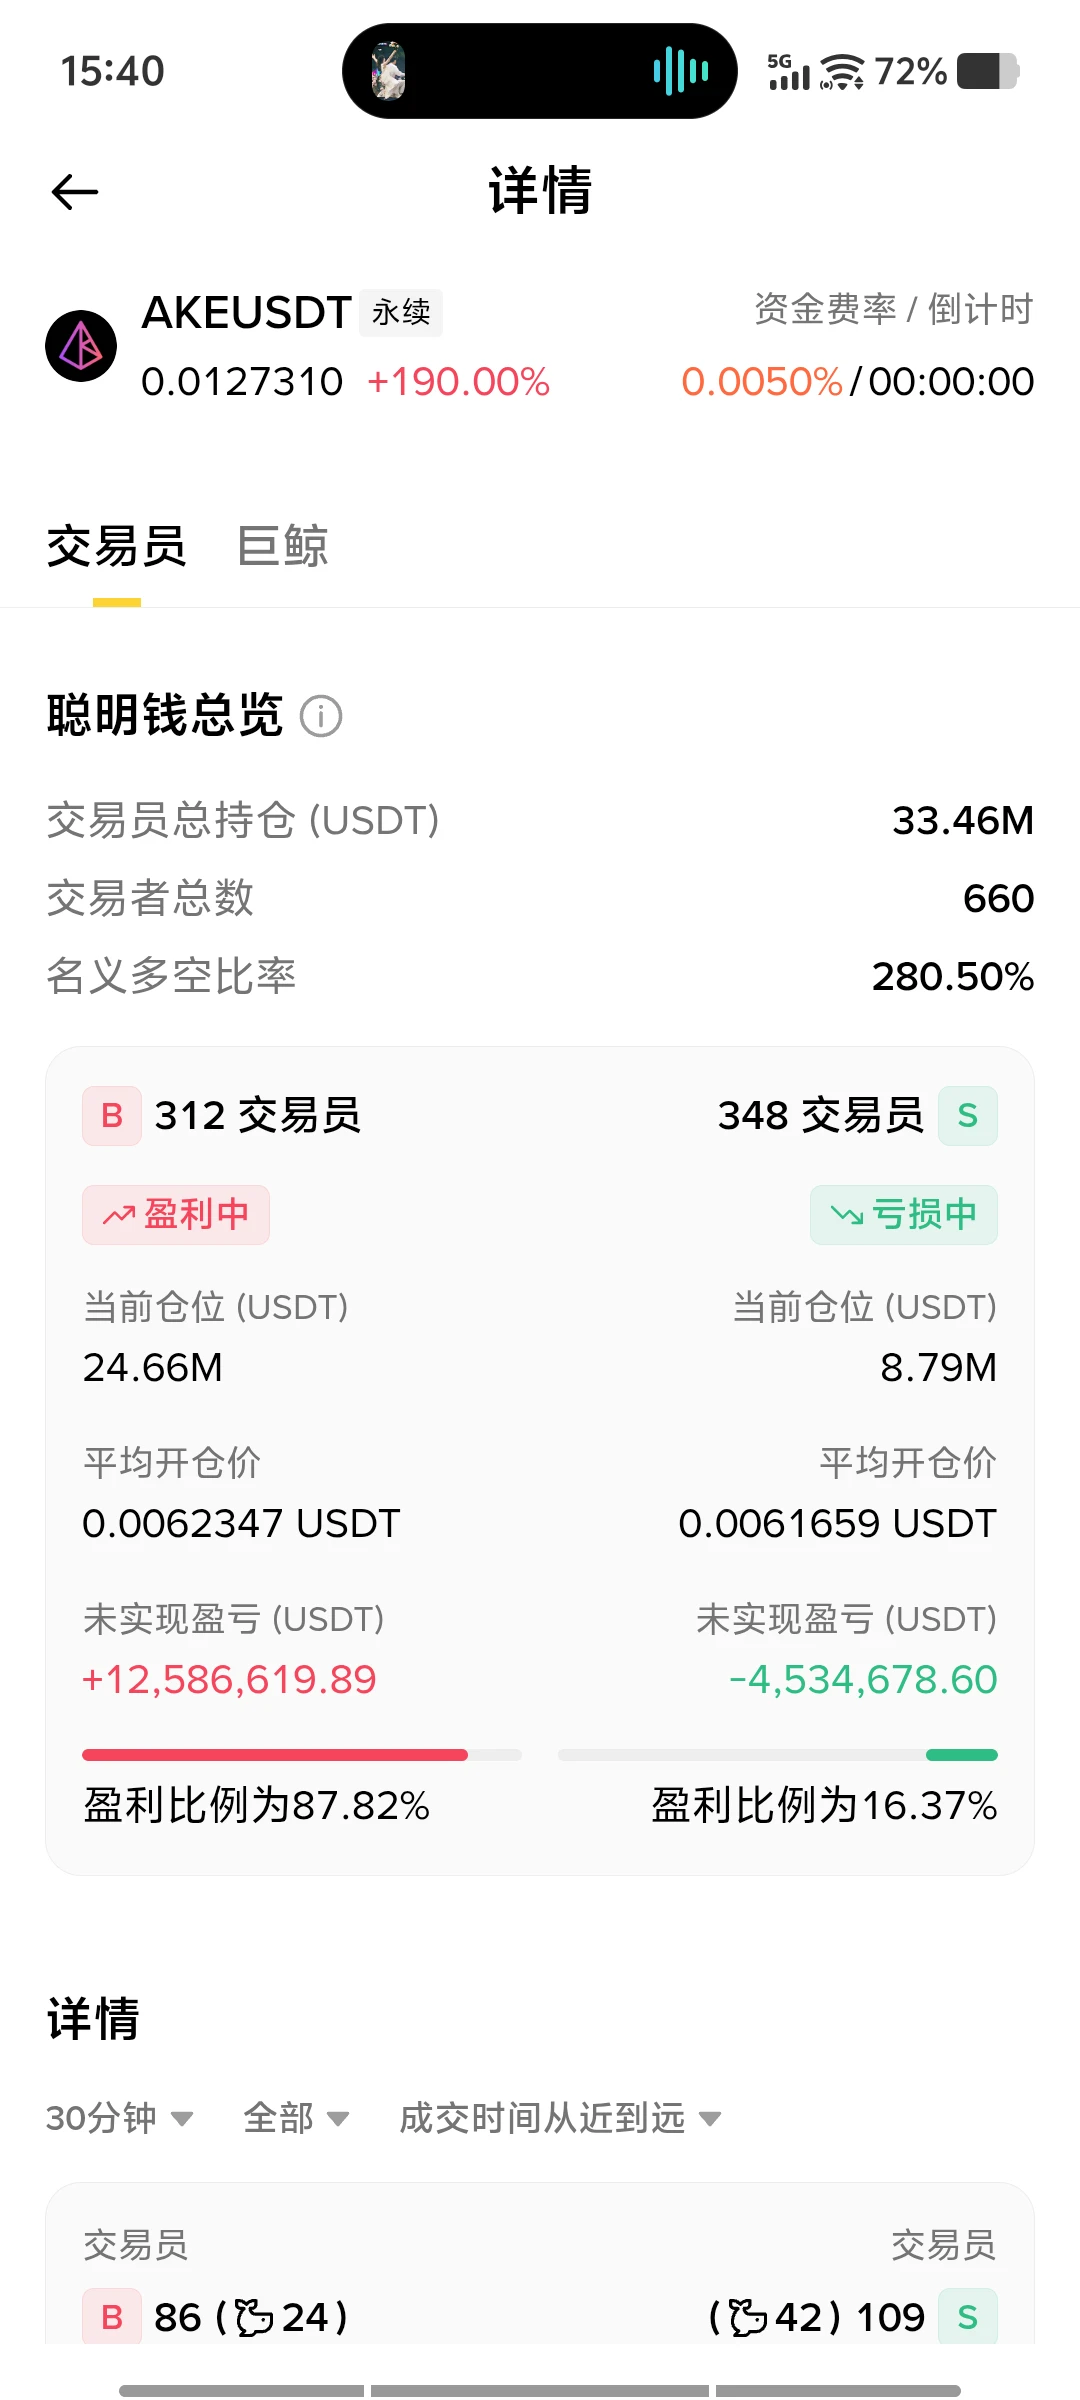
$AKE Look at this monster fighting back during the downturn

Since the last high of 0.89

$CORE there have already been 12 times

it has approached the 60-day moving average but failed to break through

This is also why many big capital players have been worn down and left

Many are also in despair

So $BEAT the entire altcoin sector has lost its way
#比特币跌破7万美元
post-image
AKE+6.07%
CORE+1.11%
BEAT-1.19%
BTC-0.67%
  • 1
market Bull or Bear
live-cover
LIVE2,601
Short Setup $UNI (M15 scalping trade) Entry: 6.027 -7.126 Stop-loss: 7.526 Take-profit: 5.162 Take-profit: 4.712 Take-profit: 3.419 Momentum indicators are weak: The MACD histogram remains negative, and RSI-6 hit an extremely low level of around 17.5 before a weak rebound, indicating weak buyer demand. Click here to trade $UNI 👇
post-image
UNI+3.05%
How to Set Reasonable Stop-Loss and Take-Profit Levels in BTC Trading?

In BTC futures trading, many people spend a lot of time looking for the best entry point, but overlook two more important questions: If the market outlook is wrong, where should you exit? If the market moves as expected, where should you lock in profits?

In fact, entry determines the start of a trade, while stop-loss and take-profit determine its final outcome.

First, stop-loss levels should be based on something. Don’t arbitrarily set a fixed loss amount; instead, determine the stop-loss level based on important support
post-image
BTC-0.65%
That's awesome, bro!
Now everyone knows you have a wife.
How to Identify a False Breakout? Avoid Getting Trapped in a Bull Trap!

In BTC trading, one of the market moves most likely to mislead traders is a false breakout. The price suddenly breaks through an important resistance level, and when many people see the candlestick surge rapidly, they assume a new uptrend has begun and rush to go long. However, the price soon falls back into its previous range, leaving those who bought at the top at an immediate disadvantage.

So, how can you identify a false breakout?

First, check whether trading volume confirms it. A genuine, strong breakout usually ne
post-image
BTC-0.67%
In cryptocurrency trading, many people know they should analyze rationally, yet when it comes time to place an order, their emotions take over. When they see BTC rising rapidly, they fear missing out and can’t resist chasing the price; when they see prices suddenly fall, they panic and rush to close their positions.

Why is it so easy for trading to become emotional?

First, fear of missing out on a move. When the market suddenly becomes highly volatile, many people worry about missing a chance to make money and rush in without waiting for confirmation from a signal. As a result, they often bu
post-image
BTC-0.67%
A few sentences explain why some people want to take down Jensen Huang:
1. Huang supports two things: open source and selling graphics cards to China.
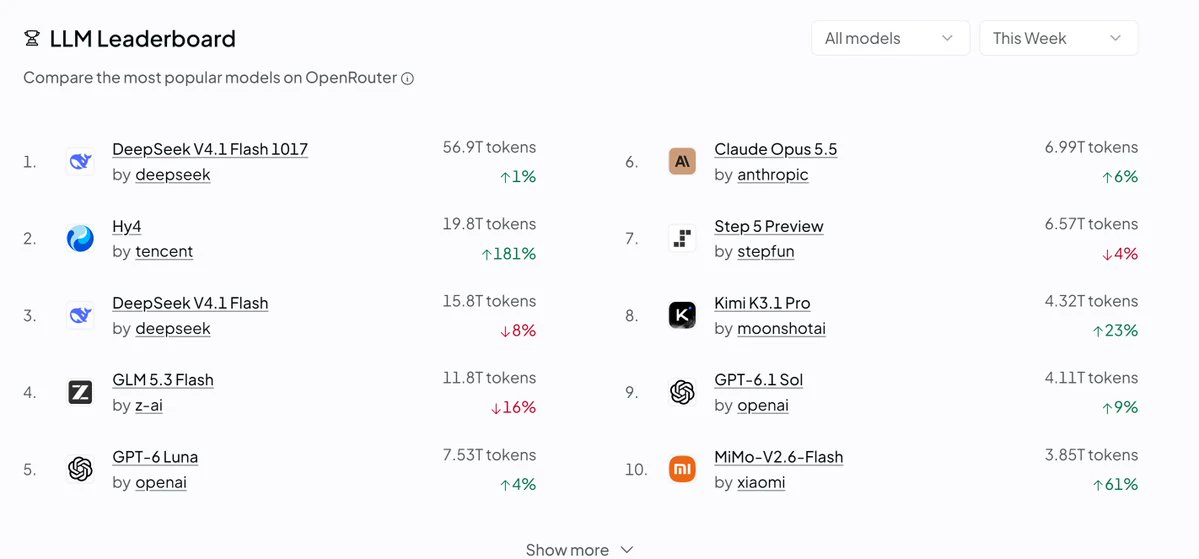
2. Anthropic is the biggest opponent of open source. Its revenue growth has now slowed, and more and more companies are using open-source models from Chinese companies. The top four of the ten most-used models on OpenRouter are now all from Chinese companies.
3. Anthropic is at the forefront of anti-China efforts, but with its IPO imminent and its valuation repeatedly marked down, don't think of it as one person; it's a community of shared inter
post-image
$BTC at a key level... rebound to 70,000 or drop to 65,000? BTC faced a massive sell-off, falling from 74,771 to 66,427 before rebounding to around 67,350. The area around 65,000 could become an important support zone, but buyers still need to prove they can hold this level. Key support levels: 66,400 / 65,000 Rebound targets: 68,500 / 70,000 / 71,500 If the price continues to rebound and climbs above 68,500, the likelihood of a move toward 70,000 will increase. However, if 66,400 gives way, the price is more likely to fall further toward 65,000. The market is presenting a potential buying op
post-image
BTC-0.67%
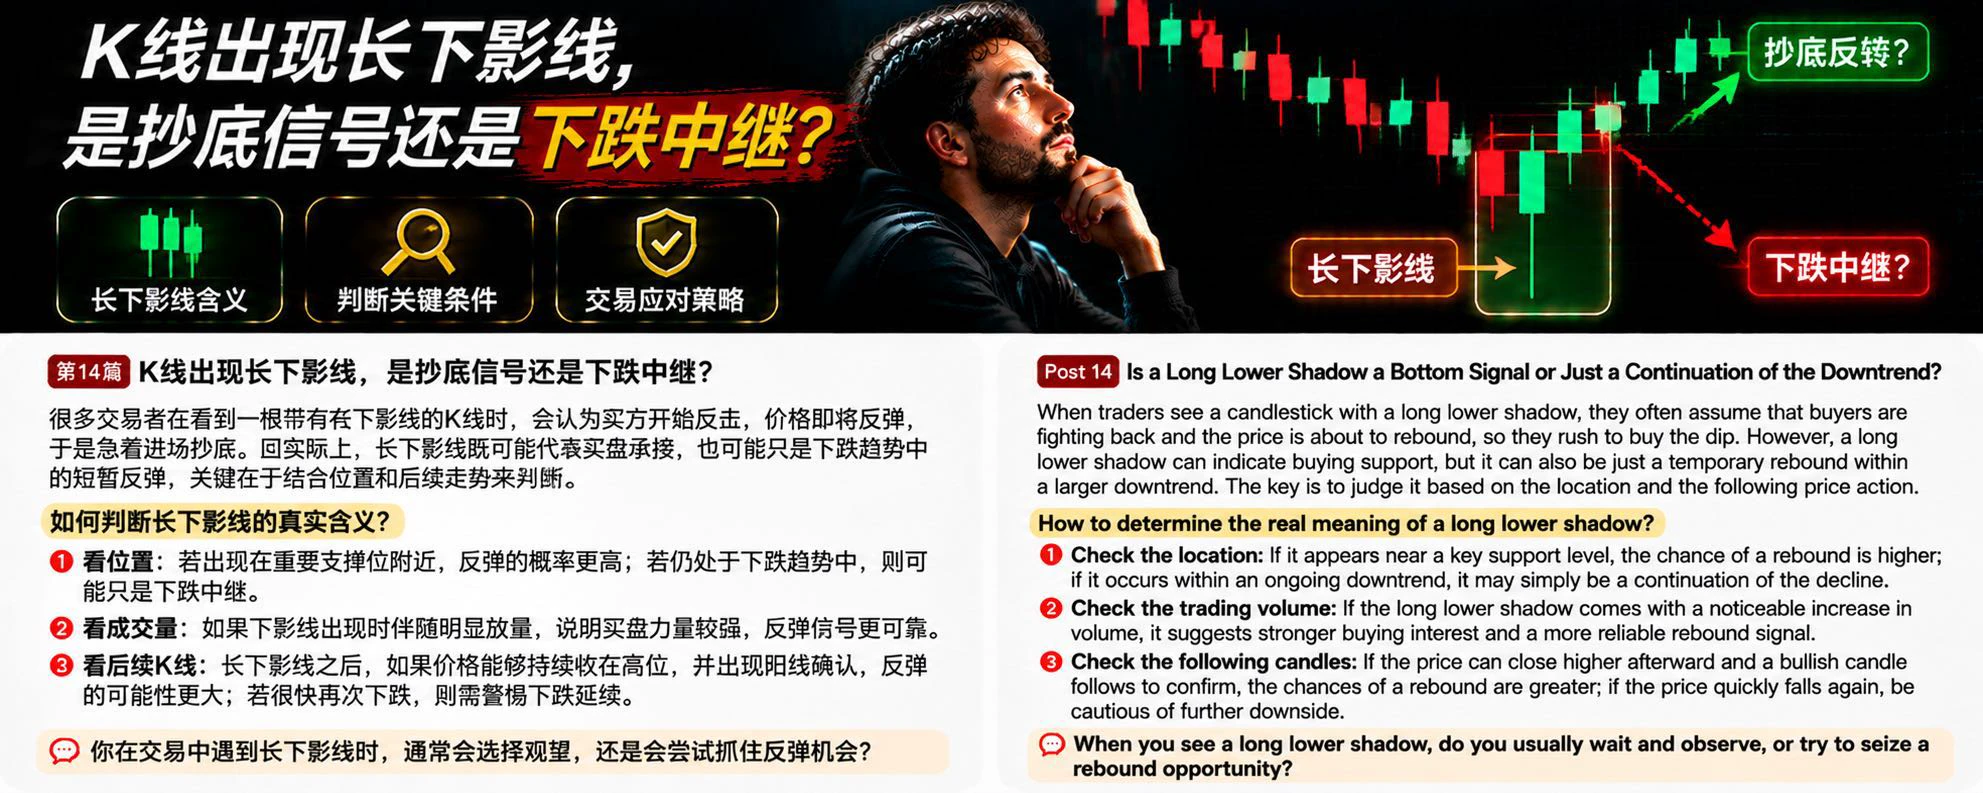
In BTC trading, many people see a candlestick with a long lower wick and assume buyers are starting to fight back and the price is about to rebound, so they rush in to buy the dip. But in reality, a long lower wick does not necessarily mean a trend reversal; it may just be a brief bounce during a decline.

So, how should you judge?

First, look at where it appears. If a long lower wick forms near an important support level from earlier, it may indicate strong buying interest in that area after the price fell there, making the rebound signal relatively more meaningful. But if it appears during
post-image
BTC-0.67%
Urgent warning! Longs entered at 2050 are down $144, and the $ETH 1900 critical line is under threat. If you don’t take action to save yourself now, it’ll be too late!

Brothers, I’m Lao Zhang. You must see the truth behind this downturn: this isn’t an ordinary pullback, but a hunt involving macro forces, institutions, and whales closing in from all sides.

Expectations of Fed tightening have surged, and ETH has fallen below the $2,000 mark for the first time since August. More than $1.3 billion in liquidations across the entire crypto market in 24 hours. An address linked to the Ethereum Foun
ETH-1.23%
  • 2
  • 1
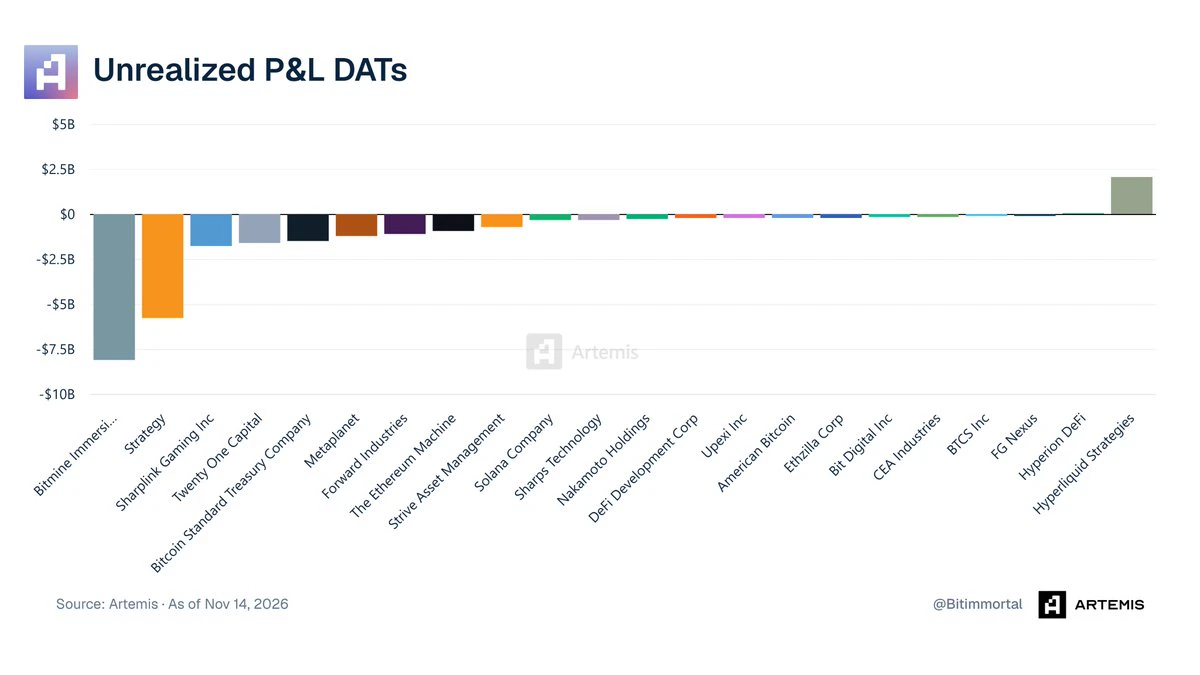
Strategy down $5.8B again on its Bitcoin holdings
hope they don't sell this time 💀
post-image
BTC-0.67%
THE LIQUIDATION CASCADE
Have leveraged liquidations ended? Where is the real bottom?
One phenomenon in this crypto market crash deserves particular attention: many investors didn't sell voluntarily but were forcibly liquidated by exchanges.
When investors use 10x, 20x, or even higher leverage, a move in the opposite direction of just a certain magnitude can trigger liquidation. Forced liquidations then bring new sell orders, leading to a continuous cascade of liquidations.
Market data for November 13 showed that global crypto liquidations at one point exceeded $1.6 billion in a single day. Est
post-image
BTC-0.65%
When the market is cold, it becomes easier to see who is gaining market share. CoinDesk’s October report showed that spot trading volume on centralized exchanges fell 9.7% month over month, while Gate grew 2.1% to $49.8 billion, ranking second globally in spot market share growth. Its derivatives trading volume reached $394 billion, ranking third.

Another figure worth noting is Gate’s monthly trading volume for RWA perpetual contracts, which was about $42.7 billion, ranking third among retail-focused exchanges. Combined with its stock offerings, which already cover U.S., Hong Kong, South Kore
post-image
  • 1
Good morning Market update
live-cover
LIVE2,335
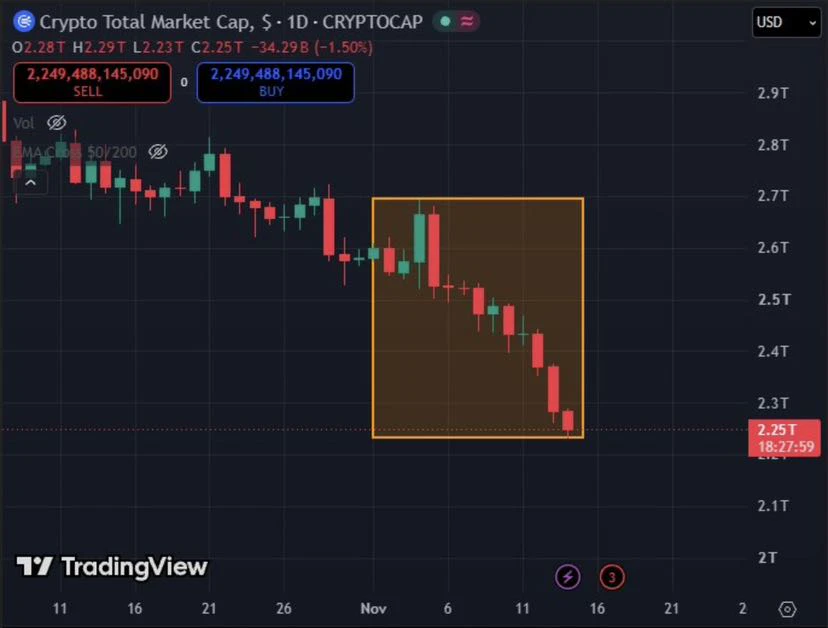
The crypto market has lost $330 billion in just two weeks. $BTC has retreated to the $66,000 level, while altcoins have seen even sharper declines. Some may view these drops as buying opportunities, but the downturn continues to cause significant pain.

#Bitcoin #BTC #Crypto #BitcoinDropsBelow$70K $BTC ‌
post-image
BTC-0.67%
Load More

Join 40 M users in our growing community

⚡️ Join 40 M users in the crypto craze discussion

💬 Engage with your favorite top creators

👍 See what interests you

Trending Topics

GateIPOAccessAnthropic

305.3K Views2.8K Discussing

Gate IPO Access Phase 3 features Anthropic (ANT), with USDT subscription interest starting from 100 USDT. Successful allocations will be delivered as real shares to Gate Stock Accounts. Indicative price: $70–$78/share Subscription: Nov 12–17 (UTC+8) Allocation is not guaranteed. Please manage risk accordingly.

Dr.HanOxfordUnionSpeech

147.2K Views586 Discussing

USOctoberPPIBelowExpectations

461.1K Views1.4K Discussing

View More