Square
Following
Hot
News
Profile
Share your thoughts
placeholder
Article
I owe you an apology, Sam.
I wasn't familiar with your game.
#USEarningsSeason
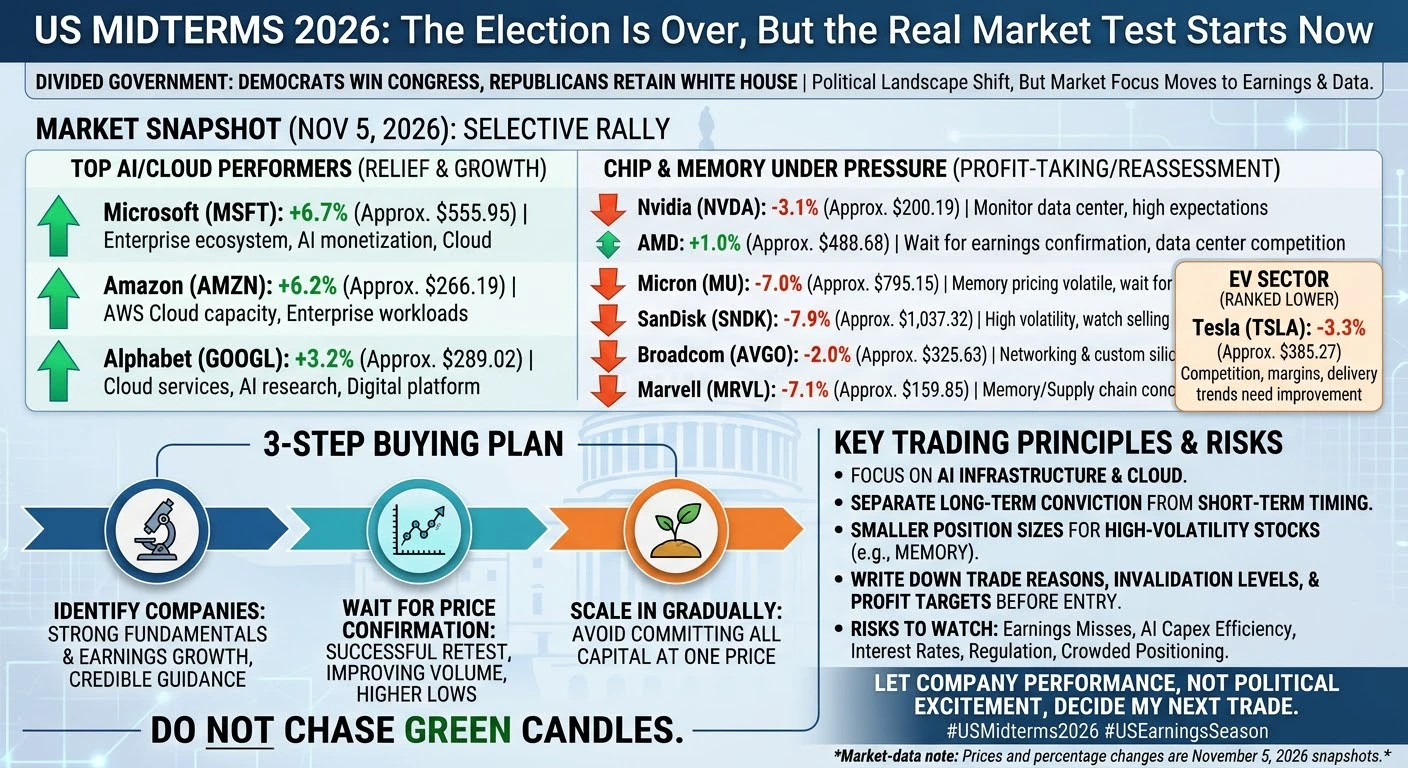
US Midterms 2026: The Election Is Over, But the Real Market Test Starts Now
The US midterm election results have changed the political landscape, but I do not believe one election can decide the market direction for the next several months. Democrats have secured control of both chambers of Congress, while Republicans retain the White House. This creates a divided government. In my view, the next phase will be driven less by political headlines and more by earnings, economic data, interest rates, regulation, capital spending and the ability of companies to turn demand into r
post-image
  • 4
Trenches
ZIG
Z
bade
b
ZIG
0x8c...1145
Market Cap
$.
Change
.
24h Vol
$.
Holders
.
BTC
B
bade
b
BTC
C5xp...pump
Market Cap
$.
Change
.
24h Vol
$.
Holders
.
HIGH
H
bade
b
HIGH
7ymF...high
Market Cap
$.
Change
.
24h Vol
$.
Holders
.
STONK
S
bade
b
STONK
6GmA...UNgx
Market Cap
$.
Change
.
24h Vol
$.
Holders
.
LEEROY
L
bade
b
LEEROY
98HE...pump
Market Cap
$.
Change
.
24h Vol
$.
Holders
.
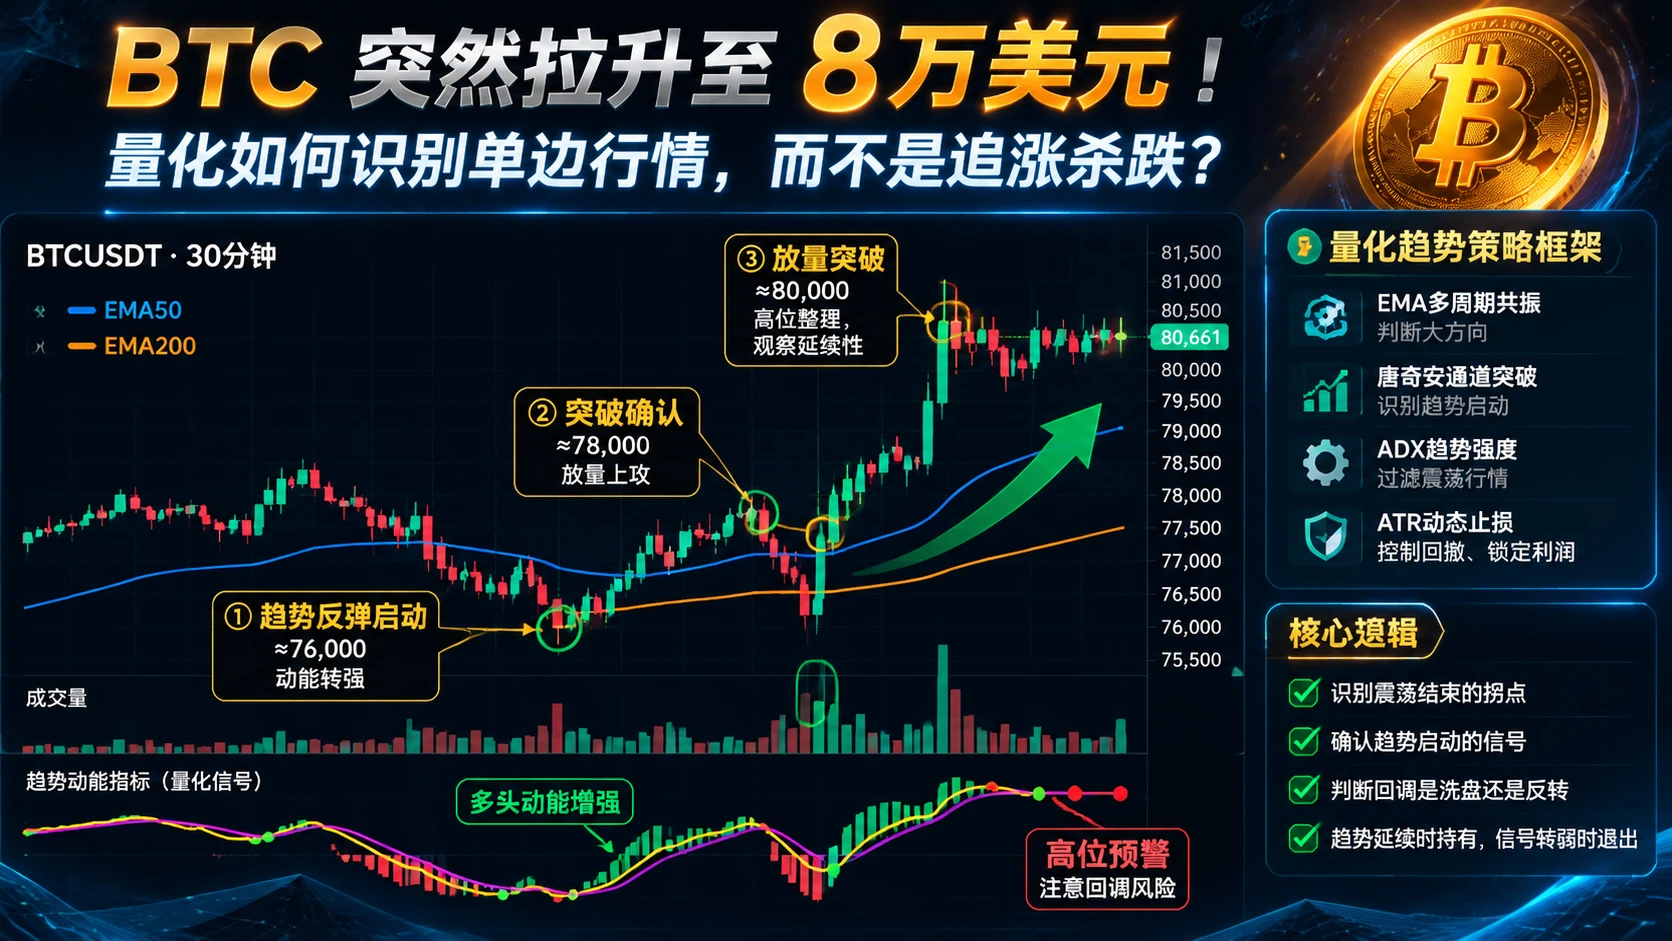
BTC surges to $80,000! How can quantitative strategies identify a one-way trend instead of chasing pumps and dumps?
When many people see BTC suddenly surge, their first instinct is to go long. But what’s really worth examining is: when does this move start to offer value for trend trading?
BTC rebounded rapidly from around $76,000, broke through $78,000, and then surged past $80,000 on rising volume.
Here are three signals worth watching:
① A sudden increase in volume: Volume clearly rose during the breakout, indicating greater market participation, but we still need to see whether volume can
post-image
BTC-0.67%
ETH-1.23%
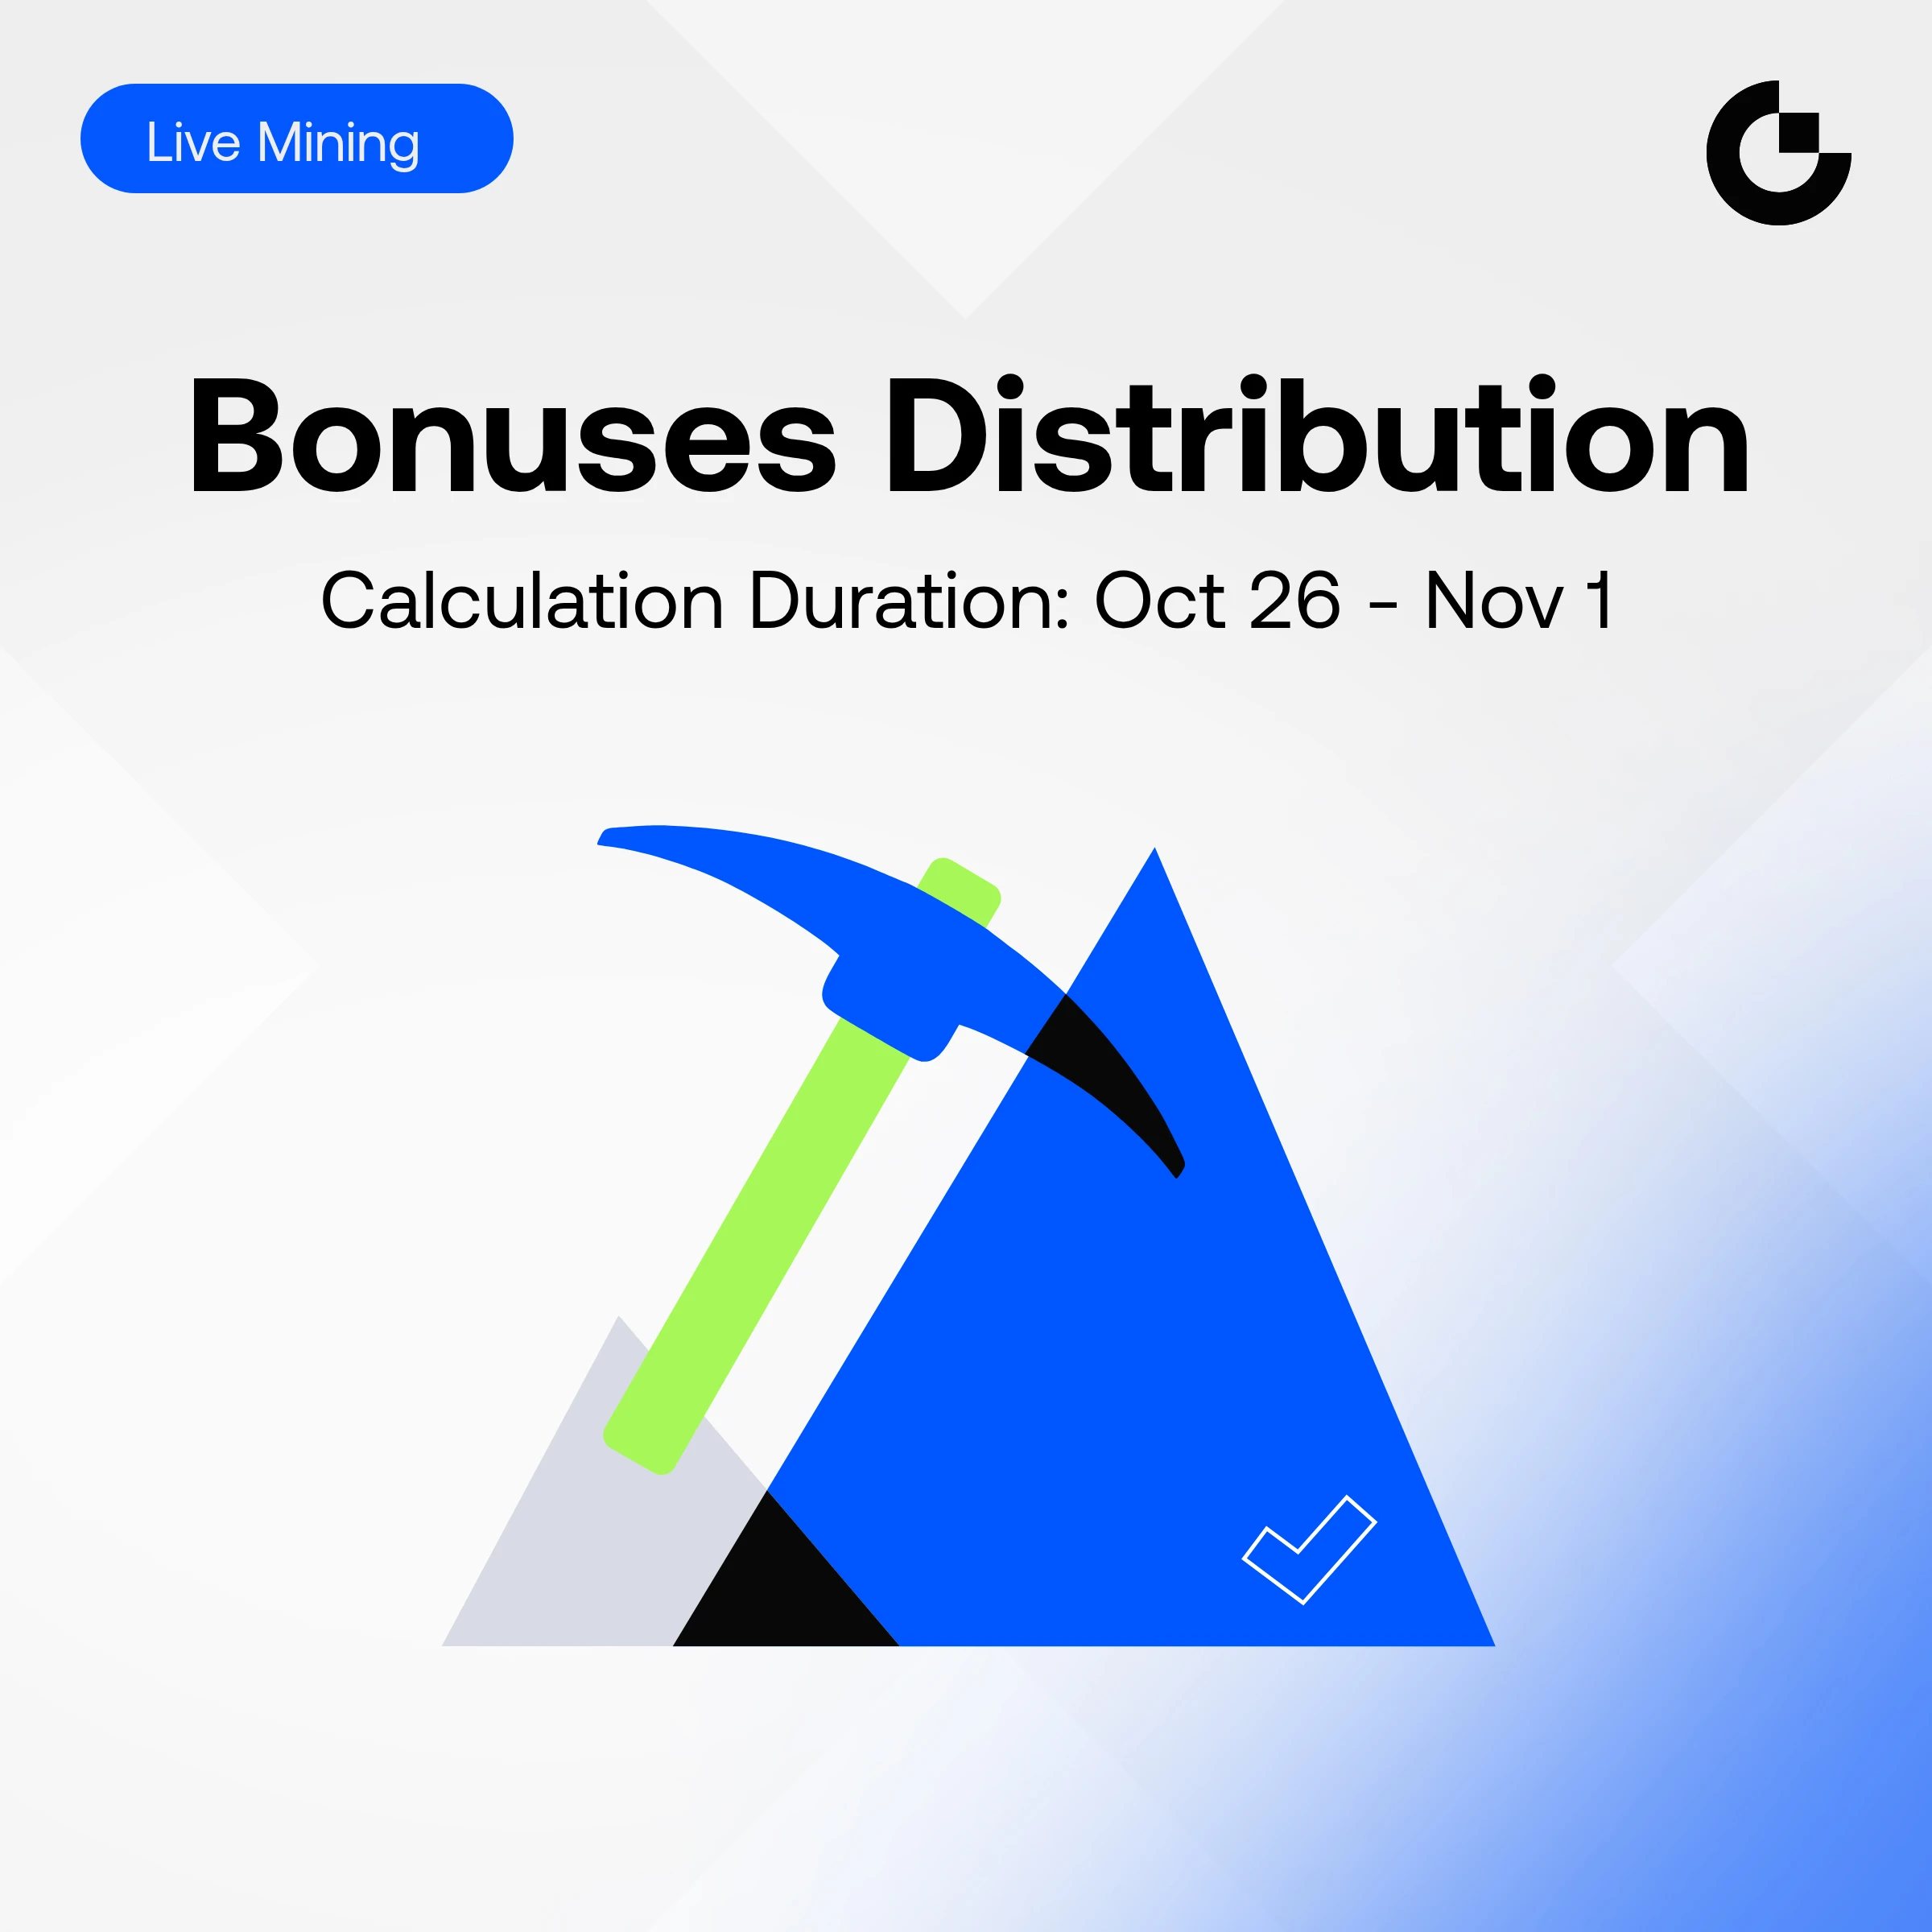
Gate Live Mining Bonuses Distribution Announcement (October 26 - November 1)
Check here: https://www.gate.com/social-mining-commission
▶Distributed Token: USDT
▶Distributed Date: November 5
▶View method: Assets - Spot
Learn about Live Mining Program: https://www.gate.com/announcements/article/102537
GateLive
Gate Live Mining Bonuses Distribution Announcement (October 26 - November 1)
Check here: https://www.gate.com/social-mining-commission
▶Distributed Token: USDT
▶Distributed Date: November 5
▶View method: Assets - Spot
Learn about Live Mining Program: https://www.gate.com/announcements/article/102537
repost-content-media
  • 2
Why did Brent crude fall below $100?
Following the midterm elections, Brent crude oil dropped by as much as 9% to $98.90, falling below the psychological $100 threshold for the first time since early October. This is not merely a price correction; it signals a shift in how the risk of conflict in the Middle East is being priced into the market.
The market is currently recalibrating political risk rather than simply counting barrels.
Why did this political shift drive prices down?
The Democrats' victory in both chambers of Congress has intensified pressure on the White House to bring an end to
post-image
XBRUSD-0.93%
XTIUSD-1.39%
BZ-1.18%
CL-1.83%
  • 9
  • 2
Morning market update
live-cover
LIVE1,127
Saw this morning: 2 years of Pro for free
I tried it out with a small account, and based on my experience, I don't recommend doing it
Stacking perks: 1 year of free Pro + 6 months from a Pixel phone + 6 months from a Samsung S25
I only stacked two; I didn't dare stack the last one
You could get banned at any time
Those who are bold can give it a try; I don't recommend it for anyone who hasn't tried it
post-image
Good morning, recap
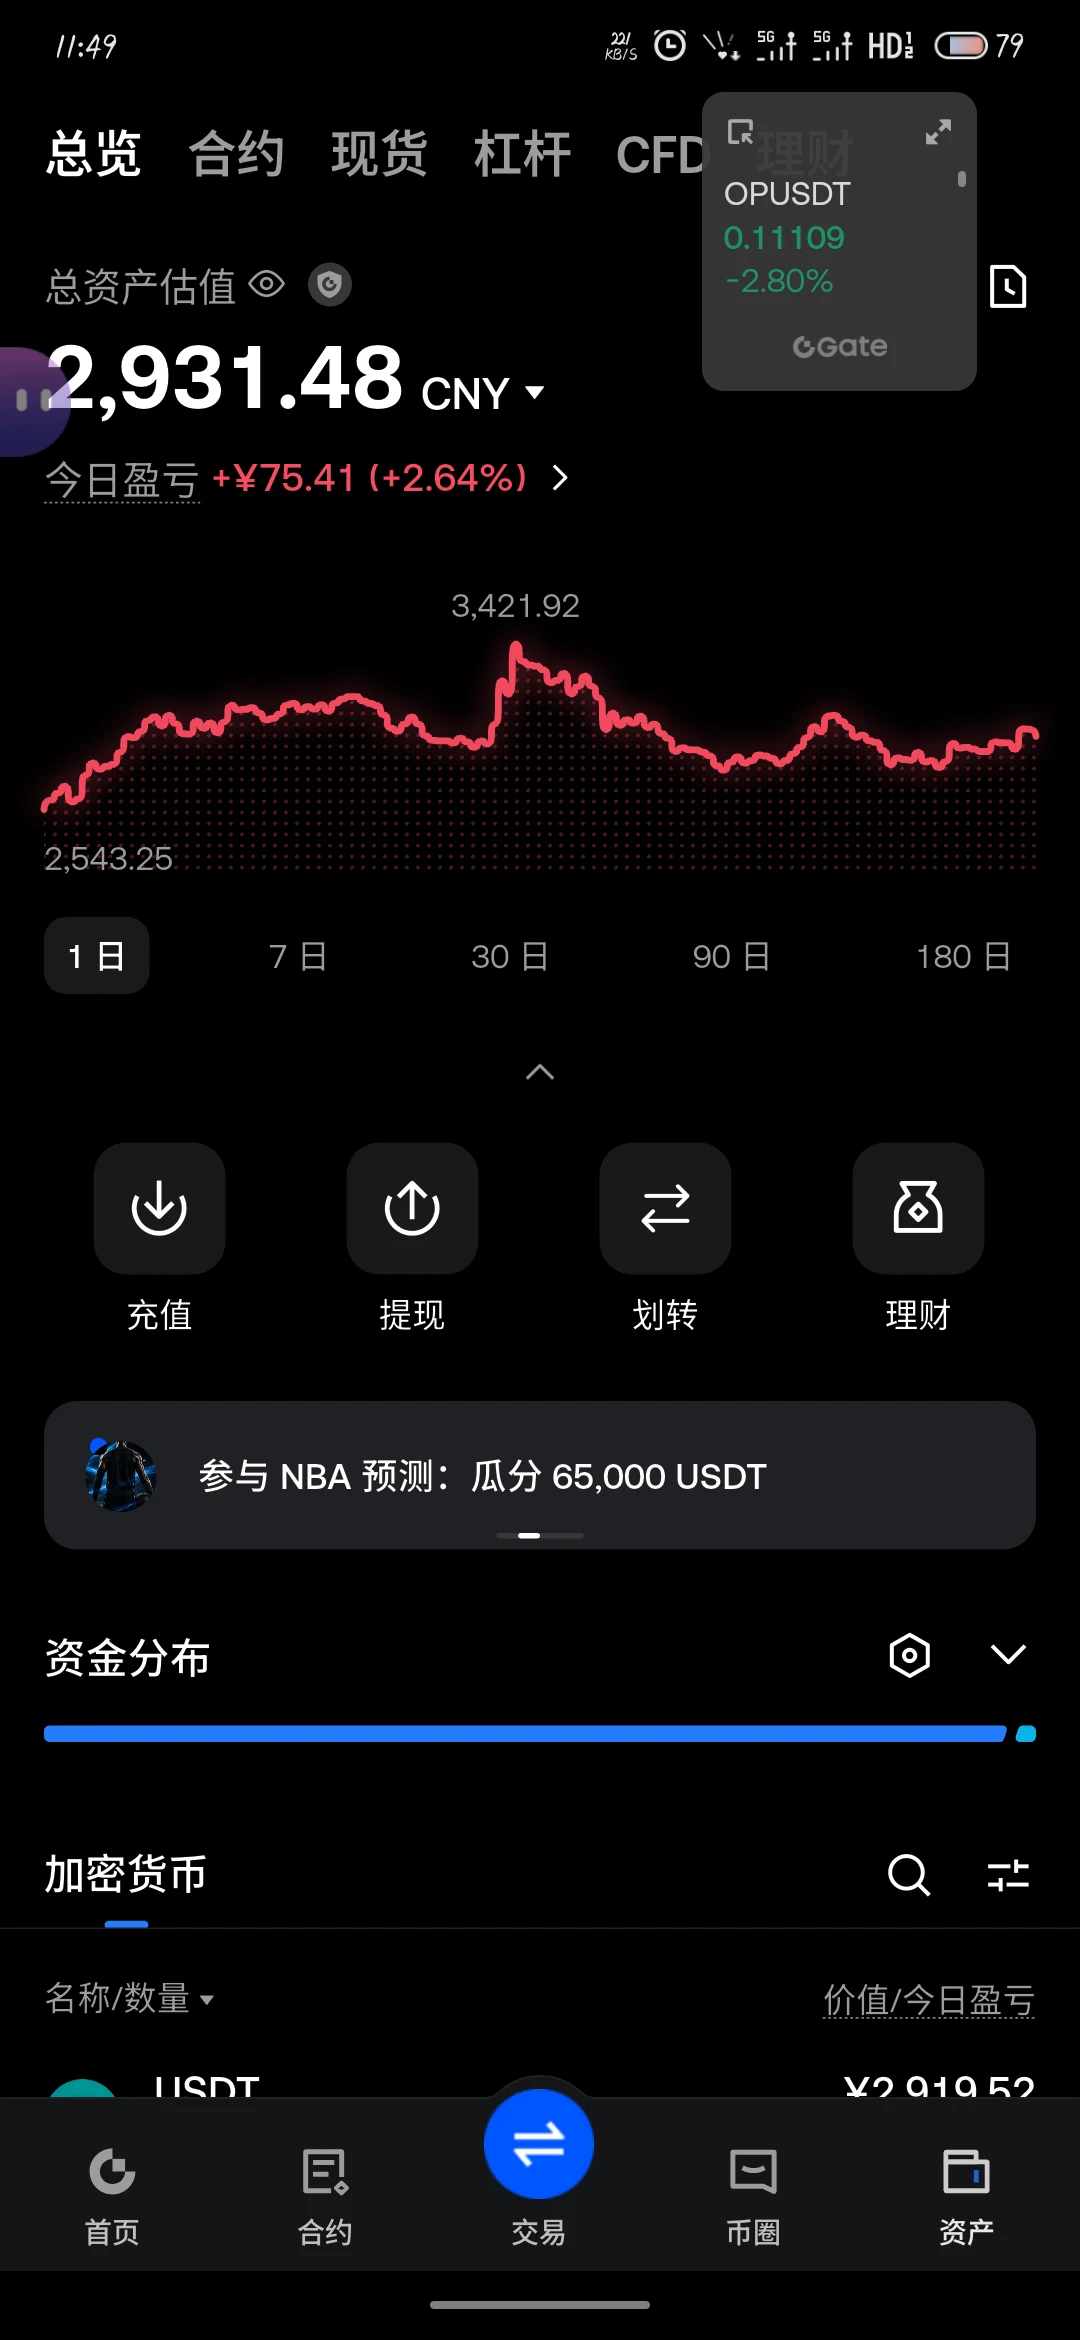
Continuing to hold the OP long position
The broader market is short-term bullish, but OP is still moving sideways and isn't very strong
Let's wait
Stay the course#OP
post-image
OP-1.31%
Support and resistance are the most fundamental and practical concepts in technical analysis. Many traders study candlesticks and indicators every day, but overlook an important question: At which price levels are buying and selling forces likely to shift?
First, support is an area where buying pressure may increase as the price falls. When the price approaches this level, some buyers may start entering the market, slowing the decline. But support does not mean the price definitely won't break below it.
Second, resistance is an area where selling pressure may increase as the price rises. When
BTC-0.67%
$KOR A needle is coming any moment now
post-image
#GateGuardActivationGuide
🔐 GATE GUARD ACTIVATION GUIDE: HOW CAN YOU ENABLE AN EXTRA LAYER OF ACCOUNT PROTECTION?
💡 WHAT IS GATE GUARD?
Have you ever wondered how to add another layer of protection to your Gate account? Gate Guard is a security feature designed to help users strengthen account protection. However, knowing that a security feature exists is only the first step. Understanding how to activate it is equally important.
Gate has published an updated activation guide explaining how users can enable Gate Guard on both mobile devices and the web. This makes the activation process eas
post-image
  • 1
Bitcoin Market and overview
live-cover
LIVE985
🔎 How to identify on-chain token restrictions using a blockchain explorer?
Don't just rely on what the project team says. Start with these six steps:
1. Verify the correct token contract address;
2. Check transaction statuses and failure messages;
3. Inspect restriction mechanisms in the public source code;
4. Verify the admin and key permissions;
5. Review historical transactions and permission changes;
6. Weigh the evidence before drawing a conclusion.
Note: Finding a pause function doesn't mean it's currently enabled; a failed transaction doesn't mean the assets have been frozen.
Next: Wha
post-image
Does a high funding rate mean the market is bound to fall?
Not necessarily.
A high funding rate may indicate crowded longs and rising holding costs, but it isn't a reversal signal. A negative funding rate likewise doesn't guarantee a rebound.
Combining price action, open interest, and spot trading volume gives you a more comprehensive understanding of the market.
Which indicator do you prioritize?
post-image
Huazi just keeps being bullish, a loyal bull!
Hope Huazi is right this time and can give it a solid boost.
post-image
BLSH+0.60%
  • 1
A couple stock trades I mentioned are performing great so far.
Who's riding with me?
The Dow surged 1,569 points in a single day, but AI computing stocks were slaughtered—what exactly is this market trading?
Folks, on the night of November 4, the U.S. stock market gave everyone a vivid lesson in “divergence.”
The Dow Jones Industrial Average surged 1,569.40 points in a single day, up 3.03%, closing at 53,356.12 and marking its biggest one-day gain since April 9, 2025. The S&P 500 rose 1.58%, and the Nasdaq gained 1.44%. If you only looked at the indexes, you’d think this was a bull market for everyone to celebrate.
But take a closer look at the market, and the picture is compl
US30+0.18%
#BTC重返8万 #每周来晒 #广场交易达人 #WCTCS9 BTC Market Analysis
BTC is currently around $80,650, up 4.9% in 24 hours, and has indeed reclaimed the $80,000 level. But this rebound has mainly been driven by short liquidations, while spot inflows have yet to catch up, so near-term price action is more likely to be choppy.
Here are the main things to watch
ETF flows: There have been cumulative net outflows of about $1.157 billion over the past three trading days, so this source of buying has yet to return.
U.S. stocks and macro factors: Falling Treasury yields and a rebound in U.S. stocks have supported this r
ThisIsTranslateContent:
#BTC重返8万 #广场交易达人 #WCTCS9 BTC Price Analysis
BTC is currently around $80,650, up 4.9% in 24 hours, and has indeed climbed back above $80,000[1]. But this rebound is mainly driven by forced short covering, while spot market inflows have yet to catch up, so near-term trading is more likely to be choppy.
Key factors to watch
ETF flows: Net outflows totaled around $1.157 billion over the past three trading days, so this source of buying has yet to kick in.
U.S. stocks and macro: Falling Treasury yields and a rebound in U.S. stocks have supported this recovery; U.S. employment data on November 6 will affect rate expectations.
· Leveraged positions: When the price quickly rebounded from $75,700, concentrated short liquidations amplified the gains. This type of buying often lasts only until the positions are closed.
Several key price levels
$81,000–$82,000: Near-term resistance; a move up to this level could easily be followed by a pullback.
$80,000: The key support level now. A daily close below it could lead to another test of around $77,600.
$85,000–$87,500: The area with the heaviest concentration of underwater holders and sell orders, making a near-term breakout difficult.
Two possible scenarios
If BTC holds above $80,000, ETFs see consecutive inflows, and trading volume expands: upside opens up, with $90,000 as the next target.
If BTC falls back below $80,000: Previous downward pressure will return, and the price could retest $77,600.
For now, trading within a range looks more suitable. Wait for ETF inflows to return and for the daily close to hold above $80,000 before deciding whether a new uptrend has begun.
Whether this rebound can last mainly depends on whether new money enters the market. A price rise accompanied by inflows into ETFs and stablecoins would indicate a more sustainable move.
On-chain data: See who holds the coins
Exchange balances: A decline means coins are being withdrawn and held, easing selling pressure; a rise suggests people are preparing to sell.
SOPR: Above 1 means most sellers are making a profit; below 1 means people are selling at a loss.
Long-term holder activity: Little movement in older coins suggests large holders are not selling.
Realized market cap: If it rises along with the price, that suggests new money is entering; if only the price rises, existing funds are probably just changing hands.
Market indicators: See whether money is flowing in
ETF net flows: Consecutive days of net inflows would show institutional buying has returned.
Total stablecoin market cap: A rise means money on the sidelines is still waiting to enter.
Trading volume: A rally on rising volume is much more solid than one on declining volume.
Funding rates: A return to neutral means leveraged chasing has cooled, making the market healthier.
Watch for these signals
Bullish: Consecutive ETF inflows, growth in the total stablecoin supply, and closes holding above $80,000.
Bearish: A fall below $80,000, a return to net ETF outflows, and a marked increase in exchange balances.
ETF outflows have yet to show a consistent slowdown, and the total stablecoin supply has not reached a new high, so this looks more like a short-term rebound; a trend reversal still needs confirmation from fund flows.$BTC
repost-content-media
BTC-0.67%
  • 6
Gm ,grinders
May our day be productive 🤲
post-image
Linking a ledger to Cosmos's IBC took nine or more manual transactions in July. It now takes one step.
The new tool has connected 14 public testnets, including Ethereum's Sepolia, Base, Avalanche, Hedera and the XRPL EVM.
@cosmos
ATOM+0.49%
ETH-1.26%
AVAX-0.10%
HBAR-1.36%
Load More

Join 40 M users in our growing community

⚡️ Join 40 M users in the crypto craze discussion

💬 Engage with your favorite top creators

👍 See what interests you

Trending Topics

BTCBackAbove80K

22.7k Views41.15k Discussing

After a sharp dip, Bitcoin climbed back above $80,000 on May 9 and is currently trading around $80,200. Over 50,000 traders were liquidated in the past 24 hours amid fierce long-short battles. The recurring Iran-U.S. tensions remain the primary short-term variable. Following U.S. airstrikes, Iran\'s Revolutionary Guard claimed to have breached the Strait of Hormuz defense line, leaving the ceasefire outlook uncertain. On the technical side, the daily SMA20 ,$77,970 serves as key support, with the RSI recovering from oversold levels to 43. The $80,000 level is both a psychological barrier and a bull-bear dividing line.Holding above it could lead to a challenge at $85,000, while a break may trigger a retest of the $77,000 area.

DemocratsWinBothChambers

16.68k Views433 Discussing

GateLaunchesTaiwanStockTrading

14.33k Views292 Discussing

View More