Square
Following
Hot
News
Notifications
Profile
Share your thoughts
placeholder
Article
The daily correlation between the S&P 500 and the 10-year Treasury yield is close to zero. The latest reading on Bloomberg’s rolling correlation chart is just 0.0766, almost right on the zero line. This indicator ranges from -1 to 1. The closer it is to zero, the weaker the link between their daily moves. A negative reading represents the “inverse relationship” between bond and stock prices, where yields rise as the stock index falls; a positive reading means they move in the same direction. For most of the past, it was in negative territory, at one point reaching close to -0.8. Back then, whe
post-image
SPYX+0.01%
SPX+0.33%
NAS100-0.07%
  • 6
  • 2
Morning Updates
live-cover
LIVE2,018
Trenches
fxUSD
f
bade
b
fxUSD
0x08...d8f6
Market Cap
$.
Change
.
24h Vol
$.
Holders
.
ZIG
Z
bade
b
ZIG
0x8c...1145
Market Cap
$.
Change
.
24h Vol
$.
Holders
.
BTC
B
bade
b
BTC
C5xp...pump
Market Cap
$.
Change
.
24h Vol
$.
Holders
.
CORLA
C
bade
b
CORLA
0xba...7777
Market Cap
$.
Change
.
24h Vol
$
Holders
.
STONK
S
bade
b
STONK
6GmA...UNgx
Market Cap
$.
Change
.
24h Vol
$.
Holders
.
🚨 Bitcoin and Ethereum ETFs are seeing heavy outflows.
BlackRock and other ETF providers reportedly sold $430.2M worth of $BTC and $100M of $ETH.
Institutional demand is worth watching closely. Are investors taking profits or becoming more cautious?
BTC-5.05%
ETH-7.19%
BLK-4.39%
#Banknifty
Almost a month old chart
Personally i wanted a LL to go little lower
Nevertheless, the up move came as expected 🤝
What Is Momentum Trading? Why Can Continued Price Increases Attract More Buyers, and Why Can Momentum Suddenly Fade?

In cryptocurrency markets, continued price increases may attract more traders to buy along with the trend, while continued declines may trigger more selling. Momentum trading looks for opportunities by taking advantage of the possibility that these trends will continue. But a rise does not mean prices will necessarily keep rising, and momentum can weaken or even reverse at any time.

First, what is momentum trading?

Momentum trading is a trend-following strategy that mainly lo
post-image
NEW MARKET UPDATE
live-cover
LIVE2,263
$AKE $AKE stages a strong rebound… the bulls have finally awakened. Long entry: 0.00385 – 0.00395 Take profit 1: 0.00430 Take profit 2: 0.00480 Take profit 3: 0.00550 Stop-loss: 0.00330 After a prolonged correction, AKE staged a strong rebound from the 0.001877 support level. Buyers are re-entering, but 0.0040 is the resistance level to break next. If upward momentum continues, we may see the price move toward 0.0048 – 0.0055. Let’s go, $AKE
post-image
AKE+6.07%
Why Can Backtest Results Look Great While Live Trading Turns Out Completely Different? Beware These Four Easily Overlooked Traps

In the cryptocurrency market, you may have seen trading strategies like these:

Historical backtests show a high win rate, an equity curve that keeps rising, and an apparently acceptable maximum drawdown. Strategy developers even show off impressive historical charts, making it seem that simply following the rules will produce good results.

But once you actually enter the market, the results may be completely different.

Actual execution prices differ from backtest
post-image
What is a mean reversion strategy? Why do prices sometimes return to the historical mean after deviating from it, while at other times they continue moving farther away?

In cryptocurrency trading, prices often fluctuate within a certain range. When a price deviates significantly from its recent mean, some traders look for opportunities to trade in the opposite direction, hoping the price will return to its normal range. But mean reversion is no guaranteed market rule. Especially when trends are strong or fundamentals change, prices may continue moving farther away from the mean.

First, what
post-image
GM CT ✌🏿✌🏿
Today will b green 💹
post-image
CT-12.34%
What Is a Mean Reversion Strategy? Why Do Prices Sometimes Return After Deviating from Their Historical Average, but at Other Times Continue Moving Away?

In cryptocurrency trading, prices often fluctuate around a certain range. When a price deviates significantly from its recent average, some traders look for opportunities to trade in the opposite direction, hoping the price will return to its normal range. But mean reversion is not a guaranteed market rule. Especially when trends are strong or fundamentals change, prices may continue moving away from the mean.

First, what is mean reversion?
post-image
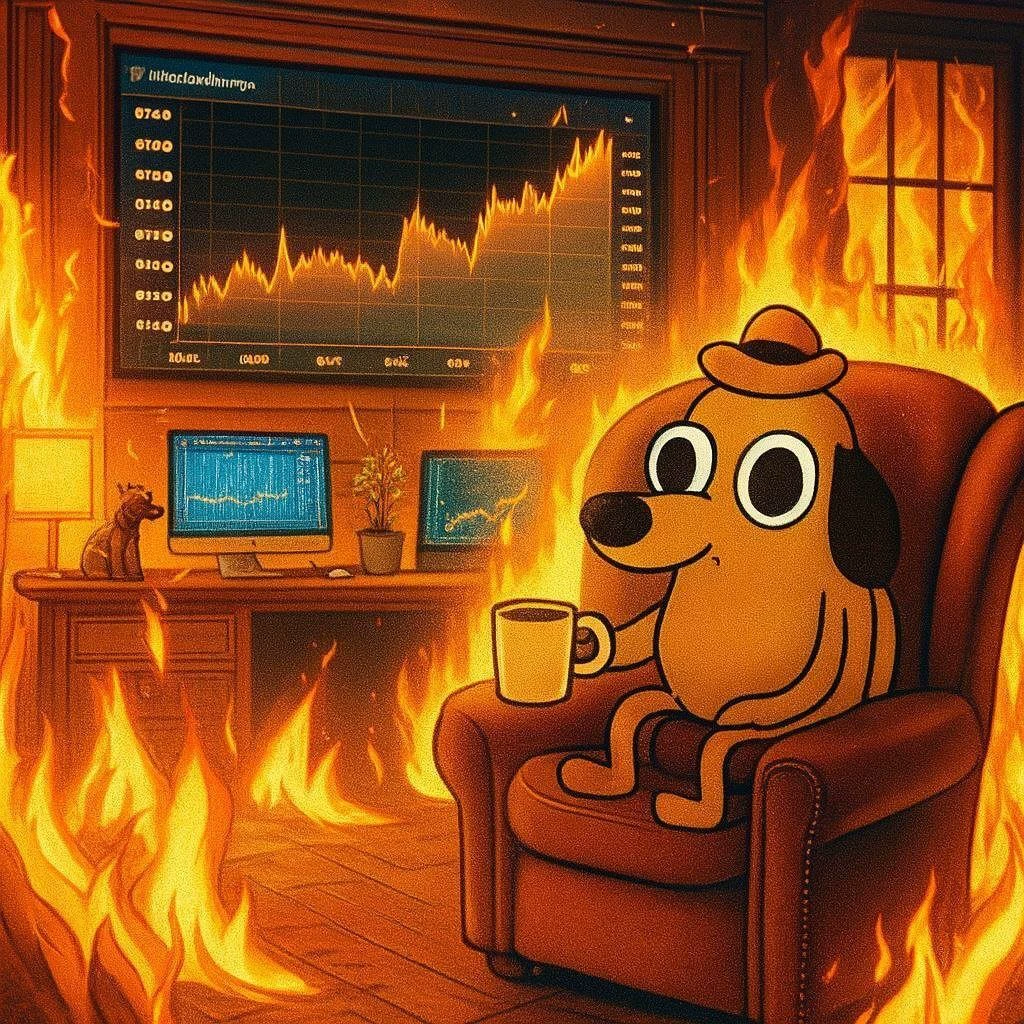
Aghhh fine'ally made it home.
Have a great night everyone see you all tomorrow.
Everything is fine!
🔥🐶🔥
post-image
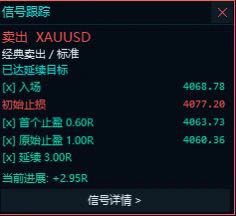
$XAUUSD Eat to your heart’s content
post-image
XAUUSD-1.11%
Why Are You More Likely to Make Mistakes After a Winning Streak?

There is a situation worth watching out for in cryptocurrency trading:

When you first start trading, you are cautious. Every time you open a position, you consider your stop-loss, position size, and risk.

But after several consecutive wins, you start to feel that you have figured out how the market works.

So you gradually increase your position size, widen your stop-loss, and even start skipping the trading conditions you had originally set.

Then, one market reversal quickly wipes out the profits you had accumulated.

Why do
post-image
BTC’s Ultimate Bull Trap Comes True! Head-and-Shoulders Pattern Unchanged, Keep Shorting! Is the Storage Sector Starting to Bottom?

Yesterday, Chief said BTC was still following the head-and-shoulders pattern, and shorting on the right side was the only thing to do. Longing BTC was never even considered. The market also confirmed our analysis: an ultimate bull trap!

With that in mind, the daily head-and-shoulders pattern in BTC remains in play, and today we can take an early entry based on the large bearish 4-hour candle. The key resistance on the 4-hour chart is 78,900. Only consider shorti
BTC-0.67%
ETH-1.26%
SNDK-22.24%
  • 9
  • 2
#CryptoMarketUnderPressure

The cryptocurrency market is facing increasing pressure as major digital assets experience price fluctuations and investors become more cautious. Market uncertainty is growing, and traders are closely watching Bitcoin, Ethereum, and other leading cryptocurrencies to understand the next direction.

The crypto market is highly sensitive to global economic conditions, investor sentiment, and financial developments. When traditional stock markets face heavy selling pressure, cryptocurrency markets can also experience uncertainty. This connect
BTC-0.67%
ETH-1.26%
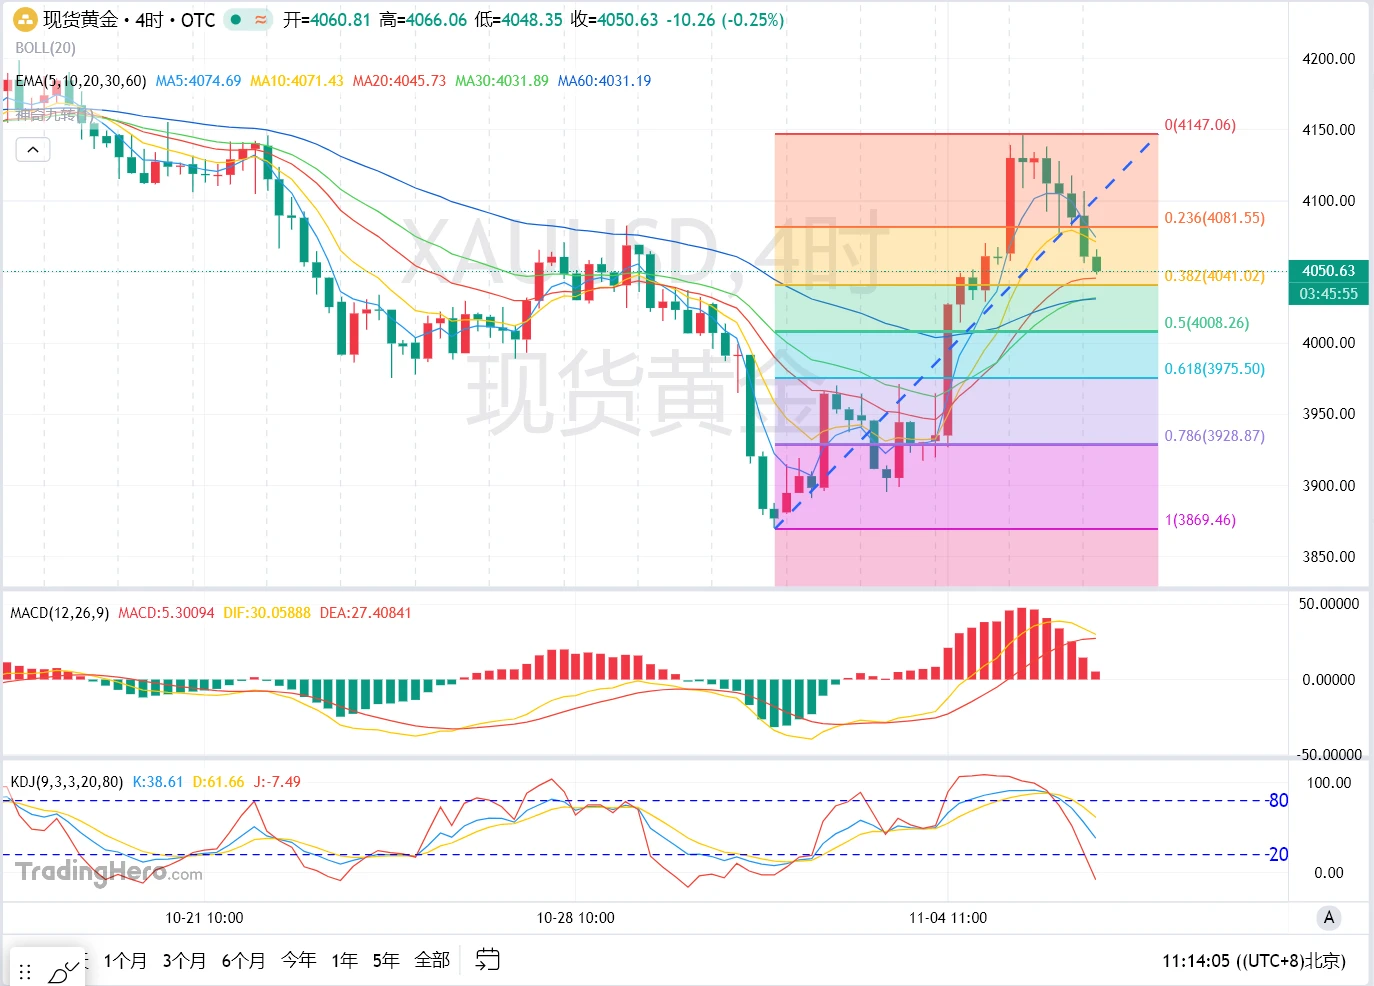
November 6: Gold enters a correction, pulling back sharply overnight

Yesterday, gold surged rapidly during the Asian session, with prices climbing to around $4,146. It then began to fluctuate lower during the European session, with the decline accelerating from session to session. Gold closed near $4,088. After opening slightly lower during today’s Asian session, prices continued yesterday’s weak trend, moving further down to test the $4,048 area.

The market logic has not changed, but the focus has shifted. With the midterm election results settled, expectations of a “blue wave” have been fu
post-image
XAUUSD-1.11%
#GateLaunchesPoSECProofOfSecurity #USStocksFaceHistoricSelloff

The US stock market is facing a historic selloff, creating uncertainty and concern among investors. Major stocks are under pressure, and market volatility is becoming an important topic for traders around the world.

A major market selloff can happen when investors become worried about economic conditions, company earnings, interest rates, or future market growth. When confidence becomes weak, many investors choose to reduce their positions, which can increase selling pressure across the market.

This situation reminds us that fin
#ETHDrops5.5% $ETH
‍#DailyStandouts #ShareWeekly
ETH Drops 5.5%: Tech Selloff or Ethereum's Own Weakness?

Ethereum's latest decline is a reminder that even major crypto assets are not insulated from stress in traditional markets. When technology stocks sell off sharply, investors often reduce exposure to other risk-sensitive assets as well. But ETH has another problem: its recent performance has been weaker than Bitcoin's, and capital-flow data suggests that this is not simply a one-day reaction to Wall Street.

The macro pressure is real

The November 5 selloff was broad. The Nasdaq droppe
ETH-1.26%
A single tweet sent both U.S. stocks and crypto crashing. This Democratic Party-affiliated “genius” is now being roasted to shreds across the internet. $BTC $ETH
$SNDK
Not one of them escaped, and market sentiment exploded instantly. Risk warning: The above does not constitute investment advice. Markets involve risks; invest with caution.
post-image
BTC-0.67%
Load More

Join 40 M users in our growing community

⚡️ Join 40 M users in the crypto craze discussion

💬 Engage with your favorite top creators

👍 See what interests you

Trending Topics

USStocksFaceHistoricSelloff

1.63k Views3.52k Discussing

U.S. stocks suffered a sharp selloff on Thursday, with the Nasdaq closing down more than 5% and the Philadelphia Semiconductor Index falling over 12%. AI and chip stocks including $NVDA and $AMD were hit especially hard. Markets are reassessing AI valuations, data-center spending and future returns. Is this just short-term deleveraging, or the start of a deeper correction in the AI trade? Which sectors are you watching next?

GateLaunchesPoSECProofOfSecurity

12.56k Views576 Discussing

USNonfarmPayrolls

9.83k Views4.01k Discussing

View More