Share your thoughts
placeholder
Article
$RAY Signal】Go long + buy the pullback/short squeeze from negative funding
$RAY After surging to 1.4328, 1H retraced to 1.3659; the 4H Bollinger upper band at 1.3902 remains unbroken, with bulls still in control. The 1H MACD histogram is narrowing, indicating waning momentum. Order book imbalance is 35.14%, with buy orders 2.08 times the sell orders, providing strong support below. The funding rate is -0.0835%, with shorts continuously paying, and a squeeze is imminent. The current price is within the recommended range, with a risk-reward ratio of 1.5 and a high potential return.
🎯Direction:
post-image
RAY+4.41%
BTC-0.44%
ETH-0.77%
SOL-0.86%
$LOE 10k Money Inflow Sends It Soaring
post-image
LOE+35.35%
A few days ago, my hands were shaking before bed, afraid my short position would get trapped. When I got up in the morning, I saw that the market had never triggered my stop-loss and, as planned, had ground all the way down to 0.00394, with unrealized profit already reaching +156.05%.

The logic for opening the short was simple: after rebounding to around 0.00429, it made several weak pushes higher, volume failed to follow through, resistance above was obvious, and the rebound lacked strength. The structure remained intact, so I held the short overnight.

I’ve now closed part of the position
post-image
ETH-0.81%
BNB-2.42%
BREAKING: Ethena’s USDe is now the largest dollar collateral asset on Morpho, with nearly $658 million supplied.
USDE+0.01%
  • 2
Live trading - Analysis crypto market
live-cover
LIVE2,059
Whether it’s accurate or not, you’re the ones to decide!
BTC continues to decline, and the shorting-at-highs strategy given in advance has once again been precisely validated 🔥
A pullback of nearly 2,000 points has already occurred, netting 52,610 USDT
The winning streak continues, and the battle never stops!
BTC-0.45%
📊 ICNT/USDT — TRADING ANALYSIS 🔥
ICNT is currently trading between key support and resistance levels. Traders can watch these zones closely 👀
📍 Key Levels:
🟢 Support: $87
➡️ $87 is a major support zone. If the price holds here and buying volume comes in, a bounce may develop.
🟡 FVG Zones:
• $94 — FVG
• $101 — FVG
📌 The price may retest/fill the Fair Value Gap (FVG) zones. Monitor price action and volume at these levels for a reaction.
🔴 Resistance: $106
➡️ $106 is major resistance. If a strong breakout and confirmation occur above this level, further upside may be possible.
📈 Bullish
INTC+1.70%
  • 1
$ACX is developing a constructive bullish bias as buyers steadily regain control. Momentum is building, confidence is improving, and the structure increasingly supports further upside. With sentiment shifting positively, staying involved looks compelling while wallet-related names like $MASK could follow the broader sentiment rotation.
post-image
ACX+0.89%
MASK-3.25%
  • 1
Retail investor: I check my 401k every single day & it's stressing me out. Red days ruin my mood.
Me: When's the last time you needed that money?
Retail investor: ...I'm 34. Not for like 30 years.
Me: So you're grading a 30 year investment every 8 hours.
Retail investor: When you put it like that...
Me: Look at this chart & cover the last month with your hand. Could you have guessed it from the first 11?
Retail investor: No.
Me: Then what is Tuesday's red day telling you about 2056? Nothing. It's just a number that doesnt mater...
Retail investor: So don't look?
Me: Once a month for 401ks. Inv
post-image
It is absent from the hot list, but COTI, with a market cap of 48.79 million, has already reached the very top of its 30-day range
Never thought I’d see the day: a 15-minute volume of 35.29 million versus an average of just 11.35 million in the previous hour—$COTI surged from 0.02015 to 0.02145 overnight, up +22.457% in 24h, and is sitting at 0.986 of its 30-day range. At this level, I only do one thing: reduce my position and lock in profits—never chase the rally.
This move is spot-driven—the funding rate is -0.00010261, and OI is down 12.71% from the 09-07 snapshot; futures have not joined
COTI+18.66%
Gold 🥇 night shift
live-cover
LIVE303
$SOL Signal】Short continuation + 1H momentum bearish
$SOL 1H MACD histogram -0.0749, RSI sits at 48.25, buy-side ratio 0.40, while sell orders continue to exert pressure. 4H Bollinger Band lower band 102.07 and upper band 106.07; price is sliding below the middle band. Order book depth imbalance is 6.66%; the best bid is slightly thicker but cannot withstand continuous selling pressure. Funding rate is -0.0057%, with no resistance from longs.
🎯Direction: Short
⚡Entry/Limit order: 103.2094 - 103.5200
🛑Stop-loss: 104.5552
🚀Target 1: 101.9672
🚀Target 2: 101.1908
🛡️Trade management:
- Execut
post-image
SOL-0.83%
SC flagged by a 5.7x volume ratio just got hit by a boomerang needle: its 25% gain retreated to halfway back
$SC That needle was truly nasty—up 25.794% in 24h, with volume reaching 5.7x the monthly average; the 0.00116 peak held for an hour before reversing to 0.000951, stuck halfway through the range. The direction is clear: I’m not chasing; I’ll buy dips in the support zone and admit defeat and exit if it breaks down.
The fundamentals are intact—the golden cross is still above the zero line, and the bullish MA7-over-MA30 alignment has reached day 17, while RSI at 60.6 remains far from overbo
SC+29.13%
I was just about to go to the forum and rant, but then I saw my balance. Never mind—the market is always right.
While everyone else was running, I didn’t panic along with them. The price bounced back to around 0.16393, with the volume getting smaller each time—clearly, the bait to lure in longs was too obvious. I opened a short position right away, set my stop-loss, and waited for the market to provide the answer.
The answer didn’t take long. The current price is already 0.10618, with unrealized gains of +692.8%. After eating this chunk of profit, I feel energized.
Manage your position properl
post-image
XRP-1.02%
ETH-0.81%
One 15-minute candle pushed out 21,020,000 in volume: PHA, with a $26.08 million market cap, singled out by funds
Wow, funds singled it out with a volume ratio of 9.539—$PHA swept from 0.0311 to 0.0335 overnight, touched 0.035, and gained 19.685% in 24h. I’m not chasing: buy the dip at 0.0261, and admit defeat below 0.0253. For this obscure token with a $26.08 million market cap, I’m holding the line at 0.0304 and not chasing.
The surge is cooling off—the latest three 15-minute volumes totaled 2918214, just a fraction of the 21023511 from that candle, and the 15m SAR at 0.0337 has also flippe
PHA+14.88%
BREAKING: Apple’s biggest product event of the year is today.
Here’s what markets are watching:
• First-ever foldable iPhone expected
• Potential price hikes across Apple products
• Bank of America remains bullish on
$AAPL
• New CEO John Ternus makes his major event debut
post-image
AAPL-0.25%
My hand trembled slightly when I set the stop-loss a few days ago, only to realize this morning that the filial piety was unnecessary. I opened the chart this morning and $DELL shot straight up, without giving anyone even a moment to catch their breath.

Luckily, this move wasn’t a spur-of-the-moment decision. I had my eye on it during those days of bottom consolidation, with buying pressure growing stronger each time and buyers stepping in to catch every pullback. So the entry was very clear: 453.65. The price has now reached 534.74, for a return of +862.4%. If this isn’t taking off, what is
post-image
DELL+0.55%
XRP-1.02%
BTC-0.45%
ETH Outlook and Trading Recommendations

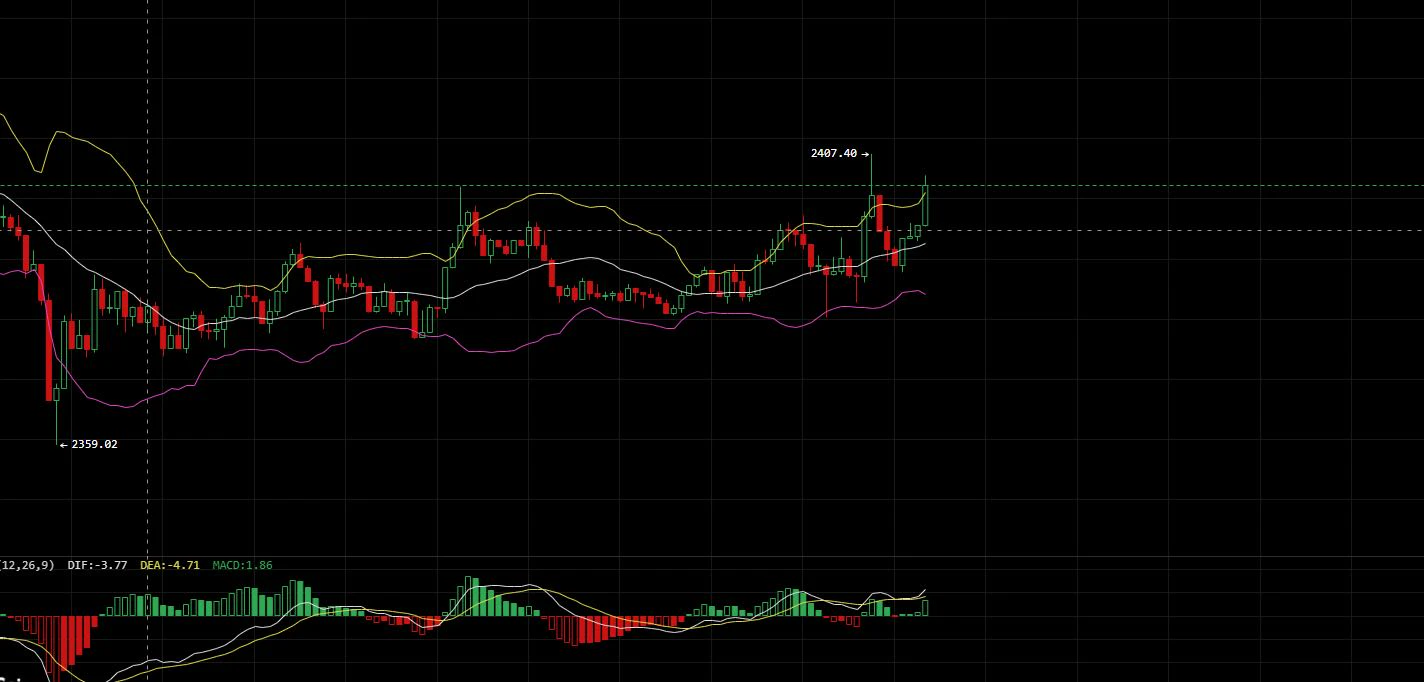
Current price: 2482. Slight pullback over the past 24 hours. Market sentiment indicators show that bears are in control, but no substantive breakdown has appeared on the chart. Overall, the market is in a period of high-level oscillation and consolidation.

On the four-hour timeframe, the price is trading above key support, while the Bollinger Bands are moving sideways. MACD bullish and bearish momentum is essentially balanced, with the indicator lines converging, and RSI remains in the neutral zone. Market sentiment is leaning bearish, reflecting onl
post-image
ETH-0.81%
Everyone down on 50%+ on the hat.
We still up over 20X
🤣🤣
The repricing will be aggressive with capitulation and general trench pullback.
The hat strategy goes 9 figures.
post-image
Most traders will ignore this UNI signal and regret it later.

$UNI /USDT - LONG

Trade Plan:
Entry: 6.352 – 6.410
SL: 6.020
TP1: 6.652
TP2: 6.833
TP3: 7.104

Why this setup?
Why now? The daily trend is firmly bullish, giving the broader backdrop for a long. The 15m RSI at 50.4 confirms momentum is neutral-to-rising, so we are not chasing an overextended move. The 1h ATR of 0.115841 tells us normal price swings are small enough to manage risk tightly around the entry zone of 6.352 to 6.410. TP1 at 6.652 and TP2 at 6.833 offer a favorable reward-to-risk from the 6.381 entry reference. The li
UNI-5.76%
Load More

Join 40 M users in our growing community

⚡️ Join 40 M users in the crypto craze discussion

💬 Engage with your favorite top creators

👍 See what interests you

View More