
Square
Following
Hot
News
Profile
Share your thoughts
placeholder
Article
$BTW I got in at 1.92 and got out at 2.58, capturing only a third of the 39% gain. I need to thoroughly review this trade.
While watching the market in the early hours, I noticed BTW had been moving sideways in the 1.86–1.90 range for nearly four hours. Trading volume suddenly jumped from a few million to the tens of millions—a classic sign of late-stage accumulation. I placed an order to enter at 1.92, allocating only 20% of my capital to the position. After all, Nasdaq futures had just fallen 0.8%, and the lingering effects of the Fed minutes’ hawkish tone were still weighing on risk assets
BTW+37.32%
NAS100-0.26%
BTC MARKET UPDATES
live-cover
LIVE1,407
Trenches
AGT
A
bade
b
AGT
0x5d...e274
Market Cap
$.
Change
.
24h Vol
$.
Holders
.
CNPY
C
bade
b
CNPY
0xc6...ddd2
Market Cap
$.
Change
.
24h Vol
$.
Holders
.
FOLIO
F
bade
b
FOLIO
0x5f...e411
Market Cap
$.
Change
.
24h Vol
$.
Holders
.
Q
Q
bade
b
Q
0xc0...0589
Market Cap
$.
Change
.
24h Vol
$.
Holders
.
FTR
F
bade
b
FTR
DFMt...pump
Market Cap
$.
Change
.
24h Vol
$.
Holders
.
$TIA suffered a major setback, but some interesting moves are emerging around $0.65. Sellers pushed the price sharply lower, but buyers are starting to defend this support level.
I plan to go long $TIA here, expecting the price to rebound to around $0.713. The recent bounce looks promising, but I’d like to see buyers hold above $0.664 before momentum picks up. Entry: $0.664–$0.668 Target: $0.680 / $0.700 / $0.713 Stop-loss: $0.6416
After a major sell-off, this is still a high-risk bounce trade. If $0.6478 gives way, the bullish setup will weaken significantly. Can $TIA reclaim $0.71, or wil
post-image
TIA-0.89%
No more insider holdings to pump the price
opepen your mind.
post-image
🔥 Today is a Historic day!
The #ArewaforAsiwaju Headquarters is now officially open.
2027 is locked in!
#A4A
Why hasn't my buy order been filled at the price I posted
Can any expert shed some light on this
$NEAR Short-term outlook: Bullish, but this is a weak rebound rather than a trend reversal; the key is to use the moving-average structure to judge whether the trend is healthy. MA5=4.9252 is still below MA20=5.0484, the bearish moving-average alignment remains intact, RSI=41.7 is in the neutral-to-weak range, and the MACD histogram=-0.01993 remains negative, indicating that mid-term momentum has not turned bullish yet. A reusable approach is to first determine direction from the moving-average alignment, then assess the risk-reward ratio based on the price’s position relative to the Bollinge
post-image
NEAR-1.09%
ALT+14.21%
WLD+0.51%
Retail investor: Make it make sense. Inflation came in HOT & bond yields went DOWN??
Me: Yep. 10 year went from about 5.35% to 5.08% in like 24 hours
Retail investor: but hot inflation should mean higher rates
Me: That’s the logic. The market doesn’t always follow logic in the short run
Retail investor: so why’d it happen
Me: People got scared of stocks & ran to bonds. When everybody buys bonds, bond prices go up... & when bond prices go up, yields go down. They move opposite
Retail investor: so it’s just fear
Me: Mostly. Money rotating out of stocks into “safety”
Retail investor: is that bad?
post-image
Floki all time high hype ath go
post-image
FLOKI-0.66%
( new streamer) market overview
live-cover
LIVE609
$AGT went from 1.6 cents to 8 cents. I can’t find the reason.
Look at the chart. It sat flat for a long time, jumped, paused, then jumped again. Now it’s about 5x higher.
It also passed its old high of around 4 cents, which makes this more than a bounce.
Normally a move this big has a reason: a partnership, a product launch or an exchange announcement. I looked for one on Alaya AI, the AI data project behind AGT, and found nothing.
One more fact: only about 58% of AGT’s supply is in circulation. The other 42% is still to come.
A big move with no visible reason usually means the story is arriv
post-image
AGT+80.84%
After Charlie was assassinated, Omar said his legacy belonged in the “dustbin of history.” Congress then turned around and protected her, not even allowing her immigration records to be subpoenaed. Who’s afraid of what? You can judge for yourself. So what’s the conclusion? I haven’t figured it out either.
post-image
$Eth can move toward 3k first
Chart looks healthy NFA
Buy the alts with me and hold soon they will go only up
In slow market no one believes
But honestly add low with me and have patience
post-image
ETH+0.27%
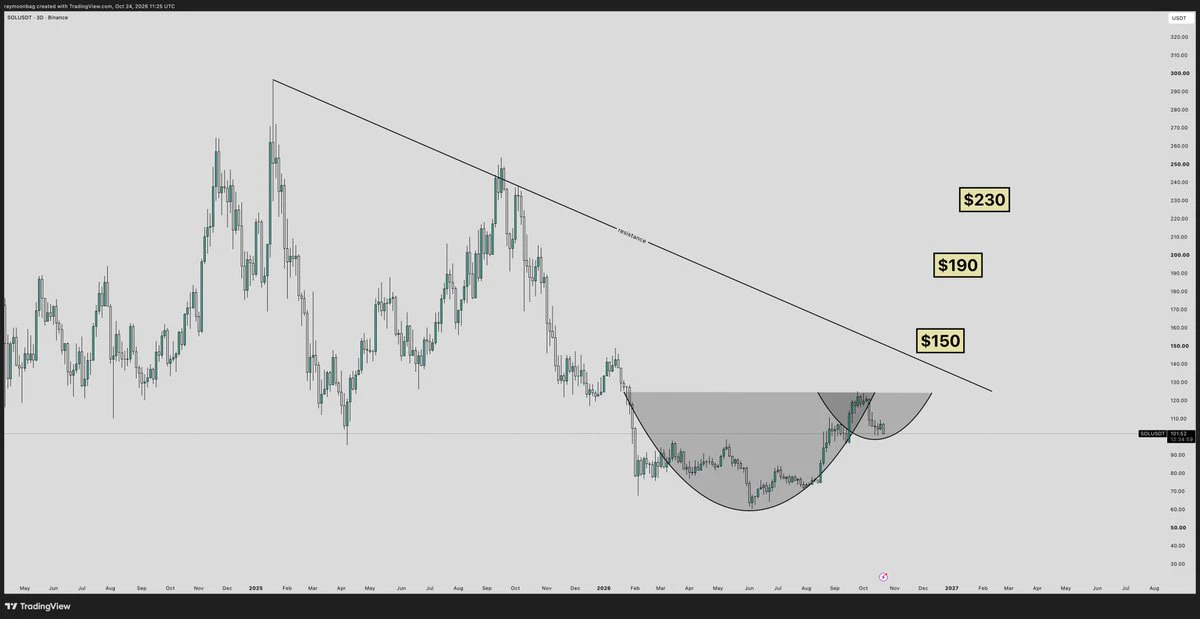
All eyes on solana:pumpCmXqMfrsAkQ5r49WcJnRayYRqmXz6ae8H7H9Dfn mobile app fees today. A new high on fees would signal that ~0.45% fees +- perps are another revenue stream the market isn't pricing in, especially on a slow weekend. If it happens, that would be a good long setup
post-image
SOL+0.40%
Only a handful more Ziggs variants to explore, right? lmao
post-image
FUN FACT: Less than 10% of the global population is invested in cryptocurrency.
post-image
VIP Exclusive Airdrop Carnival, Round 19
post-image
Russian forces are setting up a security zone and launched a massive overnight drone assault, sending pressure on Kyiv through the roof. Meanwhile, Washington has once again granted waivers for some sanctions on Russia—the political drama is even more convoluted than the battlefield. At this point, it’s all about who runs out of steam first. We’ll see this weekend how the sanctions easing plays out and whether it checks out.
post-image
Guy's $ICNT
bullish target is $0.2400, with further upside expected after a strong breakout. Trading strategy: Long entry range: $0.2200–$0.2240 Target 1: $0.2300 Target 2: $0.2400 Target 3: $0.2550 Stop-loss: $0.2120 After breaking through the $0.2000 resistance zone, ICNT has shown strong bullish momentum. If buyers can maintain support near $0.2200, the price may move toward the next resistance level. A break below support could trigger a short-term pullback. $BTWGTC
post-image
ICNT+27.09%
Load More

Join 40 M users in our growing community

⚡️ Join 40 M users in the crypto craze discussion

💬 Engage with your favorite top creators

👍 See what interests you

Trending Topics

USSeptemberPPIBeatsExpectations

91.35k Views1.93k Discussing

US September PPI came in at 6.3% YoY, well above the 5.3% market expectation, pointing to renewed producer-side inflation pressure. Weekly jobless claims were 199K, broadly in line with forecasts. Could hotter inflation further reduce room for rate cuts, and what does it mean for $BTC, US stocks, and gold?

GateWCTCS9GlobalTradingCompetition

37.87k Views6.67k Discussing

GateBTCAndETHFuturesVolumeRanksTop3

53.8k Views1.81k Discussing

View More