Share your thoughts
placeholder
Article
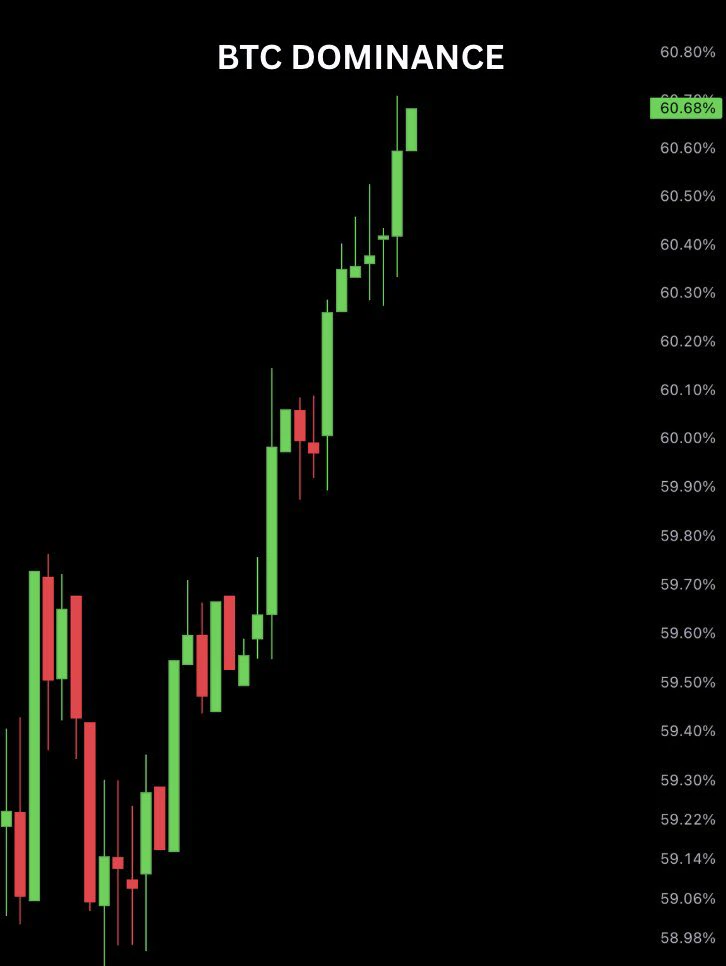
#Altcoins relative strength vs bitcoin:native is breaking out
What does this mean?
IYKYK
post-image
BTC+0.31%
  • 2
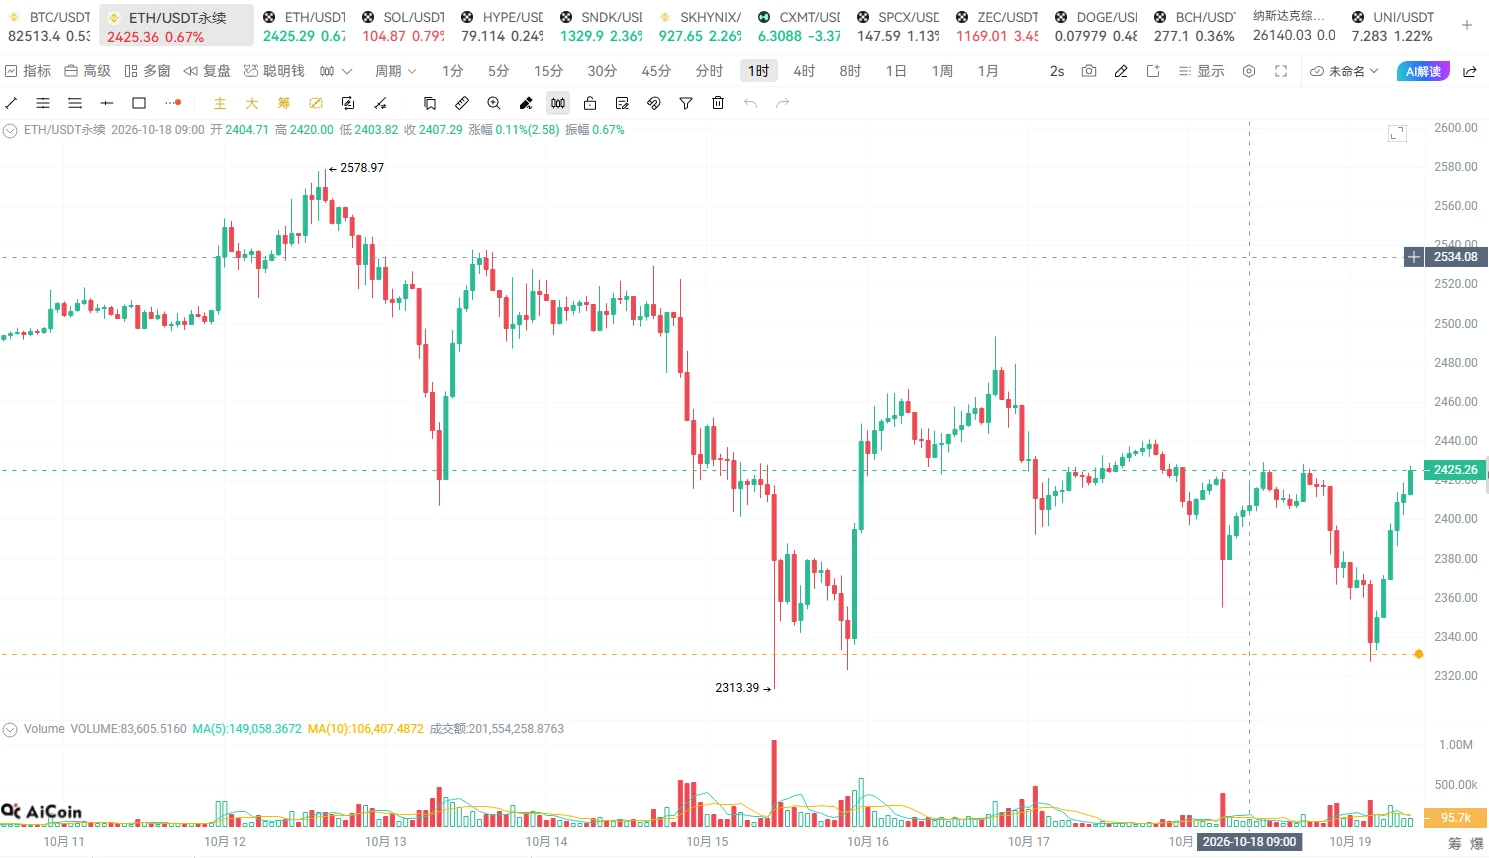
If $ETH gets above $2,570 you will see another 12 hours of straight up green candles!
post-image
ETH+1.41%
$XMR
There is a structural scarcity on centralized exchanges, and that will amplify any real demand spike… if another wave of demand hits while CEX inventory stays low, the move will be strong. The remaining float is small and fragile, so volatility will stay high.
post-image
XMR0.00%
This trend doesn’t even require me to think—the account is out there dancing on its own.

During the repeated intraday fluctuations, $BTR surged to 0.17647. It looked like a breakout on the surface, but the volume didn’t follow, so there was simply no one buying up there. I opened a short position directly at that level, waiting for the false breakout to reverse on its own.

I took another look before the close, and 0.04843 had already returned to my expected range, putting +1428.51% in my pocket. I held the short without letting go, trusting this resistance level. I didn’t make a rash move
post-image
BTR-4.96%
BNB+6.62%
DOGE+6.44%
Repeated rebounds have been thwarted, and the short-term outlook for $ZAMA has completely weakened.
After multiple failed attempts to hold above the upper price levels, incremental capital has stopped entering, and the market has entered a stock-based game. High-level holders are gradually taking profits and exiting, selling pressure on the order book continues to be released, and indicators reflect weakening bullish momentum, leaving room for a pullback.
Prices continue to probe lower, remaining in a weak range in the short term with intense volatility, and a rebound recovery may occur at an
post-image
ZAMA-2.59%
DOGE+6.44%
#Gate用户突破6000万,来
🚀 Gate Reaches 60 Million Users — A Milestone Worth Celebrating!
Gate has officially reached an incredible milestone of 60 million users worldwide!
60 million users means 60 million different journeys, experiences, trades, opportunities, and stories. Some users may remember their very first trade, while others may remember a market move that taught them an unforgettable lesson.
From taking the first step into crypto to learning how to trade, manage risk, and understand the market, every journey is unique. And behind this 60-million-user milestone are millions of individual
post-image
GPT6 is nowhere near enough; it gets used up too quickly.
post-image
I didn’t enter immediately during the first wave of decline because after this kind of rapid sell-off, there is often an exaggerated rebound, and chasing shorts can easily result in getting stopped out badly. So at the time, I only marked a key zone at the highs and didn’t rush to act. The price did rebound afterward as expected, but near the key zone, it failed to show the rebound strength it should have had, with each lower-timeframe candlestick weaker than the last. Only then did I enter short in the direction of the decline. Since the entry was relatively close to the key zone, setting the
post-image
ETH+1.40%
BNB+6.62%
Most traders still think DOGE is bullish—here’s the 4h signal they’re ignoring.

$DOGE /USDT - SHORT

Trade Plan:
Entry: 0.08945 – 0.09013
SL: 0.09301
TP1: 0.08737
TP2: 0.08576
TP3: 0.08334

Why this setup?
Why now?
- RSI 15m at 43.67 = weak bounce, sellers reloading.
- 1D trend is *range*, not uptrend—so shorts work at range highs.
- Entry zone: 0.08945–0.09013. TP1 at 0.08737 is a 2.7% drop; TP3 at 0.08334 is a 7% drop.
- Stop at 0.09301 caps risk above range midpoint.
- Confidence 55% isn’t screaming, but the asymmetry (risk ~3.5% vs reward ~7%) favors the short.

Debate:
If D
DOGE+6.44%
I just switched the app to the background, and it shot right back up—are you playing hide-and-seek with me?

When I checked the chart after lunch, it was still grinding along the bottom, but the K-line had already printed several long lower wicks in a row. When I opened it again in the afternoon, I happened to catch the high-volume breakout. This kind of upward move clearly isn't something retail traders can lift, so I went with the trend and opened a long at 13.489, starting with a small position to test the waters.

Now at 17.821, $SNXX the rally has been very clean, and the return on my p
post-image
SNXX+3.39%
SNDK+1.83%
LAB+1.71%
WLD's 4h chart is whispering a short—but 55% confidence means the market is laughing at certainty.

$WLD /USDT - SHORT

Trade Plan:
Entry: 0.3960 – 0.3982
SL: 0.4076
TP1: 0.3892
TP2: 0.3839
TP3: 0.3760

Why this setup?
Why now? The 1D trend is *range*, not breakout—so mean-reversion rules. RSI on 15m sits at 51.01, dead neutral, giving price room to drop without overbought friction. Entry ref at 0.3971, with TP1 at 0.3892 (a clean 2% sweep) and TP2 at 0.3839—that's where the range's lower lip likely bites. ATR on 1h (0.004387) is tight, so the move should be slow, not violent—perfect for a
WLD+3.17%
market overview
live-cover
LIVE1,092
Don’t just show your profits! What’s really interesting is why you dared to bet on this side.
Recently, after taking part in Gate’s event contract P&L-sharing challenge, I found that the most interesting part of this format isn’t simply showing how much you made, but laying out your full market judgment.
The biggest appeal of event contracts is that every choice is based on a clear question: up or down? Breakout or pullback? Will a certain event ultimately happen?
My approach has always been fairly simple: look at the macro picture first, then price, and finally market sentiment. For example,
BTC+0.34%
$SUSHI Signal】Long pullback stabilizing + short squeeze setup
$SUSHI RSI 1H 73.35, 4H 71.86; the strong zones on both timeframes remain intact. The price fell from 0.2828 to the 0.2452-0.2556 range, with buying repeatedly absorbing the pullback and clear support orders around 0.2466 below.
🎯Direction: Long
⚡Entry/Limit order: 0.248353 - 0.249100
🛑Stop-loss: 0.246609
🚀Target 1: 0.252836
🚀Target 2: 0.254705
🛡️Trade management:
- Execution strategy: Reduce the position by 50% after reaching Target 1 and move the stop-loss up to breakeven. If the price falls back to the entry level, exit aut
post-image
SUSHI+32.20%
morning update 🥰🌹
live-cover
LIVE1,945
A few days ago, I placed a limit order for $ZEC , which filled at around 828.40. I wasn’t expecting much, but when I woke up, I found that the market had already started moving in the direction I expected. After confirming that the candlesticks and volume were moving in sync, indicating that the upward move was not weak, I held the long position and observed.
After the price surged to the key level, a rapid wick appeared, and short-term divergence began to increase, reminding me not to get greedy. Without clinging to all the unrealized profits, I took profit on 80% first and moved the protectiv
post-image
ZEC+0.82%
BNB+6.62%
SOL+1.43%
THIS IS INSANE. 🤯
$Nike is getting removed from the S&P 100. After nearly 18 years.
It joined the index in December 2008. It's leaving September 21.
$230 billion in market cap evaporated to get here. An 80% crash from peak. One of the most recognizable brands on the planet, quietly falling out of one of the most exclusive stock indexes in the world.
Here's the part that makes this worse than just a bad stock chart. When a company gets removed from an index like the S&P 100, every index fund tracking it is forced to sell automatically. Not because they want to. Because their mandate requires i
post-image
NKE-0.86%
SPX+1.63%
I originally just wanted to freeload a breakfast, but the market ended up wrapping me in dumplings for half a year.
During the repeated intraday oscillations, the bottom never broke down. Someone stepped in to buy every pullback, while capital quietly entered the market. I judged that the bottoming process was nearly over, so I directly opened a long near 833.19.
The price has now climbed to 1018.4, $ZEC this move really delivered the answer, with the return on the position reaching +1578.39%. Those who stayed on board should be grinning in their sleep. It was truly sluggish at first, but the
post-image
ZEC+0.82%
ADA+4.03%
ETH+1.40%
Very nice, productive day for $NEAR. Very good movement with over 2 billion market cap overall. The trading volume is up over 109 percent in the last 24 hours. So more and more traders are trading NEAR protocol
The AI agent element has been good. You can get AI options and interference by staking NEAR Protocol. Plus, big-time companies and institutions are adding more NEAR Protocol.
The movement is real here. The chart is saying that if the support can hold the current price of $2.20, it can begin to test the $2.30 price level or even higher. I call that a big win.
post-image
$FHE Signal】long: 1H volume-backed dip and support + 4H high-level consolidation
$FHE Current price 0.1172. After rising to 0.1408 on the 4H chart, the price pulled back, interrupting the bulls’ proactive advance. The 1H MACD bearish histogram is expanding, indicating short-term selling pressure is being released. Buy orders are densely stacked around 0.1160, while the 1H Bollinger lower band is at 0.0990. The latest candle closed with a lower wick, with clear wick-buying action appearing around 0.1155.
🎯Direction: long
⚡Entry/limit order: 0.116848 - 0.117200
🛑Stop-loss: 0.116028
🚀Target
FHE+11.55%
BTC+0.31%
ETH+1.41%
SOL+1.39%
Load More

Join 40 M users in our growing community

⚡️ Join 40 M users in the crypto craze discussion

💬 Engage with your favorite top creators

👍 See what interests you

View More