


Share your thoughts
placeholder
Article
$SOL Signal】4H death cross + order book sell pressure, short attack
$SOL 4H MACD death cross in progress, with the price below and hugging EMA20. Sell pressure dominates the order book, with a depth imbalance of -5.93% and a bid-to-ask ratio of 0.89. The 1H Bollinger Bands are narrowing, volatility is contracting, and a short-term reversal point is approaching.
🎯Direction: short
⚡Entry/limit order: 101.6641 - 101.9700
🛑Stop-loss: 102.9897
🚀Target 1: 100.4404
🚀Target 2: 99.6757
🛡️Trade management: - Reduce the position by 50% upon reaching Target 1 and move the stop-loss up to breakeven.
post-image
SOL-1.35%
BTC-1.23%
ETH-1.93%
#GateTops7DayNetInflowsGlobally 🌍🔥 Gate Tops Global 7-Day Net Inflows!
Gate is making a strong move as it ranks among the top platforms globally for 7-day net inflows. 📊💰
This momentum highlights growing user activity and confidence across the crypto market. 🚀
👀 More capital. More activity. More opportunities.
The Gate ecosystem continues to move forward! 💙
#GateTops7DayNetInflowsGlobally #Gate #Crypto #CryptoMarket
post-image
$NET /USDT Perp – "Bearish Rejection – Short"**
**Trading Plan Short $NET
Entry: 277.50
SL: 278.80
TP1: 276.40
TP2: 275.50
NET is rejecting below the 278.7 yellow line and the EMA30 after spiking to 280.2. MACD is bearish; short the weakness and stop out above the recent 24h high resistance zone.
post-image
NET-1.74%
  • 3
  • 1
Everyone’s chasing gold’s新高—but XAUT just flashed a 4h SHORT signal nobody sees coming.

$XAUT /USDT - SHORT

Trade Plan:
Entry: 4425.2 – 4431.0
SL: 4455.8
TP1: 4407.3
TP2: 4393.4
TP3: 4372.6

Why this setup?
Why now?
- Price pinned at 4428 with a 1D “range” tag—not a breakout.
- RSI (15m) at 51.6 = zero momentum; ATR (1h) 11.56 says volatility is shrinking, not expanding.
- Entry zone 4425–4431 is a trap door: TP1 at 4407, TP2 at 4393—that’s a 0.8% drop before the real move.
- Confidence 55 is low, but the structure says “short the rip, not the dip.”

Debate:
If gold stalls here,
XAUT-1.02%
The problem is not that people are afraid to take a position, but that after taking one, they keep wondering whether they are going to sell too early. Today’s handling of this $BULLA long position is a good example: I entered around 0.028584, and it later reached around 0.074967. When the overall unrealized profit hit the key level of +1628.59%, I agonized several times over whether to close the entire position immediately.
In the end, I followed the plan I had set beforehand: I took 70% of the position off the table first to secure the profits, and continued watching with the remaining 20% pr
post-image
BULLA+141.34%
BNB+3.42%
SNDK+11.17%
Right now, I would be very cautious about opening new short positions.
Over the past 24 hours, liquidated positions across the entire market have exceeded $400M.
And approximately 90% of the losses were incurred by those betting on a decline.
This is no longer simply a typical case of “shorts getting it wrong.”
When such a massive volume of short positions is forcibly liquidated, those positions directly turn into fuel for an upward move.
What’s most interesting?
Some people are still continuing to short.
The market has already made the trend clear, yet they are still fighting against it.
post-image
  • 2
$PI Pi has introduced new features for developers building on Pi, including local storage support, access to app-specific staking data, and file and video sharing.
post-image
PI-1.00%
#Share My Holding Returns#
focus on Doge yes just doge for today ‌ ‌$DOGE is down too but this ia good profit ‌ ‌
DOGE-1.76%
Market Prediction And Live Trading Signal
live-cover
LIVE1,998
📉 Big surprise in the jobs market! The U.S. added 162,000 jobs in August—triple economists' expectations! 🚀 Could this signal a bumpy road for $BTC ? What’s your take on the Fed’s next move? #CryptoNews
BTC-1.23%
Plunging straight down, gold has nosedived 100 points in a single day—the second wave of the decline!
The fairest thing about the market is that every judgment will ultimately be validated, whether it was the first wave down to 4470 or the positioning ahead of the nonfarm payrolls report. The market has validated them all. (All posts were made public in advance and can be reviewed.)
Those who understand are already counting their money. I’m really not bragging here—there’s simply no need to. Every idea, trade, direction, and target was provided in advance and made public. I can’t bring myself
XAUT-1.02%
$XRP
A flawless chart, a perfect correction, and a beautiful breakout from the downtrend...
The next few weeks are going to be very exciting.
2.5$⌛️
3.5$⌛️
6$⌛️
13$⌛️
Save it, share it, and wait.
post-image
XRP-2.85%
  • 1
✨️ After 7 straight months of selling, $DASH has finally picked up fresh volume and has gained over 130% in just two weeks. If it can hold the $70 level it just reclaimed, I see another 20% upside, with a target around $85. 🚀
Is this the start of DASH’s revenge rally?
Miss DASH now, regret it at $85?
is DASH about to explode?
Comment below ✅️✅️
$DASH ‌#BTCReclaims80K
post-image
DASH+34.78%
#GateTops7DayNetInflowsGlobally
GATE CROSSES $300M IN 7-DAY NET INFLOWS
Gate has recorded approximately $300.43 million in net capital inflows over the past seven days, placing it among the top three globally according to the latest DeFiLlama-based data. The figure is significant because it shows that capital movement toward Gate has remained strong even while the broader crypto market is dealing with elevated volatility and changing macro expectations.
WHAT DOES $300M+ NET INFLOW ACTUALLY MEAN?
Net inflow is not simply the amount of money entering an exchange. It represents the difference b
post-image
Falcon_Official
#GateTops7DayNetInflowsGlobally
Gate is making a strong statement through capital flows. According to DeFiLlama data, Gate recorded approximately $273.72 million in net capital inflows over the past 7 days, placing it among the top three centralized exchanges globally. For an exchange, this is more than just a large number on a dashboard—it shows that a significant amount of capital has moved onto the platform after accounting for outflows.
The important word here is “net.” If users deposit $500 million but withdraw $226 million during the same period, the net inflow is roughly $274 million. That means the headline figure is measuring the difference between money coming in and money leaving, rather than simply counting deposits. This makes a sustained positive seven-day figure a useful indicator for understanding where exchange liquidity is building.
A seven-day window is particularly interesting because it filters out some of the noise that can appear in a single day. One large transfer can make a 24-hour ranking look impressive, but maintaining strong net inflows across an entire week suggests broader activity. Capital may be arriving for spot trading, derivatives, portfolio repositioning, new listings, hedging or simply to keep funds ready for opportunities.
There is another reason this number deserves attention. Exchange inflows should never be interpreted as an automatic bullish signal for the entire crypto market. Coins moving onto an exchange can eventually be used for buying, but they can also be deposited for selling or hedging. The stronger interpretation comes when capital inflows are combined with trading volume, price action, stablecoin liquidity and user activity. In other words, inflow tells us where capital is moving; market behavior tells us what that capital is actually doing.
Gate's broader flow picture also adds context. DeFiLlama data cited by Gate showed approximately $520.45 million of net inflows over the past month, ranking Gate third among centralized exchanges globally. The seven-day figure therefore fits into a larger story of meaningful capital movement rather than appearing as an isolated one-day event.
For traders, this is the part I find most interesting. If strong net inflows continue while trading activity expands, liquidity becomes an increasingly important part of the Gate ecosystem. More available capital can support deeper market participation and provide traders with greater flexibility when volatility creates opportunities. But if inflows rise while prices weaken sharply, the interpretation becomes more complicated because those funds could be positioned for selling or defensive strategies.
The recent data also shows how quickly rankings can change. Another September 3 snapshot from DeFiLlama placed Gate's seven-day net inflow at $78.19 million and ranked it first among global centralized exchanges, highlighting that exchange-flow figures can move rapidly as deposits and withdrawals change. The key takeaway is therefore not to treat one snapshot as permanent, but to watch whether positive capital-flow momentum continues over multiple periods.
For Gate, the $273.72 million seven-day net inflow is still a notable milestone. It puts the exchange firmly on the global capital-flow radar and gives the community another metric to watch beyond simple trading volume. If the next weekly readings remain positive and are accompanied by stronger activity, that would make the trend considerably more meaningful.
Capital follows opportunity, but the smartest signal is not simply seeing money arrive. The real signal is seeing whether that capital stays, participates and contributes to sustained market activity.
@Gate_Square
repost-content-media
BTC-1.23%
  • 5
$GFS /USDT Perp – "Flatline Chop – Watch"**
**Trading Plan Long $GFS
Entry: 45.18
SL: 45.05
TP1: 45.27
TP2: 45.40
GFS is flatlined on the EMAs with no volume. Enter only if it breaks above the 45.27 high, with a tight stop below the current 45.18 breakout level.
post-image
GFS+0.40%
  • 3
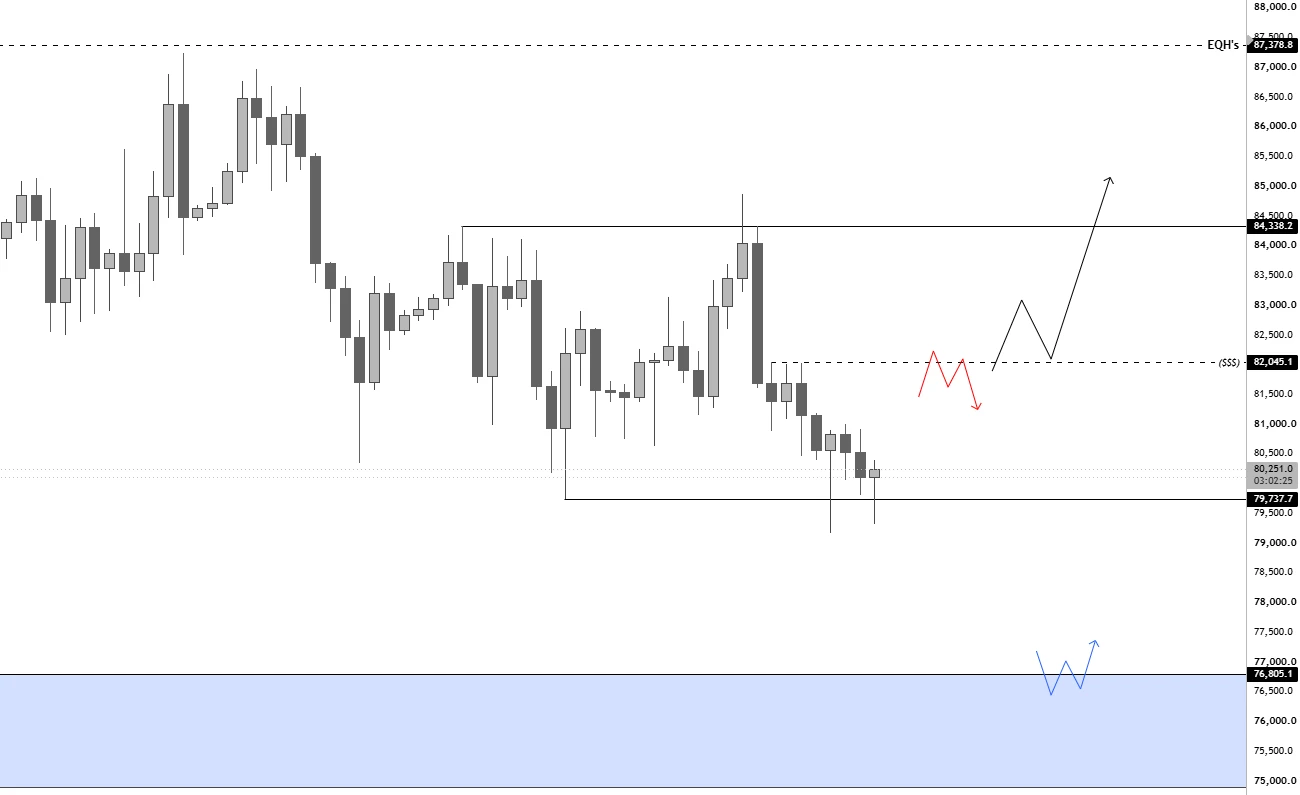
🚨 BTC Reclaims $80K — Is the Next Move a Bigger Breakout?
Bitcoin is back in the spotlight as #BTCReclaims80K becomes one of the biggest trending topics in the crypto market. 🔥
After a strong recovery from the recent weakness, Bitcoin pushed back above the $80,000 psychological level, showing that buyers are still willing to defend major support zones. Recent market data shows BTC briefly moved above $81K, while the broader market remains highly sensitive to macroeconomic developments and U.S. employment data.
📊 Why $80K Matters
The $80,000 area is more than just a round number. It can act
post-image
BTC-1.23%
  • 4
Everyone’s staring at BNB’s 724—but the 4H tape is quietly screaming something else.

$BNB /USDT - SHORT

Trade Plan:
Entry: 722.73 – 724.77
SL: 733.58
TP1: 716.38
TP2: 711.46
TP3: 704.09

Why this setup?
Why now? The 1D range is your cage, not your catalyst.
- RSI 15m at 55.58 is dead neutral—no fuel for a breakout, all fuel for a fade.
- ATR 1H at 4.09 means volatility is contracting; tight ranges precede violent snaps.
- Short bias (Conf: 55) targets TP1 716.38, then TP2 711.46—that’s a 1.7% drop from entry, but with SL at 733.58, your risk is defined.
- The “Waiting” status is t
BNB+3.42%
Weekly Macro Highlights: Nonfarm payrolls reignite expectations for Fed rate hikes, yen trading logi
live-cover
LIVE1,066
Gate is being popular world wide. $TSLA
post-image
TSLA-5.96%
JUST IN: OpenAI calls for expanding disclosure of alignment misalignment incidents as model capabilities evolve, aiming for a clearer framework and regulatory collaboration. No crypto direct relevance; format kept minimal.
post-image
Load More

Join 40 M users in our growing community

⚡️ Join 40 M users in the crypto craze discussion

💬 Engage with your favorite top creators

👍 See what interests you

View More