Share your thoughts
placeholder
Article
Profits are worth showing off, but losses are even more worth reviewing! The Gate event contract challenge is here
I used to love posting profit screenshots from my trades—sharing them on social media when I made money, and wishing I could just turn off my phone when I lost.
But what I find interesting about Gate’s event contract screenshot-sharing challenge this time is that it not only asks everyone to share the results, but also encourages them to share their trade direction, basis for their judgment, and review process.
That is actually closer to real trading.
For example, if I predict tha
BTC+0.08%
  • 14
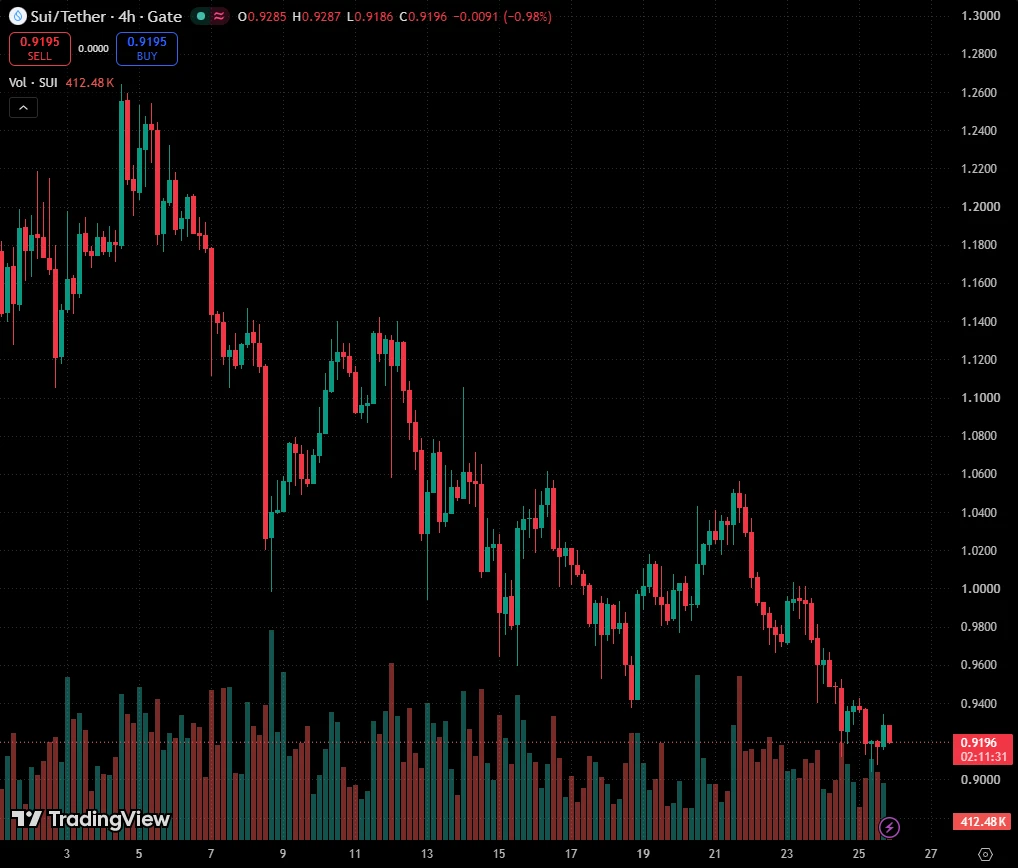
I was just about to go to the forum and start cursing, but then I looked at my balance and thought, never mind—the market is always right. I placed the order before bed a few days ago and thought it would go to waste, but today $SUI gave the answer directly—entered at 0.7362, now at 0.8054, with an unrealized gain of +452.99%. Feels great, guys.
I didn’t use any fancy analysis this time; I just looked at whether the buying support was strong enough. Before the market had fully started moving, every pullback held the level, which meant someone was buying underneath. Since someone was buying, I
post-image
SUI+5.68%
BTC+0.08%
ADA+3.89%
Rewards are being distributed! Open your mystery box now and win up to 100 USDT worth of tokens! https://www.gate.com/referral/earn-together/invite/UFRFAQ0M?ref=UFRFAQ0M&ref_type=103&utm_cmp=rXJBDjtJ&activity_id=1788357807948
post-image
Bull-Bear Divide Deepens Around $82K! B.TOP Founder Sells All His BTC
live-cover
LIVE74
Everyone’s staring at $MU /USDT’s 1017—but the 4h tape is screaming something else entirely.

$MU /USDT - SHORT

Trade Plan:
Entry: 1016.16 – 1017.94
SL: 1025.64
TP1: 1010.61
TP2: 1006.32
TP3: 999.87

Why this setup?
- 1D is *range*, not trend—so this isn’t a breakout play; it’s a mean-reversion snipe.
- RSI on 15m sits at 57.31—weak momentum, not exhaustion—meaning longs lack fuel to clear 1025.
- ATR 1h = 3.58 → tight stops, but TP1 at 1010.61 is only 6.4 points away—quick grab if 1017.05 holds as rejection.
- Why now? Price is parked at entry_ref with a 55.4 SHORT edge—waiting for
MU+0.33%
FORCED LIQUIDATION
$NIKE
post-image
NKE-0.24%
  • 3
$MARSCOIN had to manually close my short position as current structure going back to bullish. Won't open any new ones for now as direction is unclear yet.
Gonna look for a new high to open long or break below 0.20 for short.
#MARSCOIN
post-image
MARSCOIN+21.45%
Crypto Signals and Trding Insights
live-cover
LIVE62
Everyone’s staring at NEAR’s breakout, but the 15m RSI says you’re already late to the quiet part.

$NEAR /USDT - LONG

Trade Plan:
Entry: 2.1736 – 2.1968
SL: 2.0737
TP1: 2.2688
TP2: 2.3246
TP3: 2.4082

Why this setup?
- 4h structure is screaming LONG at 95% confidence, anchored at 2.1852 while the daily trend stays bullish.
- The pullback zone (2.1736–2.1968) is where wallets get filled—not after TP1 prints.
- RSI 15m at 45.64 means room to run before overbought, and ATR 0.0465 gives you a tight 4.5% stop buffer to 2.0737.
- Why now? Because waiting for TP3 (2.4082) is a luxury only
NEAR+2.49%
I just switched the app to the background, and it shot right back up—are you playing hide-and-seek with me?

When I checked the chart after lunch, it was still grinding along the bottom, but the K-line had already printed several long lower wicks in a row. When I opened it again in the afternoon, I happened to catch the high-volume breakout. This kind of upward move clearly isn't something retail traders can lift, so I went with the trend and opened a long at 13.489, starting with a small position to test the waters.

Now at 17.821, $SNXX the rally has been very clean, and the return on my p
post-image
SNXX+3.93%
SNDK+2.04%
LAB-0.12%
Everyone’s staring at the 1D range—but the 4h is quietly setting a trap on $BNB /USDT.

$BNB /USDT - SHORT

Trade Plan:
Entry: 767.9 – 771.3
SL: 790.3
TP1: 754.1
TP2: 743.7
TP3: 728.2

Why this setup?
- Price pinned at 769.6 with RSI(15m) at 46.96—no momentum to break upward.
- ATR(1h) at 6.63 means volatility is compressing; shorts love this setup before expansion.
- Targets are stacked: TP1 754.1, TP2 743.7, TP3 728.2—room to run if 767.9 fails.
- Why now? The 1D range gives false comfort, but the 4h signal (Conf 77) says the next leg is down.

Debate:
If BNB loses 767.9, are you r
BNB+6.16%
I originally just wanted to freeload a breakfast, but the market ended up wrapping me in dumplings for half a year.
During the repeated intraday oscillations, the bottom never broke down. Someone stepped in to buy every pullback, while capital quietly entered the market. I judged that the bottoming process was nearly over, so I directly opened a long near 833.19.
The price has now climbed to 1018.4, $ZEC this move really delivered the answer, with the return on the position reaching +1578.39%. Those who stayed on board should be grinning in their sleep. It was truly sluggish at first, but the
post-image
ZEC-1.17%
ADA+3.89%
ETH+1.02%
$BTC Signal】Long + 1H squeeze buildup
$BTC Hourly volume shrank to 267 coins, the 1H Bollinger Bands have squeezed to an extreme, and the MACD histogram has turned positive. The 4H MACD bearish histogram has continued to contract, with dense orders around 79630 and clear signs of buying support.
🎯Direction: Long
⚡Entry/orders: 79630.12 - 79853.00
🛑Stop loss: 79054.47
🚀Target 1: 81050.79
🚀Target 2: 81649.69
🛡️Trade management:
- Execution strategy: After reaching Target 1, reduce the position by 50% and move the stop loss up to breakeven. If the price falls back to the entry level, exit a
post-image
BTC+0.08%
Everyone’s staring at Bitcoin, but ADA just flashed a quiet short signal that most will ignore until it’s too late.

$ADA /USDT - SHORT

Trade Plan:
Entry: 0.2196 – 0.2208
SL: 0.2258
TP1: 0.2160
TP2: 0.2131
TP3: 0.2089

Why this setup?
Why now? The 4h frame is rejecting 0.2202 with a 55% short bias, while the 1D stays range-bound—meaning no bullish escape. RSI on the 15m is cooling at 59, and ATR (0.00235) shows volatility is compressing for a squeeze. Targets are stacked: TP1 at 0.2160, TP2 at 0.2131, TP3 at 0.2089. Stop at 0.2258 is tight. This isn’t a gamble; it’s a measured fade against
post-image
ADA+3.89%
My long position made a round trip, and today I finally saw the protective level do its job. The drop a few days ago came sharply; to be honest, I was somewhat panicked because a lot of the unrealized profit had already been given back. But since I had placed a stop-loss order in advance, I didn’t have to watch the market all night trying to guess the key level. Once the price climbed back above 0.0116, I first took profit on 30% of the position, while moving the protective level higher with the trend for the remaining 70%. This wasn’t about predicting how much further the price could rise; I
post-image
LAB-0.12%
SNDK+2.04%
Most traders will ignore this 95% confidence SHORT until it's too late.

$LAB /USDT - SHORT

Trade Plan:
Entry: 0.07452 – 0.07498
SL: 0.07695
TP1: 0.07310
TP2: 0.07200
TP3: 0.07036

Why this setup?
Why now? The 1D trend is bearish, and $LAB /USDT is stalling at 0.07475—just above the invalidation line at 0.07428. RSI on the 15m sits at 50.03, showing zero bullish momentum. The 4h setup targets 0.07310 first, then 0.07200. If we lose 0.07428, the thesis dies—but that's a 0.6% risk for a 3.7% move down to TP3.

Debate:
Is the dip to 0.07200 the real play, or do you think 0.07475 holds as fak
LAB-0.12%
I originally just wanted to mooch a breakfast, but the market ended up making dumplings out of me for half a year. I opened the charts this morning, and before my eyes were even fully open, I saw the price bubbling up on its own. A few days ago, while watching the market in the early hours, $TAC had been moving sideways at the bottom. Everyone was waiting and watching. I stared at the order book for a while and saw funds entering slowly but steadily, with small orders constantly providing support at the bottom. In situations like this, I don't hesitate—I reached in and bought some around 0.002
post-image
TAC-5.03%
ZEC-1.17%
LAB-0.12%
$ETH Signal】Long + 1H MACD histogram widening / 4H golden cross
$ETH The 1H MACD histogram widened to 3.81, with the price holding just below the upper Bollinger Band. The 4H golden cross continues, and the previous 4H bullish candle had a volume of 464,000. The 1H RSI is 65.24, and the funding rate is 0.0078%, so longs are not overheated. The order book depth ratio is 0.20, with sell orders placed deeper, creating slippage costs for short-term chasing. The risk-reward ratio is 1.5, the direction is clear, and execution should follow the specified levels.
🎯Direction: Long
⚡Entry/Limit order:
post-image
ETH+1.02%
BTC+0.08%
SOL+1.25%
Approaching a 2x on $STONKEX for GTG and X subs. Had a few losses as well - won't ever deny that. Trading is about learning how to lose.
Round tripped $CAP as well (updated my fomo thesis in live time - go read it there) because i was proving to myself to HODL lol still holding but derisked size. Perhaps low caps are an initials out at 2x kinda play no matter what happens.
Either way we stay consistent in this INSANE on chain season.
post-image
CAP-0.56%
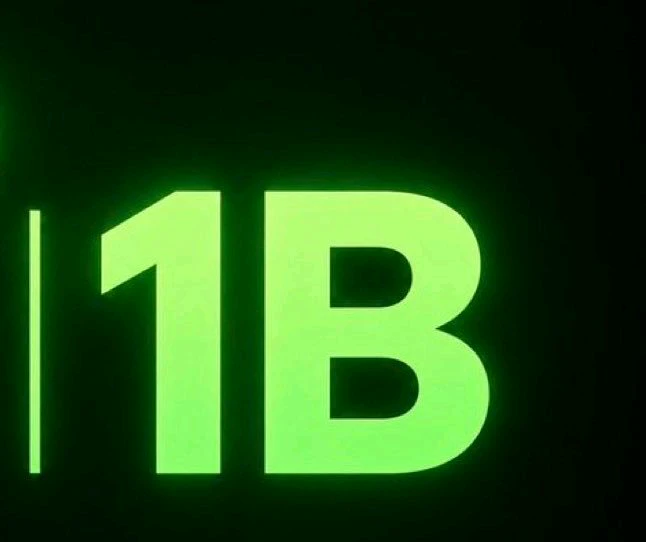
How much capital does it take to push a coin to $1 billion? Today’s top whale tells us that it only takes less than $9 million
And if a certain player wanted to cash out $1 million now, the market cap would instantly drop to $800 million,
For many top holders, one person’s holdings alone could crash the entire market to zero at the current coin price
Why do people say crypto is a casino? Because in the end, only a very small number of people are often able to walk away from the table with money
post-image
Load More

Join 40 M users in our growing community

⚡️ Join 40 M users in the crypto craze discussion

💬 Engage with your favorite top creators

👍 See what interests you

View More