



Share your thoughts
placeholder
Article
#Arc生态热门代币波动加剧 +#Gate广场中秋团圆局
🚀 ARC HAS ENTERED THE MARKET — NOW THE REAL TEST BEGINS
Circle Arc officially live on Sep 16, and the first 24 hours have already delivered exactly what we often see when a new blockchain ecosystem opens its doors: enormous attention, explosive trading activity, rapid price discovery, and equally aggressive corrections.
But Arc deserves to be viewed through a wider lens.
This is not simply another chain launching another group of speculative tokens. Arc has been designed specifically around financial infrastructure, with USDC as its native gas asset, EVM compatib
CryptoChampion
#Arc生态热门代币波动加剧 +#Gate广场中秋团圆局
🚀 ARC HAS ENTERED THE MARKET — NOW THE REAL TEST BEGINS
Circle Arc officially live on Sep 16, and the first 24 hours have already delivered exactly what we often see when a new blockchain ecosystem opens its doors: enormous attention, explosive trading activity, rapid price discovery, and equally aggressive corrections.
But Arc deserves to be viewed through a wider lens.
This is not simply another chain launching another group of speculative tokens. Arc has been designed specifically around financial infrastructure, with USDC as its native gas asset, EVM compatibility, targeted sub-second deterministic finality, and a focus on payments, trading, DeFi, FX and tokenized real-world assets.
Circle has also said that more than 100 applications and ecosystem builders were involved around the launch.
That gives Arc a much broader foundation than the first-day token charts might suggest.
🔥 THE FIRST WAVE HAS BEEN EXTREME
The early market has already produced some spectacular moves.
Based on the September 17 market figures being discussed, ARGUS fell more than 40% over 12 hours, LONG declined more than 70%, and COOL dropped more than 75%.
Those percentages are not just numbers on a chart.
A 40% loss requires approximately a 66.7% gain to recover.
A 70% loss requires approximately 233.3%.
A 75% loss requires a 300% recovery.
This is why extremely volatile launches require a different mindset.
The same liquidity that can push a token upward extremely quickly can also amplify selling pressure just as aggressively.
📊 MARKET CAP DOES NOT EQUAL LIQUIDITY
One of the most important things to understand about young ecosystems is the difference between valuation and actual liquidity.
Early Arc market data showed examples such as LONG around a $7.76 million market cap with roughly $324,000 liquidity, COOL around $6 million with approximately $360,000 liquidity, and TOLLY around $5.25 million with roughly $275,000 liquidity.
That means only a relatively small amount of liquidity may be available compared with the headline market capitalization.
So when significant buying or selling enters the market, price can move dramatically.
A token having a $7 million market cap does not mean there are $7 million of readily available bids waiting underneath the price.
That distinction becomes especially important during a new-chain launch.
⚡ ARGUS SHOWED HOW FAST ATTENTION CAN MOVE
ARGUS has already demonstrated how quickly attention can translate into large trading activity.
Its early rally pushed its market capitalization above $30 million according to initial market reports, while trading activity reached million-dollar-scale levels.
That kind of momentum can attract more traders, more liquidity and more attention.
But it can also create expectations that the next move must be another massive rally.
Markets do not work that way.
A token can rise 100%, 200% or even 500%, and still experience a sharp correction afterward.
The size of the previous move does not guarantee the size of the next one.
🔍 WHAT SHOULD WE WATCH NEXT?
For me, the next phase is less about finding the biggest green candle and more about studying the underlying market structure.
I would watch:
• Price movement
• 24-hour trading volume
• Liquidity
• Market capitalization
• Holder distribution
• Transaction activity
• Actual product usage
• Community activity
These metrics together can tell a much more complete story than price alone.
For example, a 30% correction with healthy liquidity and strong volume is very different from a 30% decline accompanied by disappearing liquidity and rapidly falling activity.
The quality of the move matters.
🌐 ARC IS BIGGER THAN MEME TOKENS
This may ultimately be the most interesting part of the entire launch.
The first wave of Arc assets is highly speculative, but Arc itself is targeting a much broader financial ecosystem.
USDC-native gas could make transaction costs easier to understand for financial applications because users do not necessarily need to maintain a separate volatile gas token.
Its focus on payments, DeFi, FX, trading and tokenized assets creates multiple potential sources of network activity.
Meme tokens can attract attention.
DeFi can attract capital.
RWA can connect blockchain infrastructure with traditional assets.
Payments can generate transaction demand.
FX can create settlement use cases.
And USDC can provide a stablecoin-based foundation across these activities.
That is a considerably larger thesis than simply asking which Arc token might pump next.
🏗️ ARC THE NETWORK ≠ EVERY ARC TOKEN
This distinction is extremely important.
Arc can develop into useful financial infrastructure even if some early tokens fail.
Likewise, an individual token can rise hundreds of percent without proving that its underlying project has sustainable long-term utility.
The first wave is about speculation and price discovery.
The next stage should be about survival.
Which projects maintain liquidity?
Which continue producing meaningful volume?
Which attract real users?
Which keep building after the initial excitement disappears?
Which communities remain active after major corrections?
Those questions will become increasingly important.
🛡️ GATE TRENCHES ADDS ANOTHER LAYER
Gate’s early support for Arc also puts the ecosystem directly into the trading conversation.
Gate Trenches provides zero-gas-fee trading for Arc assets, reducing one layer of transaction friction when exploring newly launched assets.
But there is an important distinction:
Zero gas does not mean zero risk.
Lower execution friction can make trading more convenient, but it cannot protect a trader from a 40%, 70% or 75% price decline.
Risk still comes from volatility, liquidity, valuation, market structure and execution.
🚀 THE REAL ARC TEST IS STILL AHEAD
The first 24 hours have shown that Arc can generate attention.
ARGUS demonstrated explosive price discovery.
LONG and COOL demonstrated how thin liquidity can amplify both upside and downside.
The sharp September 17 corrections demonstrated that early Arc trading is absolutely not a one-directional market.
But the bigger question is what happens next.
Can liquidity deepen?
Can developers continue building?
Can users arrive?
Can DeFi and RWA applications gain traction?
Can payment and financial applications create sustainable transaction demand?
That is the transition I will be watching.
The first phase asks:
“What can pump?”
The next phase asks:
“What can survive?”
And the mature phase asks:
“What can actually become useful?”
Arc has only just opened its doors.
The charts are already moving violently, the first tokens are experiencing extreme price discovery, and Gate is supporting the ecosystem from the beginning.
For me, the most important story is not simply which Arc token makes the biggest move.
It is discovering which projects can maintain liquidity, volume, users and real utility after the launch hype fades.
That is where the real Arc story begins. 🌐
#GateMeme狂欢季 #weeklyshare @Gate_Square #ShareWeekly
repost-content-media
  • 2
Treat it as work; set yourself a goal of 1,000 USDT a day💪#ETH #BTC #SOL
post-image
Crypto
What price will Bitcoin hit in 2026?
↓ 70,000
65%1.54x
↑ 85,000
59%1.69x
$231K 24H+44 more
ETH+2.09%
BTC+1.28%
SOL+3.59%
  • 1
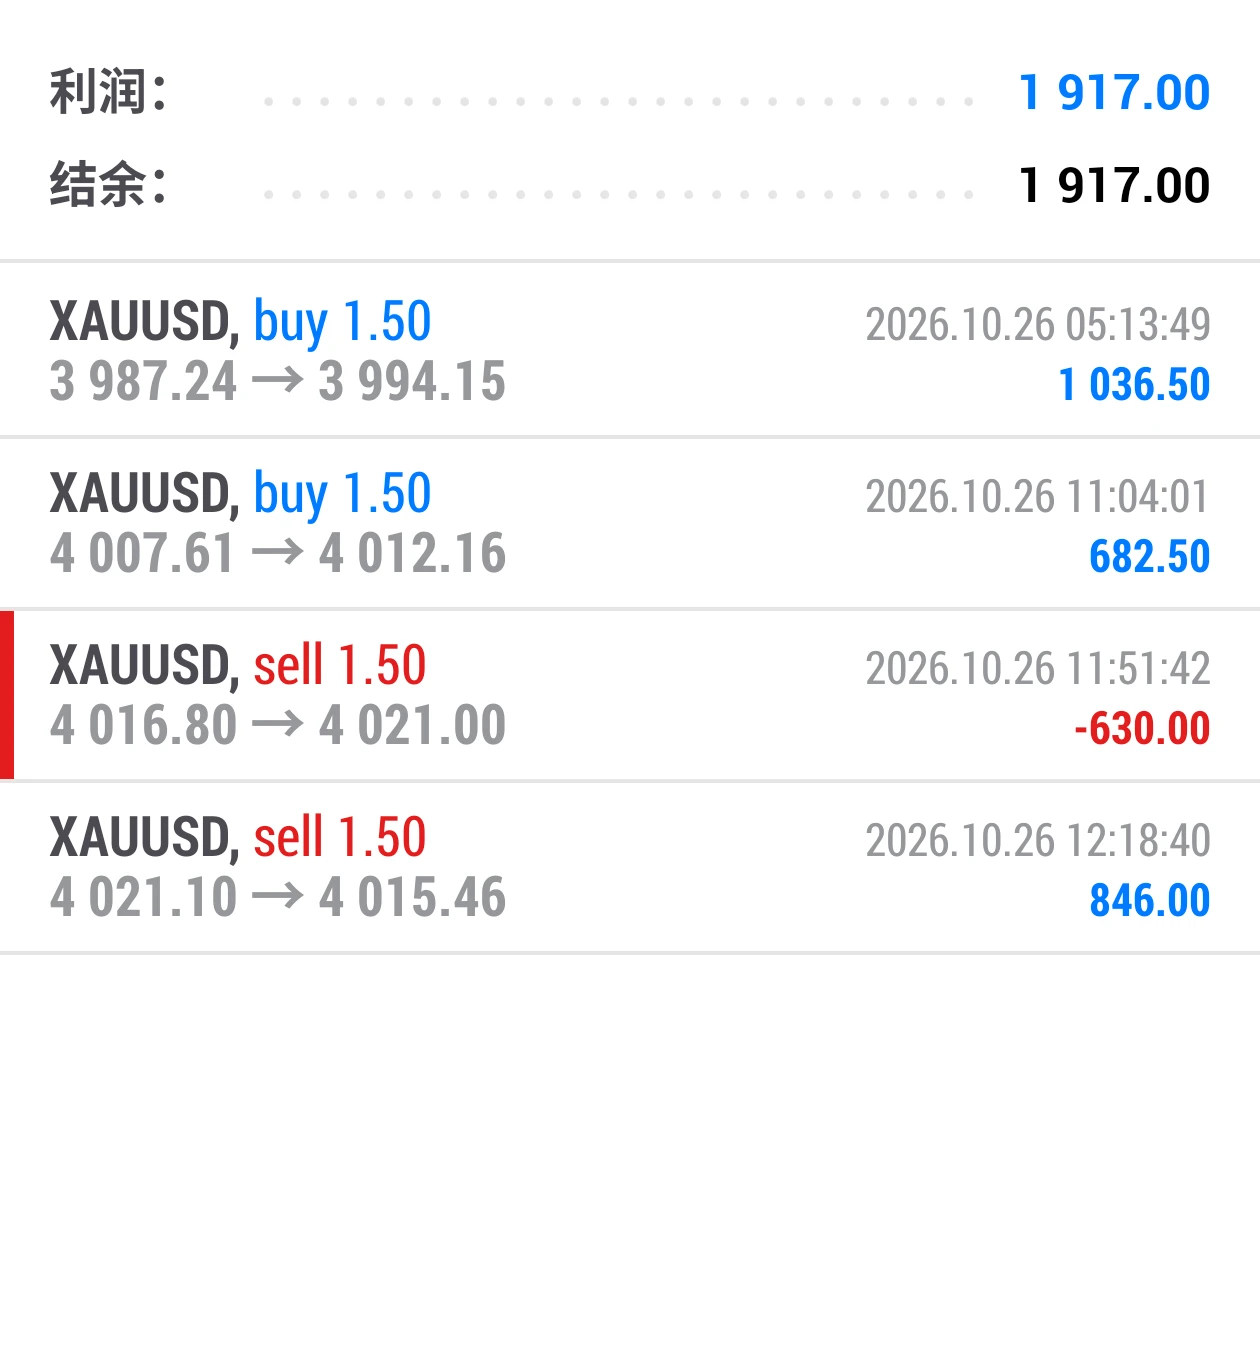
Pause the trade-copying for now
Trade CFDs for a while to reset my state
I’ve already made back three times what I lost on the four trades this morning
post-image
I didn’t chase the first rebound on $UAI , but instead waited to short near the previous high. After the price surged into the key-level zone, it failed to hold firmly with a solid body, while consecutive upper wicks and no increase in volume indicated insufficient buying pressure. The high-level resistance structure remains intact, making a false breakout more likely.

There are two technical reasons: first, the previous high and the high-volume trading zone near it formed a key level; second, the rebound occurred on declining volume, with the breakout lacking volume-price confirmation. The t
post-image
UAI+10.17%
ETH+2.15%
ZEC+17.39%
$AKE Isn't this trend obviously baiting people into going long? Don't fall for it.
I believe most people’s first reaction upon seeing this trend is that it has already plunged sharply and stabilized, and is now gathering strength for the next rally, so they immediately jump in to buy the dip and go long.
Thinking that way would play right into the market maker’s hands. This shitcoin has no support or resistance levels to analyze; it is purely controlled by the market maker. Technical analysis is useless—you have to play the market maker psychologically.
The current situation is either that it
AKE-23.63%
$ETH bounced, bounced.
ETH+2.09%
#FedHikes25bpsForFirstTimeIn3Years
The Federal Reserve has delivered a 25-basis-point rate hike, lifting the federal funds target range to 3.75%-4.00%. This is the first Fed rate increase since 2023, and the September 16 decision was unanimous at 12-0. The Fed said economic activity is expanding at a solid pace, domestic spending remains resilient, productivity growth is strong, capital investment is robust, and inflation is still above its 2% objective.
Why does a small 0.25% move matter so much to crypto? Because markets price the future, not just today's rate. A quarter-point increase rais
Everyone is buying SYMBOL but the 4h chart screams otherwise.

$TRUMP /USDT - SHORT

Trade Plan:
Entry: 1.944 – 1.958
SL: 2.023
TP1: 1.897
TP2: 1.861
TP3: 1.807

Why this setup?
Why now? The daily trend is bearish and the 1h price sits at 1.951 inside a tight 1.944 to 1.958 entry zone, giving sellers a clean setup. The 15m RSI at 60.69 still has room to roll over before confirming selling exhaustion. With the 1h ATR at 0.029993, a single push down can cover the distance to TP1 at 1.897 and TP2 at 1.861 without stalling. The line in the sand is the invalidation level at 2.037, where this ent
TRUMP+5.12%
$HYPE HYPE and ZEC, this leading coin pair is moving up together. HYPE is also about to enter the US market. The chart looks good, with a breakout imminent. Go long $HYPE now! Entry: $78 - $80Target price (TP): 82 - 84 - 87 - 90 - 93 - 96 - 100Stop loss (SL): 74
post-image
HYPE+3.57%
ZEC+17.35%
Today I got forehand-smashed again, then backhand-smashed #黄金
post-image
GLDX-0.13%
PAXG-0.41%
New Gate ETF listing: $ZEC
🔹 Trading pairs: #ZEC5L / $USDT, #ZEC5S / $USDT
🔹 Trading time: September 17, 2026, 15:00 (UTC+8)
🔹 Supports 5x leveraged long and short positions for more flexible trading
Trade:
https://www.gate.com/trade/ZEC5L_USDT
https://www.gate.com/trade/ZEC5S_USDT
More: https://www.gate.com/announcements/article/101794
GateLaunch
New Gate ETF listing: $ZEC
🔹 Trading pairs: #ZEC5L / $USDT, #ZEC5S / $USDT
🔹 Trading time: September 17, 2026, 15:00 (UTC+8)
🔹 Supports 5x leveraged long and short positions for more flexible trading
Trade:
https://www.gate.com/trade/ZEC5L_USDT
https://www.gate.com/trade/ZEC5S_USDT
More: https://www.gate.com/announcements/article/101794
repost-content-media
ZEC+17.35%
ZEC5L+8.06%
ZEC5S-11.15%
THE FED HIKES RATES FOR THE FIRST TIME IN THE THREE YEARS!.............
live-cover
LIVE2,046
You're almost there.
Never stop clicking.
post-image
  • 4
Today's Asian session followed a trend similar to yesterday's. The broader trend is indeed bearish, but the short-term rebound is also very strong. Gold rebounded to $4,318 in the early session before edging lower, but with insufficient momentum afterward, gold has now returned to around $4,310.
In the afternoon European session, first look for a rebound in line with the trend, focusing on the early-session high of $4,318 above. If the European session can break above $4,318 effectively, the upside target is the $4,340–$4,355 resistance zone. #黄金 #伦敦金 $XAUUSD
post-image
XAUUSD+1.22%
🔥 What are we talking about today? Gate Square’s hot topics have been updated!
🏦 The Fed’s first rate hike in three years, by 25 bps—where will the market go next?
⚡ Volatility is intensifying across the Arc / Solana ecosystem—opportunity or risk?
🚀 $ZEC leads PayFi, Solana Meme hype is heating up again—where will the next wave of capital flow?
Have an opinion? Come chat 👇
Bring the hot topics, discuss the market, share your views, and share your positions and trading plans.
💰 High-quality content can receive traffic support + up to 60% in content mining rewards
👉 https://www.gate.com/p
GateSquare
🔥 What are we talking about today? Gate Square’s hot topics have been updated!
🏦 The Fed’s first rate hike in three years, by 25 bps—where will the market go next?
⚡ Volatility is intensifying across the Arc / Solana ecosystem—opportunity or risk?
🚀 $ZEC leads PayFi, Solana Meme hype is heating up again—where will the next wave of capital flow?
Have an opinion? Come chat 👇
Bring the hot topics, discuss the market, share your views, and share your positions and trading plans.
💰 High-quality content can receive traffic support + up to 60% in content mining rewards
👉 https://www.gate.com/post/topic
repost-content-media
ARC-1.16%
SOL+3.59%
ZEC+17.35%
MEME+3.45%
$SOL : Breakout Before Entry
$SOL is still trading beneath a key descending trendline, keeping the bullish setup unconfirmed.
The level I’m watching is simple:
▸ Break above the trendline
▸ Hold it as support
▸ Then look for continuation higher
Until that happens, patience matters more than chasing the move.
A clean reclaim could open the door for the next leg up. 👀
#FedHikes25bpsForFirstTimeIn3Years #GateTrenchesExclusive0GasTrading #ShareWeekly
post-image
SOL+3.59%
  • 6
$HYPE HYPEUSDT 4H / DIAMOND
HYPEUSDT 4H
Will HYPE enter another bullish phase and make new highs?
It looks like it has broken out of that sideways range and the situation is looking better.
If the red zone gets engulfed and price consolidates above it, it could continue its bullish move and reach new price levels.
Reversal patterns are also starting to appear right now.
Keep an eye on it.
post-image
HYPE+3.76%
Layout for Bitcoin, Ethereum, and Dogecoin
live-cover
LIVE1,598
CLARITY is stuck at 60 votes, while the tax bill has broken out of the Ways and Means Committee by a 38–5 vote.
The House Ways and Means Committee passed the Digital Asset Tax Clarity Act and sent it to the full House. The small-payment/fee exemption threshold is around $10, and it also covers income recognition, wash sales, mining and staking, and broker reporting.
Simply put: the market structure bill is stalled, while tax clarity has taken the lead with a wide bipartisan vote.
My view: Don’t treat “tax clarity” as a broad regulatory bullish signal; the $10 threshold is useful for everyday p
post-image
BTC+1.28%
ETH+2.09%
COIN-4.42%
Load More

Join 40 M users in our growing community

⚡️ Join 40 M users in the crypto craze discussion

💬 Engage with your favorite top creators

👍 See what interests you

Trending Topics

GateTopsStockPerpetualCoverage

35.39k Views1.59k Discussing

According to the latest DefiLlama report, Gate has listed 385 stock-related perpetual contracts, ranking first in coverage; average daily volume is about $1.15B and average open interest about $738M, both ranking third in the industry; liquidity depth for its five highest-volume contracts — SNDK, SKHYNIX, SPCX, SOXL, and MU — ranks first across the board. How do you view Gate leading in both coverage breadth and liquidity depth? [👉 Full Report](ttps://defillama.com/research/spotlight/deep-enough-trade-gate-case-tokens-stocks)

FedHikes25bpsForFirstTimeIn3Years

30.54k Views6.95k Discussing

GateTrenchesExclusive0GasTrading

45.96k Views677 Discussing

View More