Square
Following
Hot
News
Profile
Share your thoughts
placeholder
Article
I’m checking out every decent shill today.
Shill me some good #tickers 👀
post-image
$SKHY
The memory market is straight out of the hog cycle: prices rise, capacity expands; capacity expands, the market crashes; the market crashes, production is cut; production is cut, prices surge again. The entire industry is now pushing hard to ramp up production. If AI demand can’t outrun capacity, beware of the accelerated version of “storage means death” turning into “storage means king.” Those holding positions should wait for the November earnings reports, sell into the rebound, and keep something in reserve. Spend less time scrolling short videos—the sentiment is even more volatile th
post-image
SKHY-0.94%
$US Bought spot at a low yesterday, went long and bought the dip, winning across the board. As long as you hold, just wait for the pump to sell
US-8.60%
I can't be the only one 😭
post-image
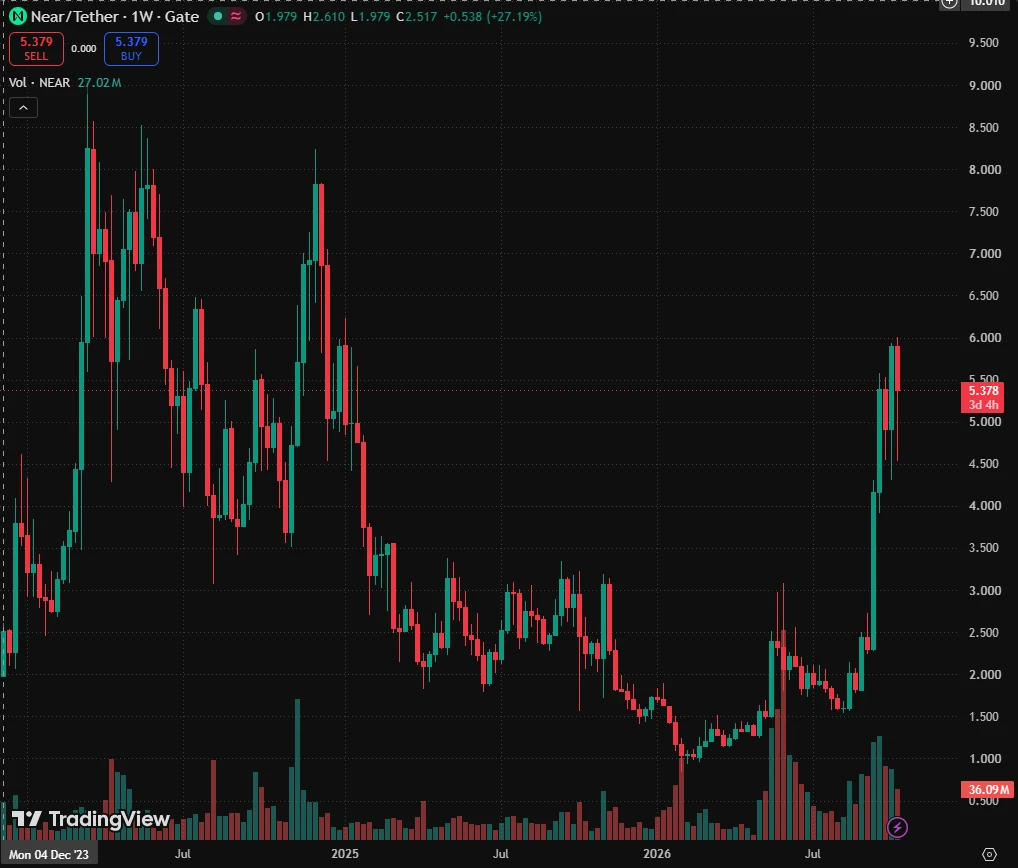
$NEAR NEAR Breaks Out of a 4-Year Descending Channel: TP1: $11
NEARUSDT
Weekly Time Frame:
NEAR (1W, log scale) is breaking out of the descending channel that has defined price action since the 2022 top, and the weekly candle is now pushing above the upper boundary.
What the chart shows:
After the 2022 high (~20.6), price spent years in a descending channel, bottoming around the 0.9 area in early 2026.
Since that low, price has risen sharply and is now trading at ~5.4, above the channel’s upper trendline.
The breakout is happening at the 2024 volume profile POC (~5.2), so the trendline and a h
post-image
NEAR+10.25%
$ETH Long Catches a Fresh Flush Partial Bounce, No Momentum Confirmation
Pair: $ETH /USDT
Direction: LONG
Entry Zone: 2364.29
Take Profit:
- TP1: 2423.13 +2.5%
- TP2: 2462.36 +4.1%
- TP3: 2521.20 +6.6%
Stop Loss: 2285.83
Chart Structure:
- ETH declined steadily from ~2480 through MA7, MA25, and MA99, then printed a sharp flush candle down to ~2285-2300 before bouncing to current price
- Price remains well below all three moving averages this is a bounce attempt within an intact downtrend, not a reclaim
- RSI(14) dropped to ~25 at the flush low and has only partially recovered to the high-
ETH+1.52%
  • 2
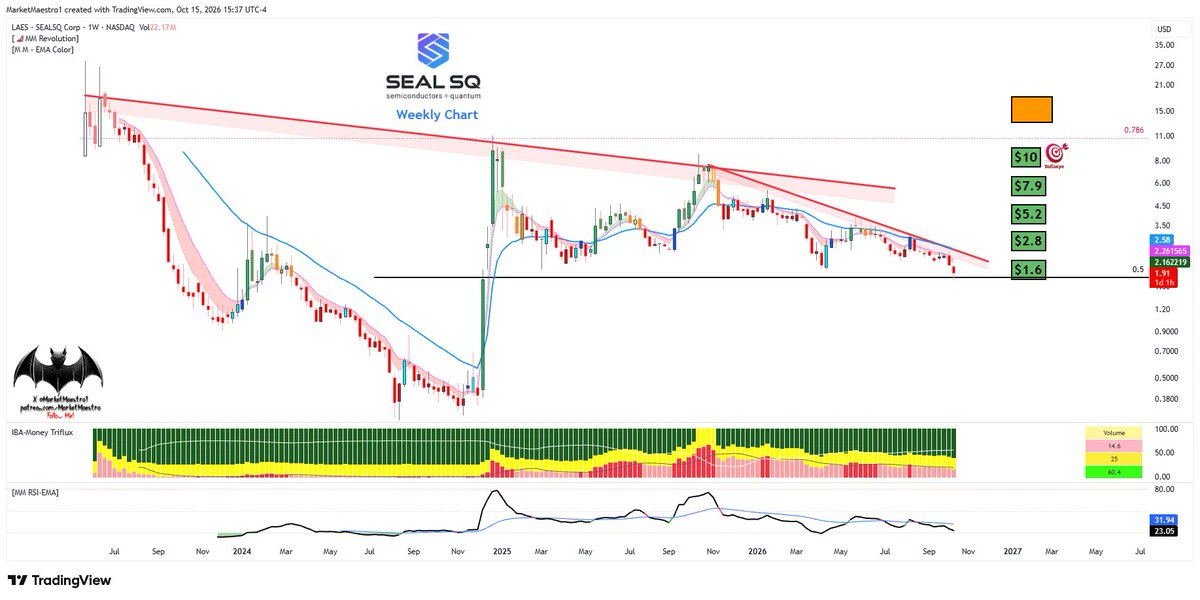
$LAES
A microcap stock in the quantum business. It held the Fibonacci support
post-image
LAES+3.21%
$BTC Don’t get baited into heavily chasing longs in this rally! The one-hour chart looks like a strong rebound, but it is actually just a corrective bounce after the sharp drop, not a trend reversal. Overhead trapped positions are weighing on the market, so any surge could pull back at any time.
ETH rebounded and rallied after hitting a low of 2314.27 one hour ago. The MA5 and MA10 turned upward, and the MACD formed a golden cross, indicating a corrective rebound after the sharp drop rather than a trend reversal. Overhead resistance from previous trapped positions remains.
Enter ETH long posit
BTC+0.31%
BTC UPDATE
live-cover
LIVE84
🚨 JUST IN: MSCI is reportedly set to REMOVE Michael Saylor’s Strategy $MSTR from its indexes. 👀
The move could impact institutional funds that track MSCI benchmarks.
MSCI+2.49%
MSTR+5.58%
SANDISK $SNDK REJECTING MOVING AVERAGE RESISTANCE ARE BEARS TARGETING $1,272.23 NEXT?
Trade Parameters

Pair: $SNDK /USDT
Direction: SHORT
Entry Price: 1,347.86
Target Levels (Take Profit)
🎯 TP 1: 1,302.48 3.37%
🎯 TP 2: 1,272.23 5.61%
Stop Loss
SL: 1,408.36
Technical Breakdown
SNDK ($1,348.19) faced strong rejection following an aggressive upward push, printing a topping wick that stalled out right at structural resistance. This price action confirms persistent seller defense and sets up a clean continuation toward lower targets.
Price action tested areas above short-term moving ave
SNDK-1.34%
While XRP has seen significant developments on the institutional front, its price has followed a more cautious trend. Despite approximately $1.8 billion in net inflows into XRP exchange-traded products (ETPs) over the past 13 weeks, the token’s price currently sits at $1.39—a decline of over 8% in the last week alone. This divergence raises a fundamental question that is now at the forefront of investors' minds.
The developments on the institutional side are noteworthy. Evernode—a company holding 473 million XRP and $300 million in cash—has begun trading on the Nasdaq under the ticker symbol X
post-image
XRP+0.94%
  • 8
  • 1
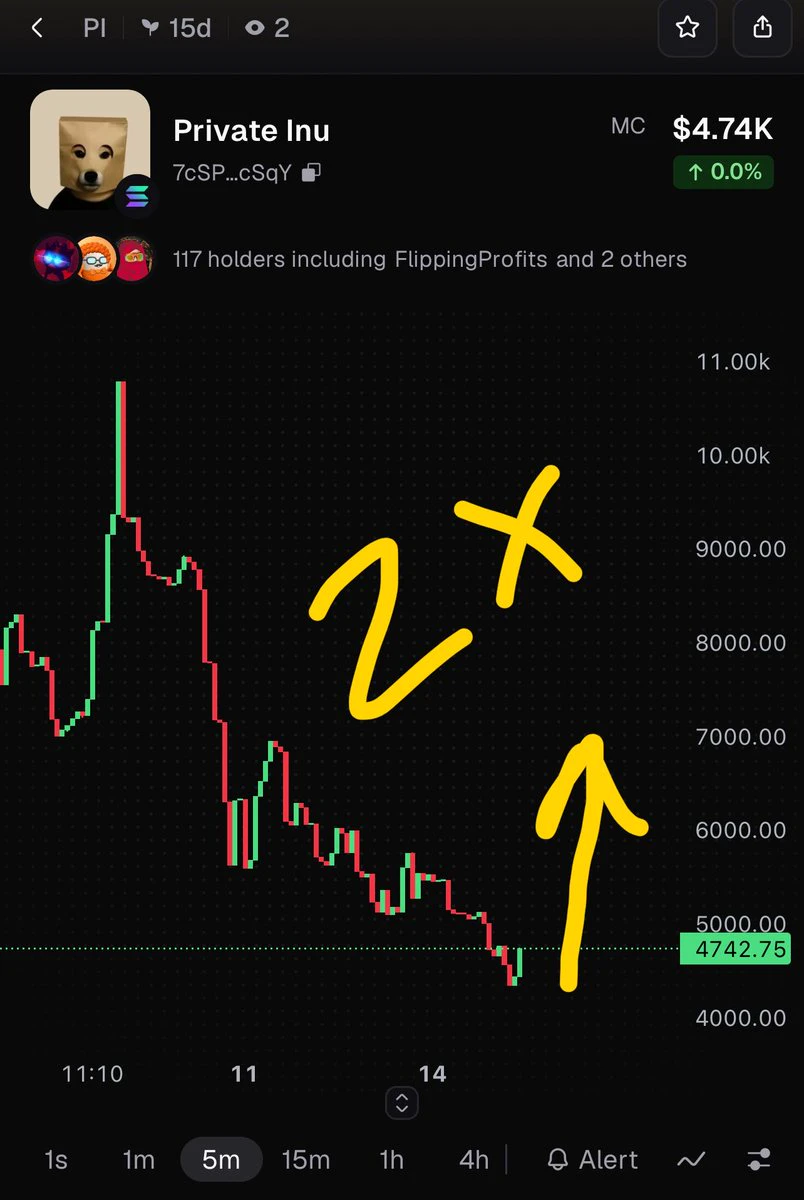
solana:7cSPCV6Sadhcuk8zBa7o7mu2ny4ccmXB8XU6HcqPcSqY Privacy Inu this one is a no brainer at $4,700 mc could bounce 2-3x with minimum 40% pump
7cSPCV6Sadhcuk8zBa7o7mu2ny4ccmXB8XU6HcqPcSqY
#crypto
post-image
SOL+1.42%
10.16 $BNB Strategy chart 1 is the BNB 4-hour candlestick chart, and chart 2 is the BNB hourly candlestick chart.
From the larger timeframe in chart 1, we can see that BNB has touched the lower major ascending trendline today, namely the positions at 10 a.m. and 10 p.m. on October 15, corresponding to 708 and 712, respectively. Given the very obvious signs of price control in BNB recently, when BTC falls and ETH falls, BNB can always recover its price after falling.
If the broader market continues to make new lows in the near term, BNB is very likely to break below this 4-hour ascending trend
BNB+0.32%
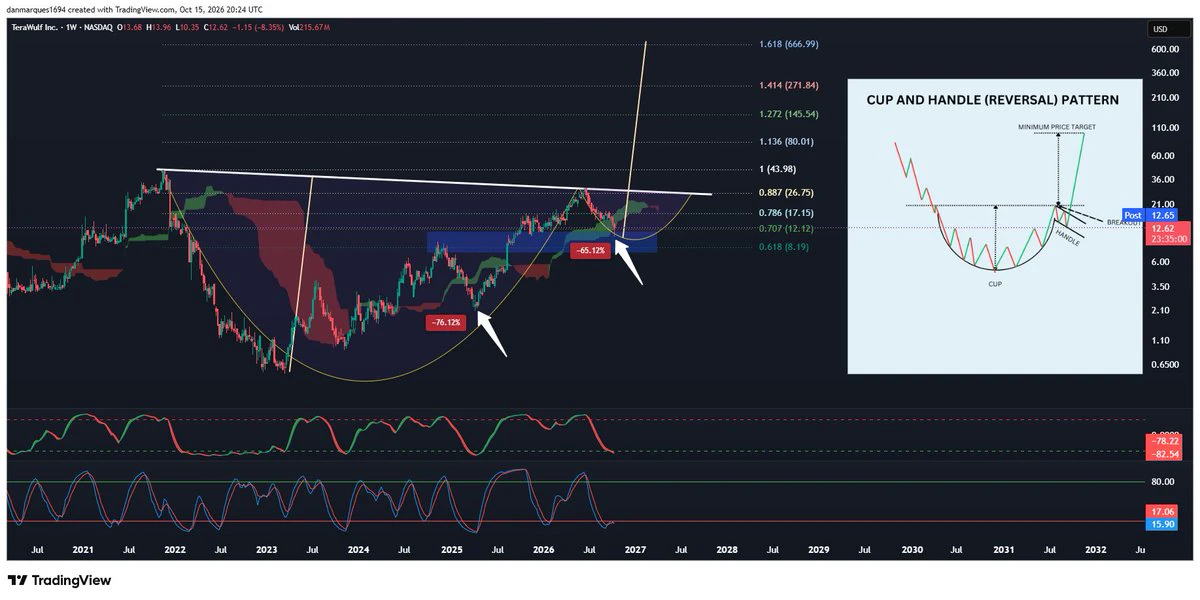
$WULF had an intraday recovery of +20% which is pretty significant. It was down -65% from its high of $29 at some point today which still isn't as bad as the pullback in April 2025 where it saw -75% drawdown, but I'd say the sentiment in the space was just as bad
It almost seems irresponsible to show this chart. But it's currently forming a handle in this cup & handle pattern.
I don't make the fibs either, price currently found support around the 0.707 fib and if we get back above 0.786 and 0.887 fib then the upside targets could get wild. I don't see them happening anytime soon. For no I'd e
post-image
WULF+9.27%

ZEC moved lower intraday from around 1116, falling all the way to a low of 1074.66 before staging an oversold rebound, surging to 1246.91. The larger-cycle downtrend structure remains intact, so a rebound into the resistance zone presents an opportunity to short.
From the chart perspective, the long-term downtrend structure on the daily timeframe remains intact. This recovery is merely a correction during the decline, while the dense overhead trapped positions will create strong resistance.
On the 4-hour timeframe, consecutive large bullish candles have driven prices sharply higher in a short
post-image
ZEC+8.93%
$BTW BTW, this rebound is like an old lady climbing stairs, panting every three steps😅 The downtrend is visible to the naked eye; don’t get carried away shorting, and keep leverage low to stay alive. It’s darkest before dawn—don’t throw your back out on a rebound; staying cautious makes you the winner🤙
post-image
BTW-16.07%
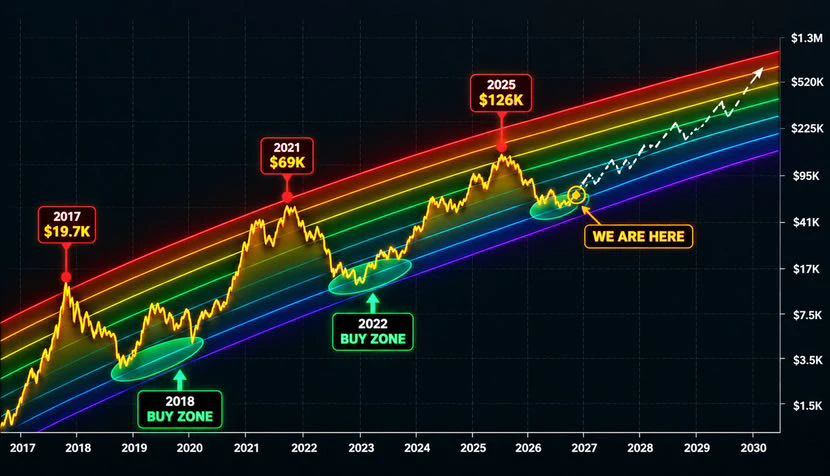
Bitcoin’s Long Term Cycle Chart Points to a Bigger Question: Are We in Another Accumulation Zone? 🙄
Bitcoin’s historical price cycles show a recurring pattern: major rallies, deep corrections, and long recovery periods.
The chart highlights previous peaks near $19,700 in 2017, $69,000 in 2021, and $126,000 in 2025, alongside earlier areas that some traders viewed as accumulation zones.
Now, the key question is whether the current price structure represents another opportunity to accumulate or whether the cycle is changing.
I think that the Historical patterns can offer useful context, but the
post-image
BTC+0.31%
Some dinners aren’t about eating
but about having food to eat in the future #WorkplaceDinners
post-image
Load More

Join 40 M users in our growing community

⚡️ Join 40 M users in the crypto craze discussion

💬 Engage with your favorite top creators

👍 See what interests you

Trending Topics

USSeptemberPPIBeatsExpectations

91.35k Views1.88k Discussing

US September PPI came in at 6.3% YoY, well above the 5.3% market expectation, pointing to renewed producer-side inflation pressure. Weekly jobless claims were 199K, broadly in line with forecasts. Could hotter inflation further reduce room for rate cuts, and what does it mean for $BTC, US stocks, and gold?

DrLinHanSpeaksAtOxfordUnion

135.63k Views1.86k Discussing

JapanAndKoreaStocksPlunge

47.27k Views1.76k Discussing

View More