Square
Following
Hot
News
Notifications
Profile
Share your thoughts
placeholder
Article
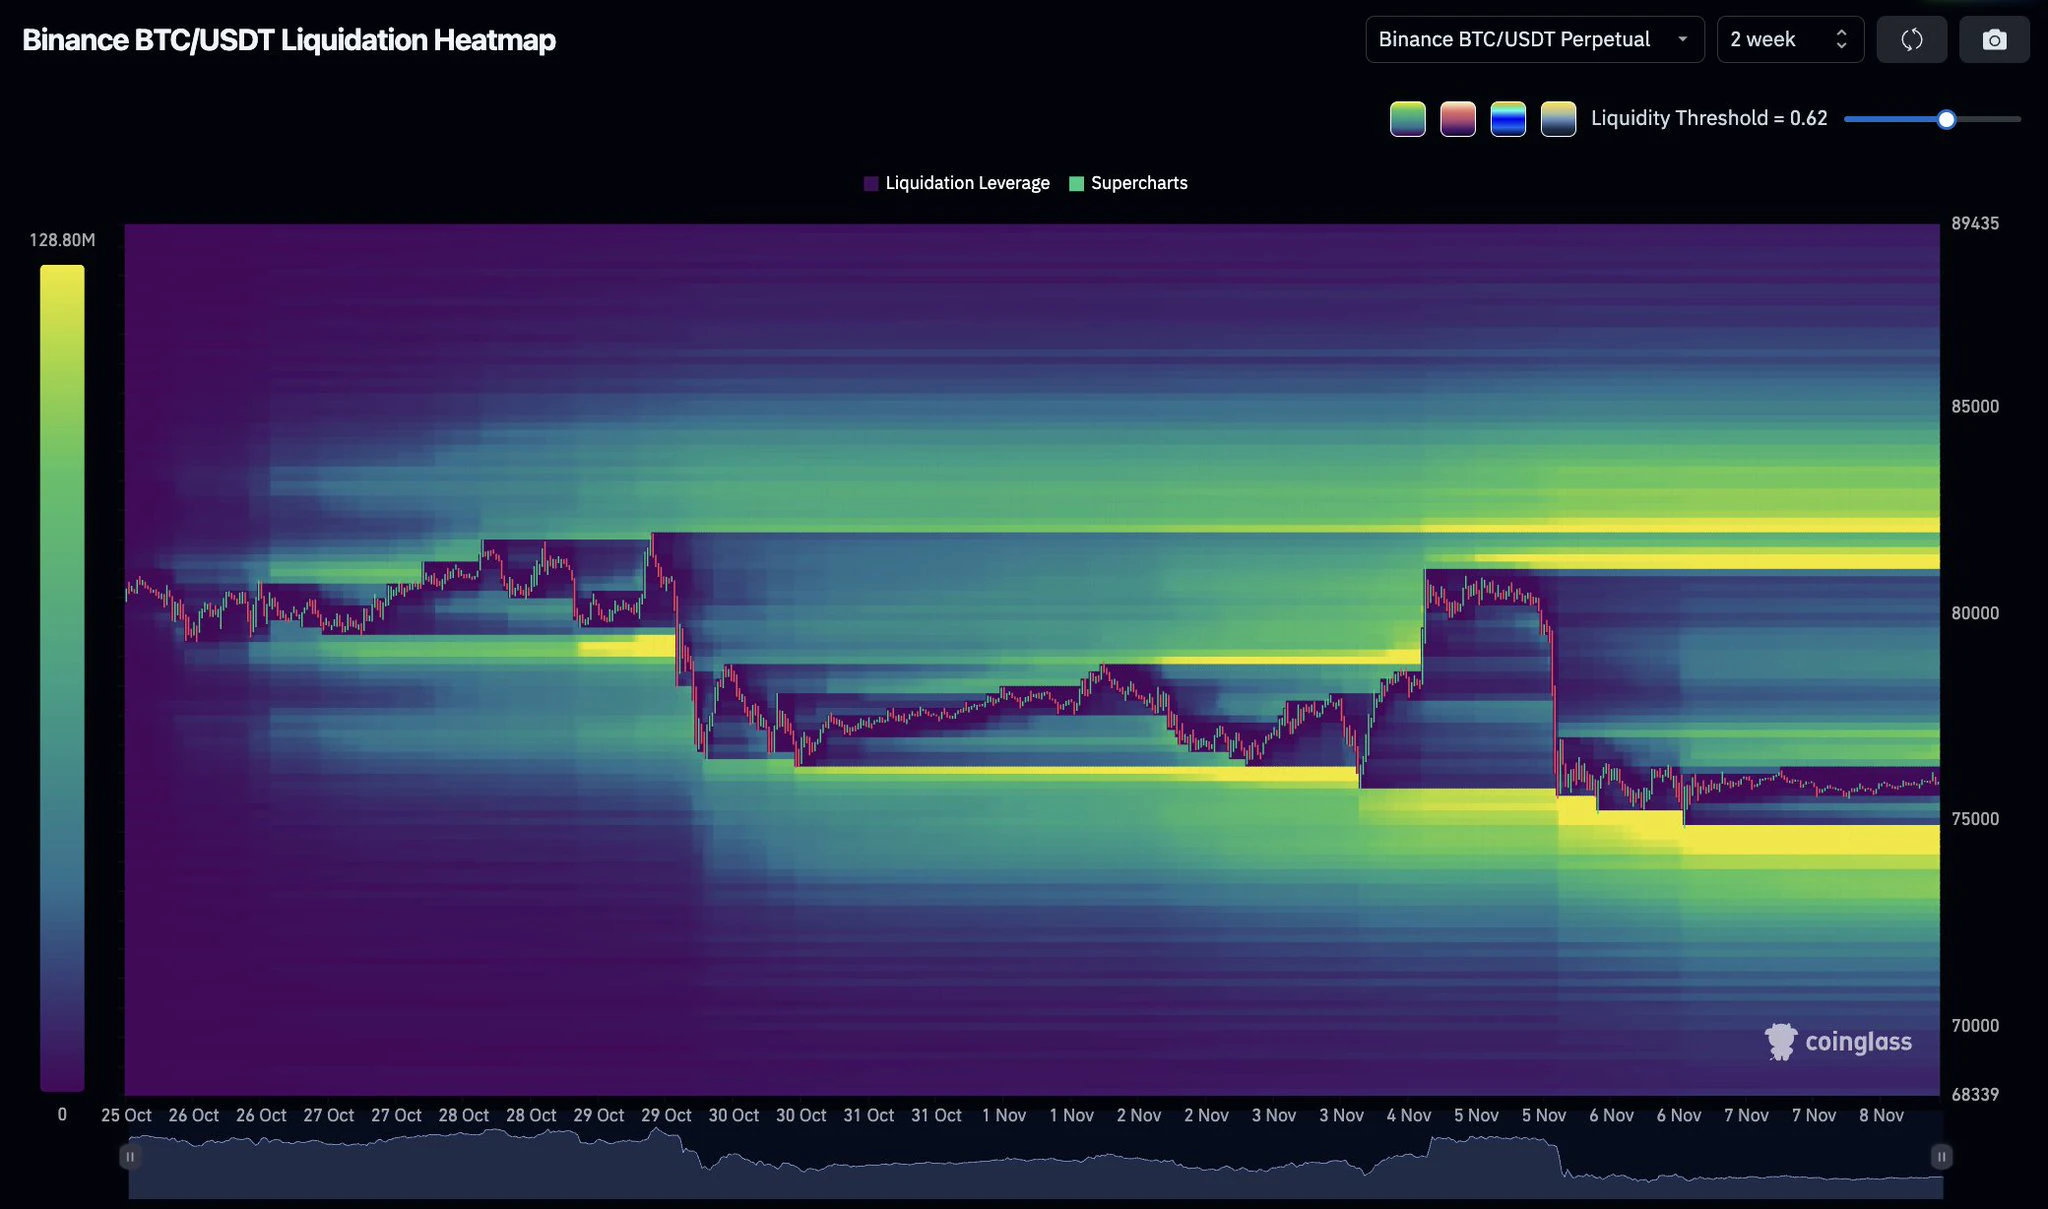
$BTC is near $76,000 with major liquidation clusters on BOTH sides.

Longs around $74,000 to $75,000.
Shorts around $81,000 to $82,000.

Which side gets swept first? 👇

#USCPIDataIncoming
#USAIStocksHitHard
post-image
BTC-0.65%
Strong line-up ready for tomorrow
post-image
Trenches
ZIG
Z
bade
b
ZIG
0x8c...1145
Market Cap
$.
Change
.
24h Vol
$.
Holders
.
STONK
S
bade
b
STONK
6GmA...UNgx
Market Cap
$.
Change
.
24h Vol
$.
Holders
.
CLAUDIA
C
bade
b
CLAUDIA
2j5S...W2ZM
Market Cap
$.
Change
.
24h Vol
$.
Holders
.
BTC
B
bade
b
BTC
C5xp...pump
Market Cap
$.
Change
.
24h Vol
$.
Holders
.
FLOAT
F
bade
b
FLOAT
Bv1a...BMmr
Market Cap
$.
Change
.
24h Vol
$.
Holders
.
#晒出我的持仓收益 Temporarily opened, live now: Ether (ETH)
post-image
ETH-1.26%
btc eth and altcoins
live-cover
LIVE2,005
$ETH Weekly still working on that right shoulder, as well. Going to have to be open-minded to more downside possibly, but we still have the track line underneath us at ~$2,085. And I know it doesn't look like it, but the Daily has a wonky H&S still playing out. Just waiting for that downtrend to end.
ETH-1.26%
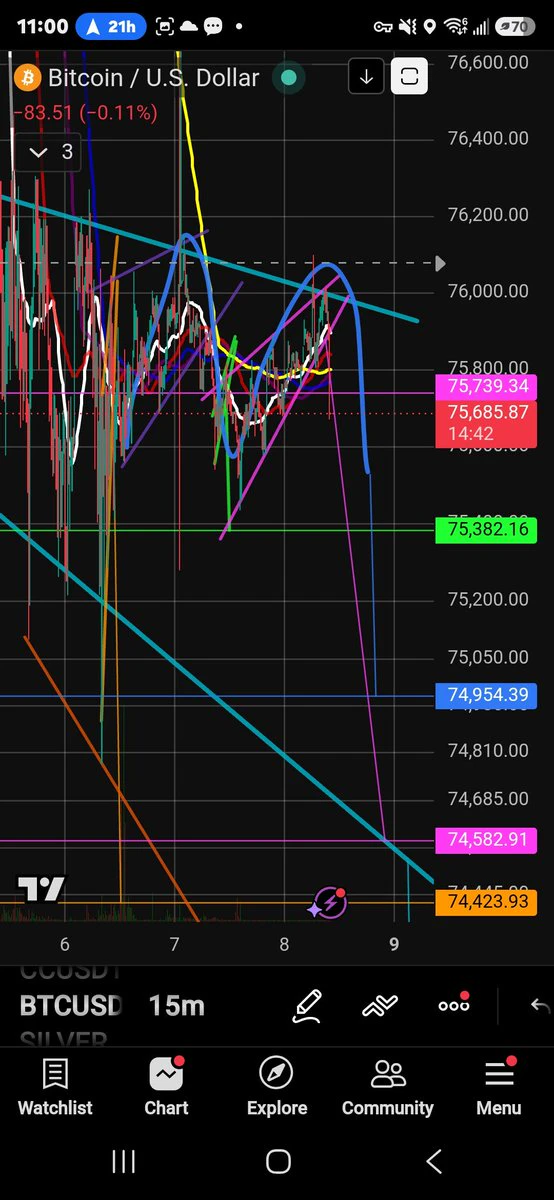
$BTC Breaking Downwards Fron The Pink Rising Wedge As Projected
Yes the chart is definitely messy. I understand. 💯
All of the patterns and measured moves play a role in price action.
I used to constantly clean the charts. Then I started to let it go.
This is when I realized how connected it all really is!
Nothing is ever financial advice.
I look at thing different than most.
My Goal Is To Learn And Teach The Symbiotic Nature Of The Charts.
#BTC #Crypto #Trading
post-image
BTC-0.67%
#70%OfAltcoinsFallBelow200DMA
70% of Altcoins Fall Below the 200-Day Moving Average: Is the Altcoin Market Facing a Major Turning Point?
The cryptocurrency market is sending an important warning signal as approximately 70% of altcoins have reportedly fallen below their 200-day moving average (200 DMA). This development highlights the growing weakness across the altcoin market and raises important questions about investor confidence, market momentum, and the possibility of further downside.
The 200-day moving average is one of the most widely followed technical indicators in financial markets
BTC-0.67%
STABLE-1.39%
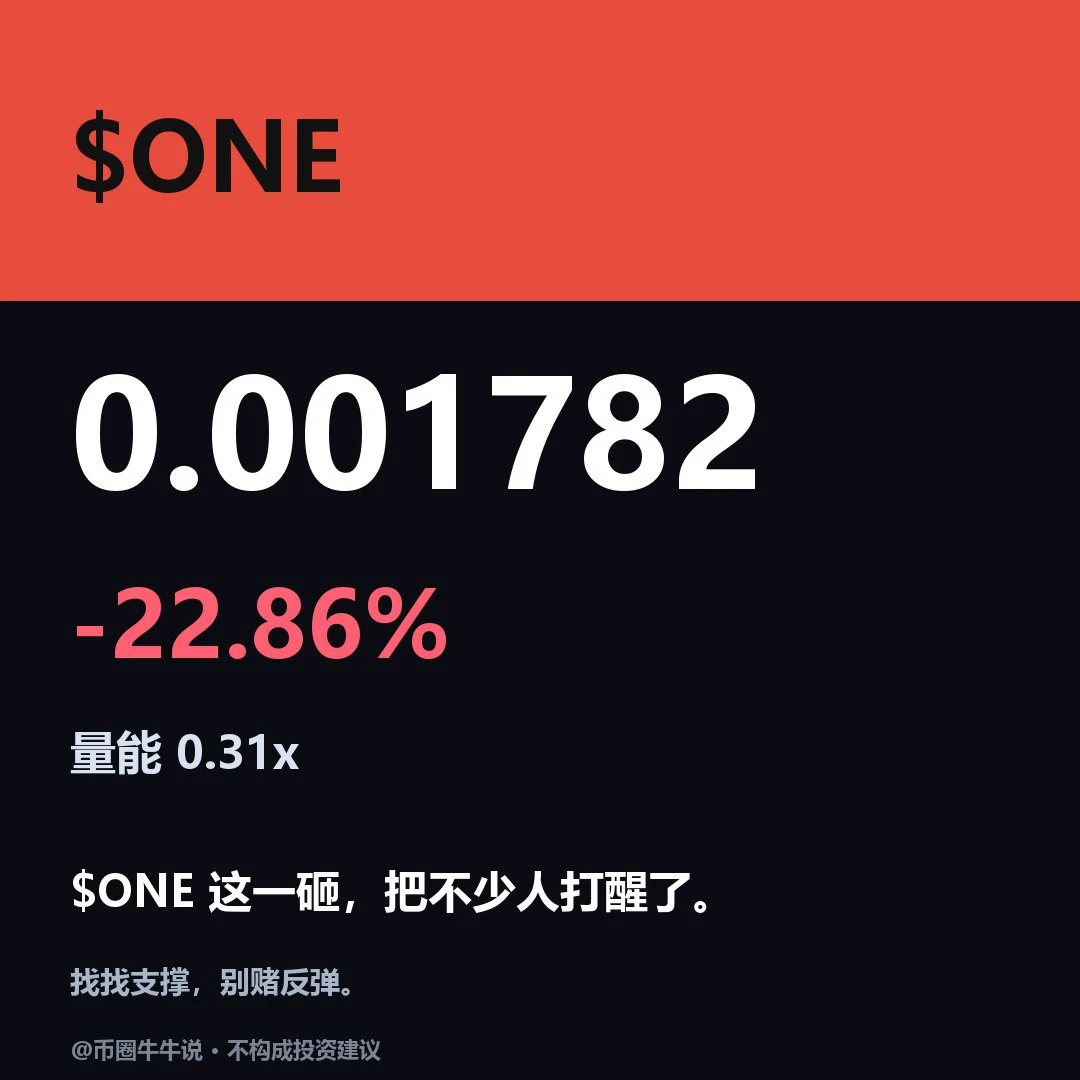
$ONE Current price: 0.001782, 24H -22.86% (0.001692–0.00243). 1H is weak: RSI 46.84/EMA20 0.001937, support at 0.001692/resistance at 0.00243; 4H is strong: RSI 58.43/EMA20 0.001732, support at 0.001027/resistance at 0.002476. The bullish condition is holding above the 0.00243 resistance level; the bearish condition is breaking below the 0.001692 support level. Key points to review are whether 0.00243 holds and whether price can recover after losing 0.001692; the setup is invalid without volume confirmation, with the volume ratio at 0.31x. Market volatility is high; for observation only.
post-image
[NEW STREAMER]market update
live-cover
LIVE495
Idle Earn × Simple Earn: Earn 9% APR on USDT

https://www.gate.com/share/act/00517ab3
post-image
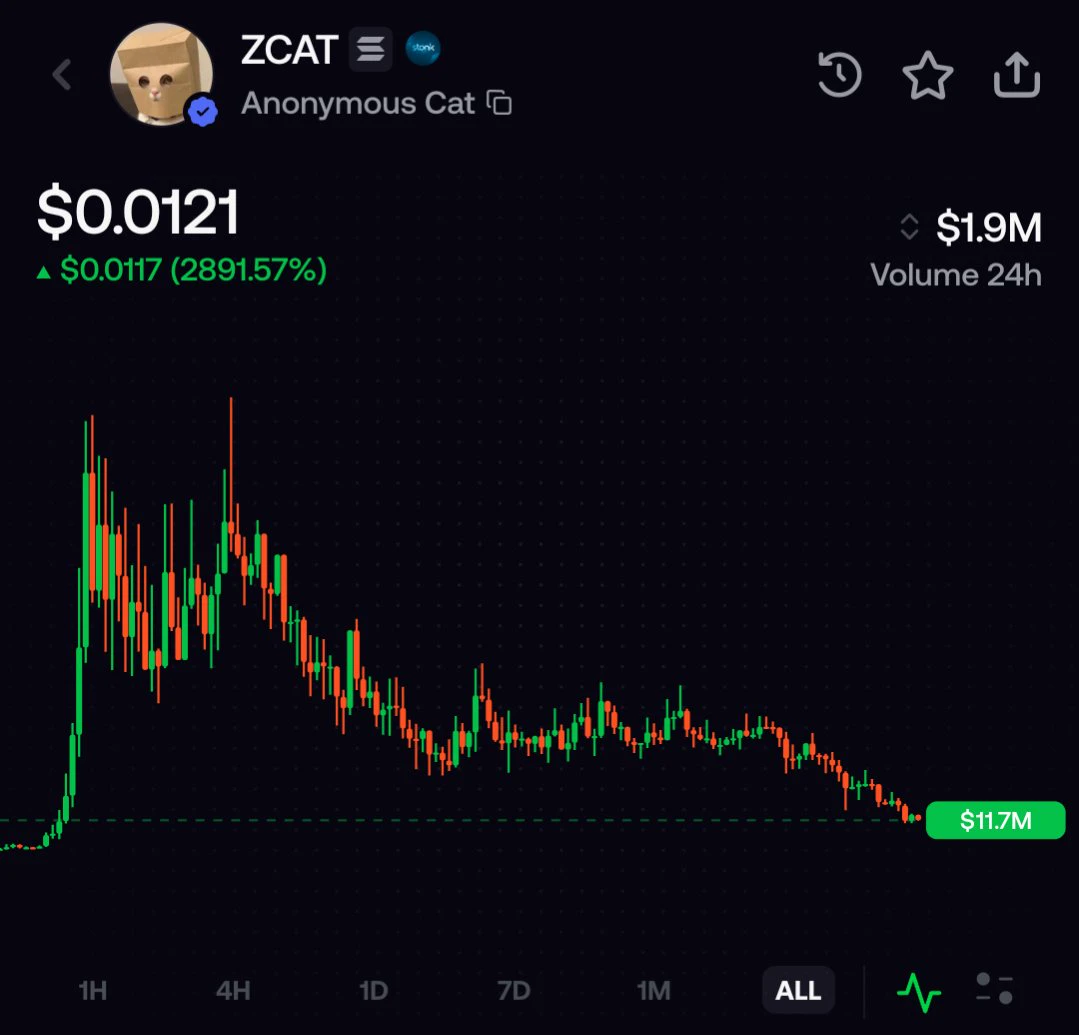
Slingoor nuked his bundle on LMFAO and big titty coin
Was just calling out Ansem for dumping on his followers and look what he does
Never trust a KOL….including me
Get your money and get the fuck outta here 🚶🏾‍♂️🚶🏾‍♂️🚶🏾‍♂️🚶🏾‍♂️🚶🏾‍♂️🚶🏾‍♂️🚶🏾‍♂️
ANSEM-4.82%
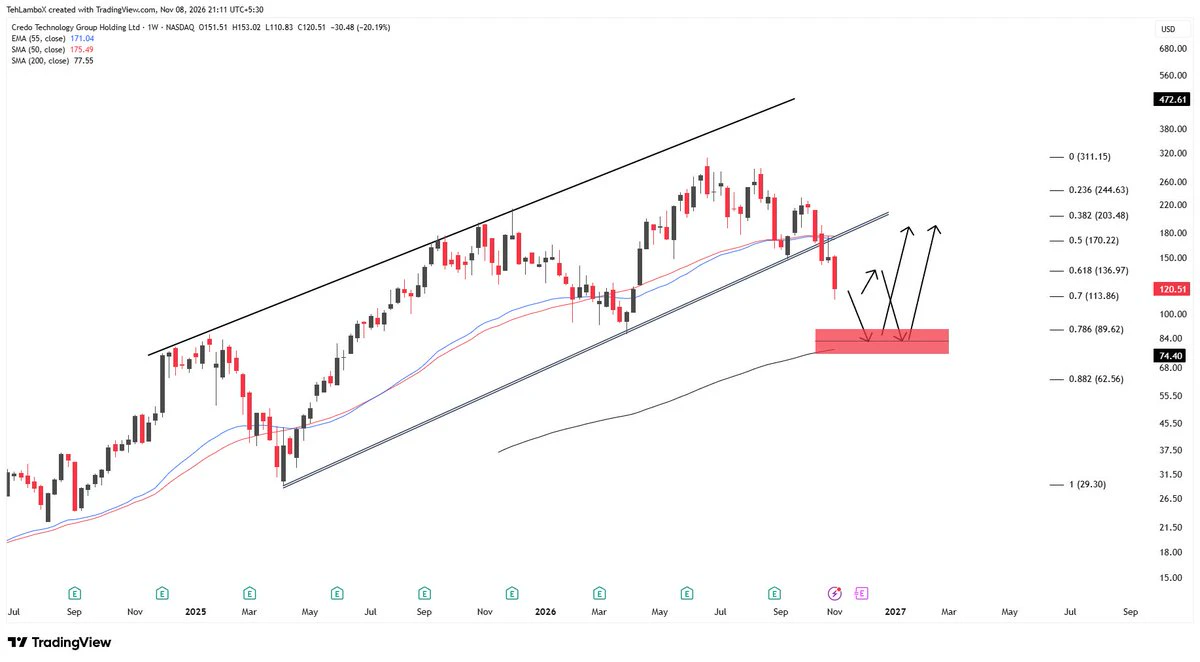
$CRDO fell off from this rising channel..
This has tested 0.7 fib so far but I feel the red zone near 80-85 is calling. 0.786 fib with SMA200 on W1 and a local low of 2026 is there.. That can make it for a perfect bottom. A bounce to 0.618 near 137 can be looked at a perfect opportunityu to short..
post-image
CRDO+7.23%
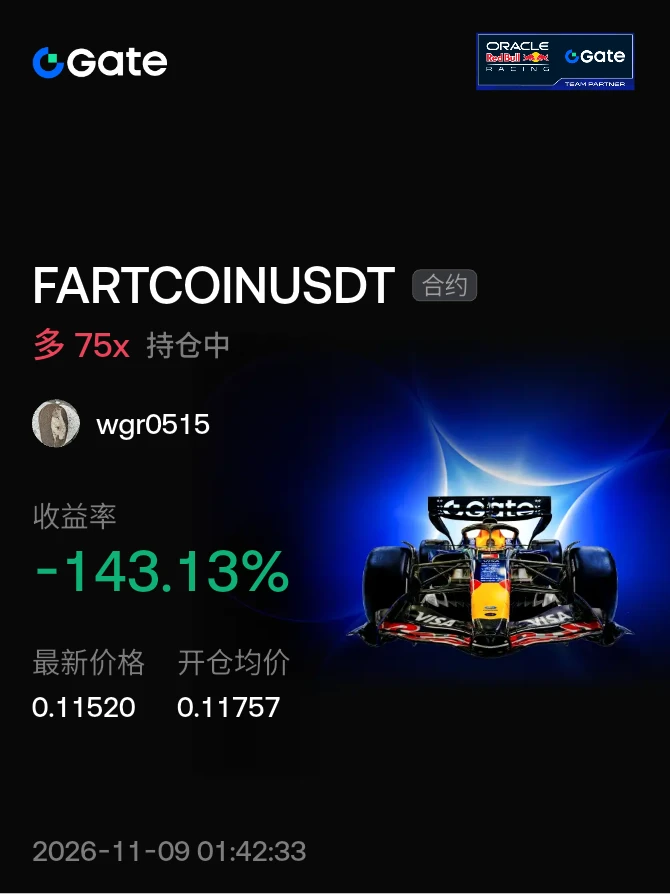
#晒出我的持仓收益 Damn it, I’m about to get liquidated again. Another day as Yang Bailao, a debt slave.🦵🦵🦵🦵🦵🦵🦵🦵🦵🦵🦵🦵🦵🦵🦵🦵🦵🦵🦵🦵🦵🦵🦵🦵🦵🦵🦵🦵🦵🦵🦵🦵🦵🦵🦵🦵🦵🦵🦵🦵🦵🦵🦵🦵🦵🦵🦵🦵🦵🦵🦵🦵🦵🦵🦵🦵🦵🦵🦵🦵🦵🦵🦵🦵🦵🦵🦵🦵🦵🦵🦵🦵🦵🦵🦵🦵🦵🦵🦵🦵🦵🦵🦵🦵🦵🦵🦵🦵🦵🦵🦵🦵🦵🦵🦵🦵🦵🦵🦵🦵🦵
post-image
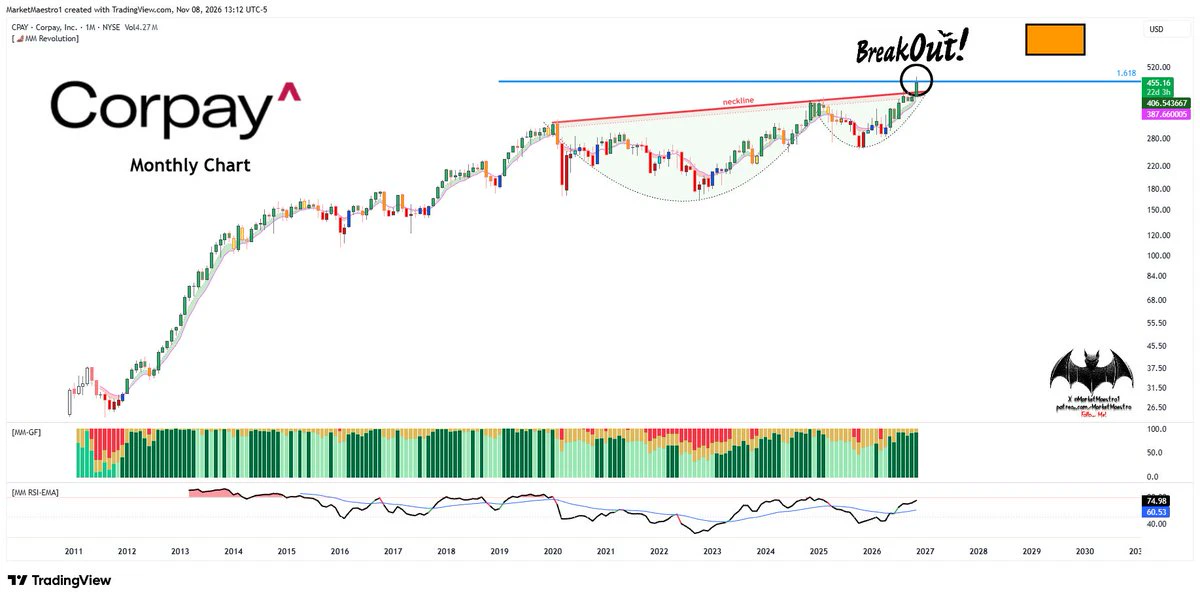
$CPAY
We haven’t seen bullish setups like this in a long time. It reached a key resistance level but broke out 💥 of its cup+handle pattern
post-image
CPAY+1.98%
The most easily overlooked cost in crypto: attention.

BTC and ETH prices are moving, and your attention is being fragmented too:
checking prices, reading group chats, chasing trends, then refreshing once more.

After a busy day, it feels like you’ve seen everything, yet you can’t say which logic you actually believe in.

More information doesn’t necessarily mean you see things more clearly. Sometimes it just means your emotions shift faster.

When you spend the longest time watching the market, is the market clearest—or are you feeling the least sure?

‍#BTC #ETH
post-image
BTC-0.67%
ETH-1.26%
Gold fell from 4,106 to 4,029, but is still up 5% this week—who’s buying, and who’s selling?

Gold’s moves on NFP night were far more interesting than the number itself. Before the data came out, gold was around 4,106, having touched a weekly high of 4,146. After the 165,000 print, spot gold plunged to 4,029.82, dropping nearly $60 and briefly falling more than 1%. Spot gold closed around 4,074, while futures fell $38.6, or 0.94%. On the chart, it was a solid down day.

But look at the weekly chart, and gold is up more than 5% this week, its best weekly performance since August. In other words
BTC-0.65%
$ONE Down 21% in one day, from 0.0024 straight to 0.0017—this isn't a pullback, it's a panic-driven sell-off. Technically, 0.0018 has already broken below the previous low support. Daily volume surged to 391M as holders sold, and the MACD death cross is widening to the downside, with no signs of divergence—pure bearish structure. Market sentiment is pure panic, with traders dumping on each other. Net outflows haven't stopped, and the 24-hour high of 0.0024 has become a firm short-term ceiling. Don't try to catch a falling knife. Wait for 0.0017 to stabilize before reassessing. If entering at 0
$GNS pumps 50% in a single candle 🔥Yesterday was about $ONE and today is about $GNSCongratulations 🎉 if you bought some when I called it yesterdayLike 👍 this post if you are bullishGNSPriceAnalysis
post-image
GNS-6.46%
ONE-1.19%
Load More

Join 40 M users in our growing community

⚡️ Join 40 M users in the crypto craze discussion

💬 Engage with your favorite top creators

👍 See what interests you

Trending Topics

USCPIDataIncoming

13.55k Views1.64k Discussing

The U.S. October CPI report will be released on November 10 at 8:30 a.m. ET. September CPI came in at 3.7% year over year, and markets will be watching closely for signs that inflation is cooling, especially in core CPI. A softer-than-expected reading could strengthen rate-cut expectations, while hotter inflation may pressure risk assets through higher Treasury yields and a stronger dollar. How do you think this CPI print will move $BTC, U.S. stocks and gold?

USAIStocksHitHard

28.45k Views3.74k Discussing

USNonfarmPayrolls

54.47k Views4.49k Discussing

View More