


Share your thoughts
placeholder
Article
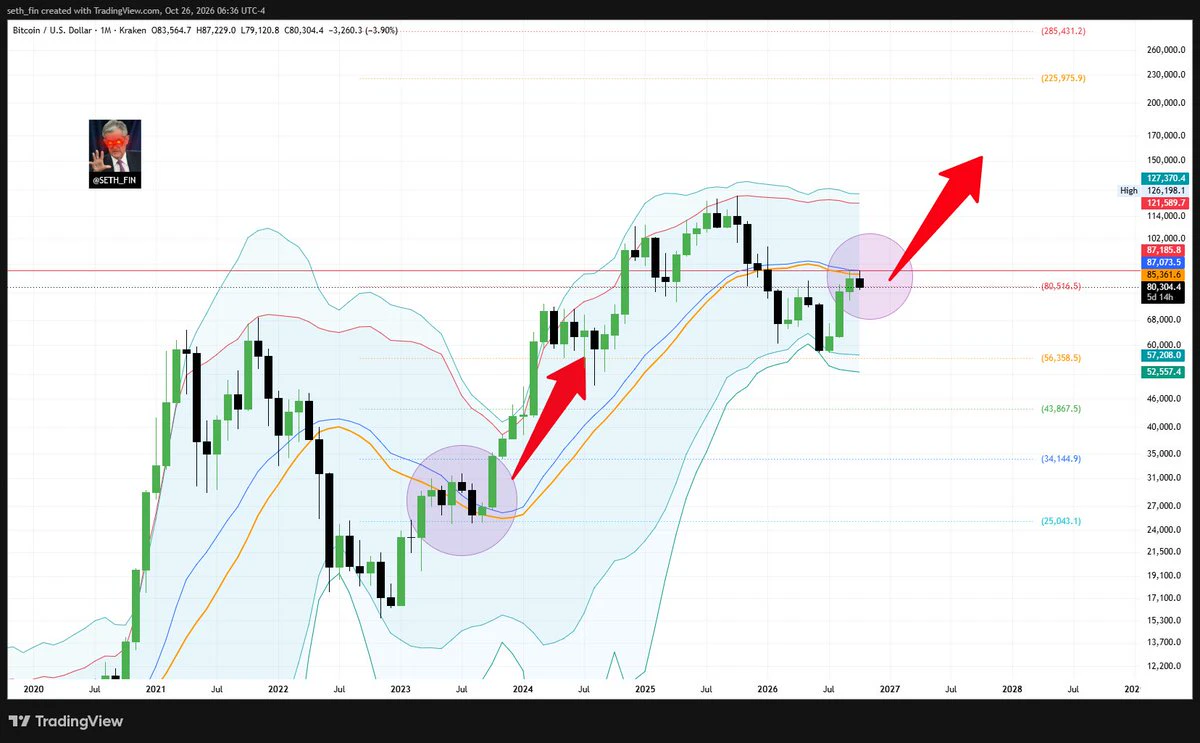
3 ways to short Bitcoin
post-image
BTC+1.77%
#HBMShortageBoostsAIChipPrices
HBM Shortage and the Rising Cost of AI Chips: Why the Real Bottleneck Is Memory
When people talk about the cost of AI, the conversation usually starts with the GPU. That is the wrong place to start. In 2026, the most expensive and least elastic component inside an AI accelerator is not the logic die sitting in the middle of the package — it is the memory stacked on top of it. High Bandwidth Memory, or HBM, has moved from a technical footnote to the single biggest constraint on the entire AI hardware supply chain, and the numbers behind that shift are genuinely e
  • 1
This was RAXOL on July 29th.
I flagged it to Pro members as one of the most interesting undervalued plays on Robinhood Chain while it was still sitting at a tiny market cap.
Since that post, it’s up over 1,100%.
This is the kind of opportunity we’re looking for.
Small. Undervalued. Still early.
Then you let the market do what it does.
That’s another one for the receipts.
post-image
From 0.05094 to 0.02936, those who chased CVC yesterday rode through a bull-bear cycle overnight
$CVC crashed from 0.05094 to 0.02936 and is now trading at 0.03143. With huge volume and a steady decline, I only short; any rebound is an escape window.

24h trading volume was approximately 19.8 million USDT, 20.9 times the 30-day average. With volume this large but the price still steadily declining—it is distribution, not a shakeout.

Bearish logic: First, the funding rate is -0.002468, showing that shorts have not backed off; second, the long-short account ratio is 1.1026, meaning the longs
post-image
CVC-3.56%
##JPMorganRaisesMeta$820
What actually happened. On September 10, 2026, JPMorgan analyst Doug Anmuth upgraded Meta Platforms to Overweight from Neutral and raised his price target to $820 from $640, an increase of roughly 28 percent. One correction worth making straight away: the target is $820, not $829, and it is a December 2027 target rather than one for this year. Based on the prior close, it implied somewhere between 25 and 30 percent upside, and at $820 per share Meta's market capitalisation would cross the $2 trillion mark against roughly $1.65 trillion today. The valuation maths is si
  • 1
Let's launch another launch pad to further disperse liquidity and confuse everyone
post-image
Kira's portfolio is thriving! 🚀 In the past 3 months, we've seen a +9.42% gain, annualized at +14.68%. From a baseline of 1.4503 to $1.59, we're unlocking new DeFi potential! 🔍✨ #Crypto #Trading #Portfolio
Ready to start your journey?
post-image
Market Updates
live-cover
LIVE1,675
#GateTopsGlobalGrowth
When I look at Gate’s recent growth, I honestly don’t think there is just one metric worth watching. Trading volume, liquidity, products, and user growth are all connected, and each one tells us something different about how an exchange is expanding. A big volume number can look impressive, but without enough liquidity it doesn’t tell the whole story. More users are positive, but if they cannot trade efficiently, that growth loses some of its value. New products can attract attention, but the real test is whether traders actually use them. That’s why I look at Gate’s gro
GateSquare
📈 Three metrics to see Gate’s growth rate.
CryptoQuant’s latest report shows:
🥉 Top 3 globally in spot trading volume
🥇 Spot 30-day growth of +667%, ranking No. 1 globally
🥉 Top 3 globally in derivatives trading volume growth
Spot trading volume is increasing, while spot and derivatives trading activity are also growing simultaneously.
Rankings show strength, while growth rates show trends.
What do you think is most worth watching about Gate’s growth this round? 👀
👇 Post with the hashtag #Gate增速全球第一 to discuss:
Trading volume, liquidity, products, or the growing number of users entering the market?
👉 View the full report:
https://cryptoquant.com/insights/research/6aa7aaca26ed15760f9ca834-14-September-2026-Volume-Comeback-Exchange-Trading-Volume-Spikes-Into-The-Bull-P?utm_source=twitter&utm_medium=sns&utm_campaign=research&utm_content=special-crypto-report
repost-content-media
BTC+1.77%
RWA+0.74%
  • 1
Technological development has caused the number of MEME coins to grow exponentially.
All you need to do is post “bullish on $AI” on and two things will happen on-chain at the same time: the post will be published and the term $AI will be bought.
The first time someone posts a new term, a market for that term will also be created, with a genesis reference price starting at 0.0001 SOL. The same term corresponds to only one market across the entire platform, so multiple versions with the same name will not split the funds.
If you can predict in advance that a certain term will become the narrat
post-image
MEME-2.54%
SOL+1.51%
$FIL /USDT is range-bound but the 1h RSI is whispering a trap to shorts.

$FIL /USDT - SHORT

Trade Plan:
Entry: 0.9845 – 0.9999
SL: 1.0663
TP1: 0.9366
TP2: 0.8995
TP3: 0.8439

Why this setup?
Why now? The 1h price is locked at 0.9922, sitting right inside the entry zone of 0.9845 to 0.9999, which means we are at the precise trigger for a short. The daily trend is range, so the move is expected to stay within the bounds until a break, and the 15m RSI at 50.34 shows neither overbought nor oversold, leaving room for a directional push. The 1h ATR of 0.030892 tells us the average hourly volati
FIL-0.67%
Buy the dip now or stay safe first? Answer: stay safe first. Current price 0.002038, down 4% in 24h, RSI 37.9 is not oversold, MACD is bearish, MA5 is below MA20, and the funding rate is +0.0050%, with longs still paying fees. In the worst case, it may fall to the lower Bollinger Band at 0.002022. Enter at 0.002030-0.002038 with a small position to try a long; take-profit 1 at 0.002078 (MA20 resistance), take-profit 2 at 0.002130 (upper Bollinger Band), and stop-loss at 0.002018 (exit if it breaks below the lower band). Also monitor: $HEMI and $ASTR are relatively weak; do not chase.
(Person
post-image
1000cat
1000cat为1000只小猫伸张正义
Four.meme
MC:$3.35KHolders:5
0.03%
HEMI+7.89%
ASTR-3.93%
The hawk rouses itself, extends its wings, and takes flight once more into the heavens. It surveys the woodland beneath, eager to spot game before daylight fades and darkness descends.🖲The cat slumbersDesk lamp
post-image
My bot is freaking out 🤣🤣
post-image
BOT+0.95%
$SOXL Plunging 13.59% in a single day, from 118 to 99.8, with 13.36 million shares changing hands in massive volume—this isn’t a pullback; it’s a stampede. SOXL is a 3x leveraged semiconductor ETF, so a 13% drop means the semiconductor index fell about 4.5%—the same linkage logic as BTC and the Fed: the market is betting on delayed rate cuts, and high-beta assets get hit first. My strategy is straightforward: don’t catch the falling knife or hold and hope. First, position size: keep total exposure below 5%; leveraged ETFs are essentially consumables. Second, entry: wait for the daily close to
BTC+1.77%
  • 1
📊 Gate’s 24H futures open interest has surpassed $11.479B, ranking among the top 3 CEXs globally.
Markets move up and down, but trading activity and capital concentration say a lot about where traders are active 👀
When choosing a futures trading platform, what matters most to you?
👇 Post with #GateFuturesOpenInterestTop3 and share your view.
You can also share your latest futures trading strategy.
👉 Join Gate Square:
http://gate.com/post
  • 2
market update
live-cover
LIVE2,042
Uhm mister president... We have a bit of a problem here.
post-image
#Gate增速全球第 Gate’s Global Growth Momentum Deserves the Spotlight 🚀🌍
The global crypto industry is entering an increasingly competitive era. New technologies, new financial products, growing institutional interest, expanding Web3 adoption, and a rapidly increasing number of users are transforming the digital-asset landscape.
In this environment, growth is one of the most important signals to watch.
That is why #Gate增速全球第 is a topic worth discussing.
Gate’s growth story is not simply about becoming larger. The more important question is how a global crypto platform can continue expanding while
Insiders are quietly watching SYMBOL break range for a long setup

$SAMSUNG /USDT - LONG

Trade Plan:
Entry: 179.51 – 180.19
SL: 175.61
TP1: 183.03
TP2: 185.15
TP3: 188.34

Why this setup?
Why now? The daily trend is range, but the 1h price is sitting near 179.87 with a 15m RSI of 37.68, hinting at oversold exhaustion within the range. The 1h ATR of 1.360201 shows enough volatility to fuel a move toward the entry zone around 179.85 without a full range breakdown. From entry, the first target sits at 183.03, followed by 185.15, giving the trade measured upside while the daily range structure
SAMSUNG-4.97%
Load More

Join 40 M users in our growing community

⚡️ Join 40 M users in the crypto craze discussion

💬 Engage with your favorite top creators

👍 See what interests you

Trending Topics

GateTopsGlobalGrowth

23.97k Views417 Discussing

According to the latest CryptoQuant data, Gate's spot trading volume ranks top 3 globally, with the fastest growth worldwide, while futures trading volume growth also ranks top 3 globally. Market activity is accelerating back, and Gate's growth momentum continues to lead. Market heat is back — are you mainly trading spot or futures these days? [👉 Full report:](https://cryptoquant.com/insights/research/6aa7aaca26ed15760f9ca834)

GateUSExpandsTo37StateLicenses

21.63k Views252 Discussing

AnthropicPicksNasdaqForIPO

72.25k Views2.7k Discussing

View More