Square
Following
Hot
News
Notifications
Profile
Share your thoughts
placeholder
Article
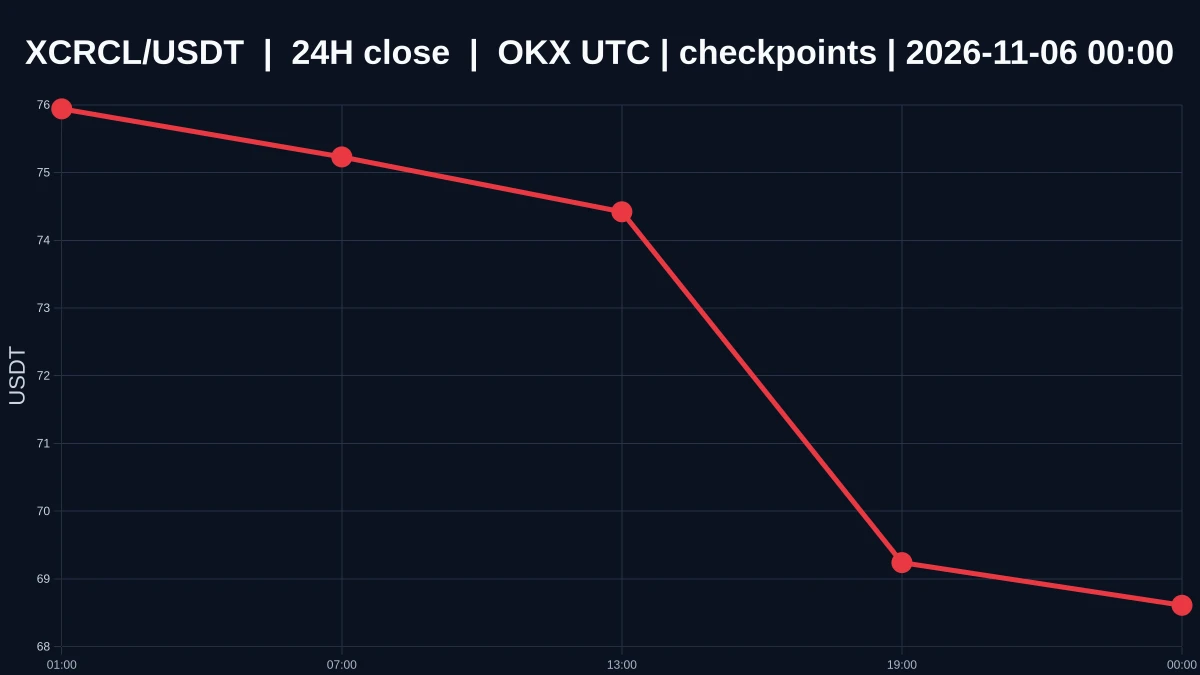
$XCRCL has entered oversold territory, so why can’t we say it has bottomed?
$XCRCL is currently priced at 68.51, down 9.938214802155898% over 24 hours, with an intraday high of 76.63 and a low of 65.34. The 1-hour and 4-hour trends are both weak, and the 1-hour volume ratio is 0.1954847501741418. The price has pulled back from 76.63 to 68.51. Short-term oversold conditions are building, but the structure has not stopped weakening, so I would not call oversold a bottom.
Oversold describes a price that has fallen enough over a short period. A bottom describes selling pressure truly drying up and
post-image
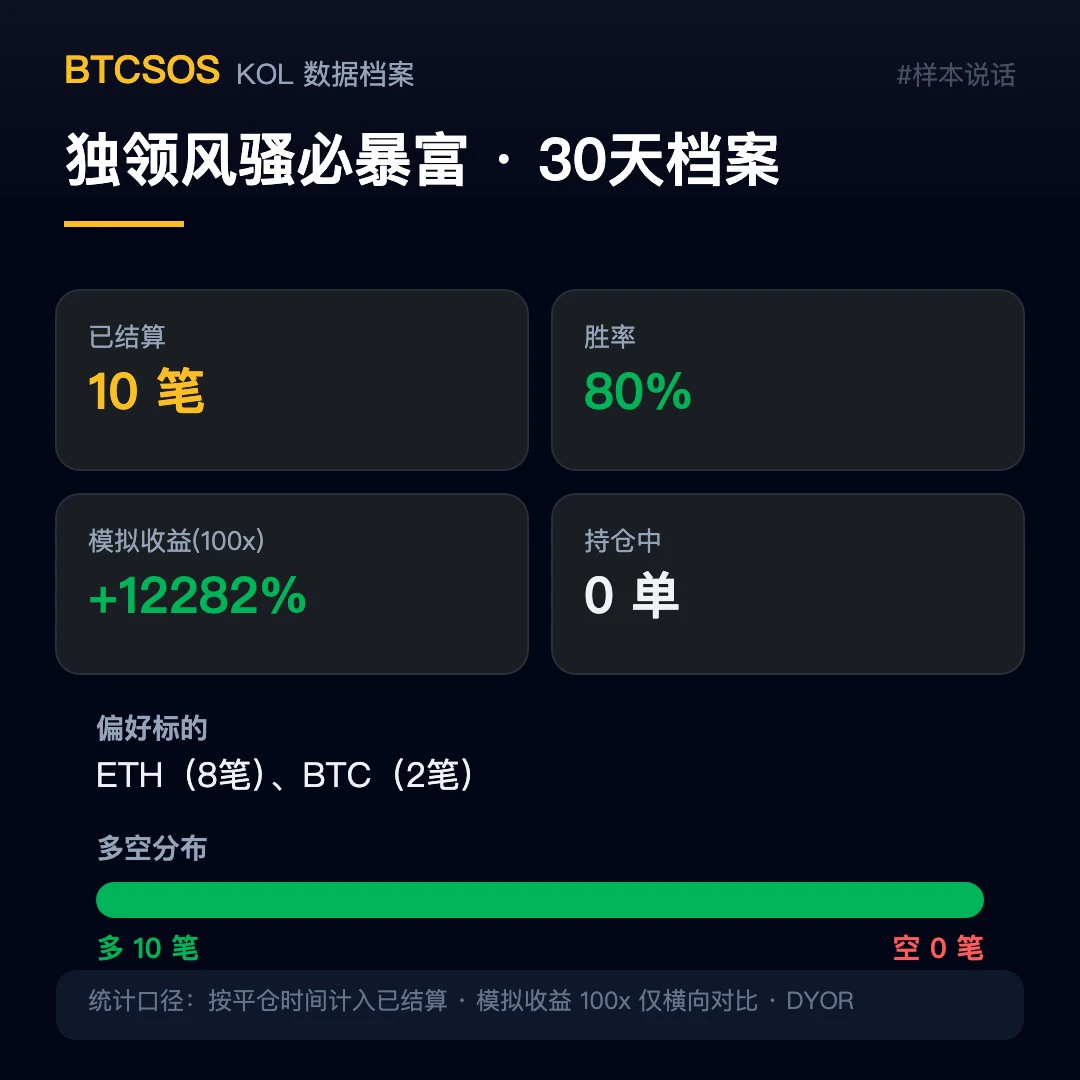
A standout destined for wealth · Data profile for the past 30 days 📋
10 trades settled, 8 hits, 80% win rate; simulated returns (100x basis) +12282%. Prefers $ETH (8 trades) and $BTC (2 trades), all long—10 longs, 0 shorts, a classic one-way trader. No open positions currently; flat and sitting on the sidelines.
Speaking of, I looked into this trader yesterday (11-04) too. At the time, the stats were also 8/10 wins and +12282%; checking again now, they're still the same—basically no change, with no new settlements in this window.
A reminder: the data is tallied by closing time, and all record
post-image
ETH-1.23%
BTC-0.65%
Trenches
ZIG
Z
bade
b
ZIG
0x8c...1145
Market Cap
$.
Change
.
24h Vol
$.
Holders
.
BTC
B
bade
b
BTC
C5xp...pump
Market Cap
$.
Change
.
24h Vol
$.
Holders
.
CORLA
C
bade
b
CORLA
0xba...7777
Market Cap
$.
Change
.
24h Vol
$.
Holders
.
STONK
S
bade
b
STONK
6GmA...UNgx
Market Cap
$.
Change
.
24h Vol
$.
Holders
.
DESSA
D
bade
b
DESSA
npz2...pump
Market Cap
$.
Change
.
24h Vol
$.
Holders
.
$ZEC The way the market maker is operating this coin is truly eye-opening. I’d call it “invisible BTC.” For three whole months, they’ve relentlessly pushed it upward, with not even a hint of a pullback—they’re controlling the price shamelessly. What’s even more outrageous is that whenever the broader market crashes, it takes the opportunity to pump hard, obviously riding the hype to grab attention. I’m done fighting it and admit defeat; I’m just asking for a decent exit window. Risk warning: The above is merely my personal, emotional rant and does not constitute investment advice. Contract tra
post-image
ZEC+1.29%
  • 1
Morning Market Update
live-cover
LIVE1,421
MARKET UPDATE
live-cover
LIVE1,060
Three trillion wiped out overnight—brutal. 【U.S. Market Snapshot | Tech-heavyweights lead declines; Nasdaq rebound still needs confirmation】
1. On the heatmap, NVDA is down about −9.26%, MU about −17.46%, and TSLA about −10.77%, with tech and semiconductors broadly weak. A rebound in the indexes does not mean market breadth has recovered.
2. Nasdaq CFD around 28406: First watch whether resistance can be reclaimed; don't chase the first green candle off the lows.
3. Sandisk perpetual around 845: Rebounding after a sharp drop, with around 915 as the first resistance to watch for a recovery and 8
post-image
NAS100-0.07%
NVDA-9.33%
MU-17.23%
TSLA-10.84%
SNDK-0.18%
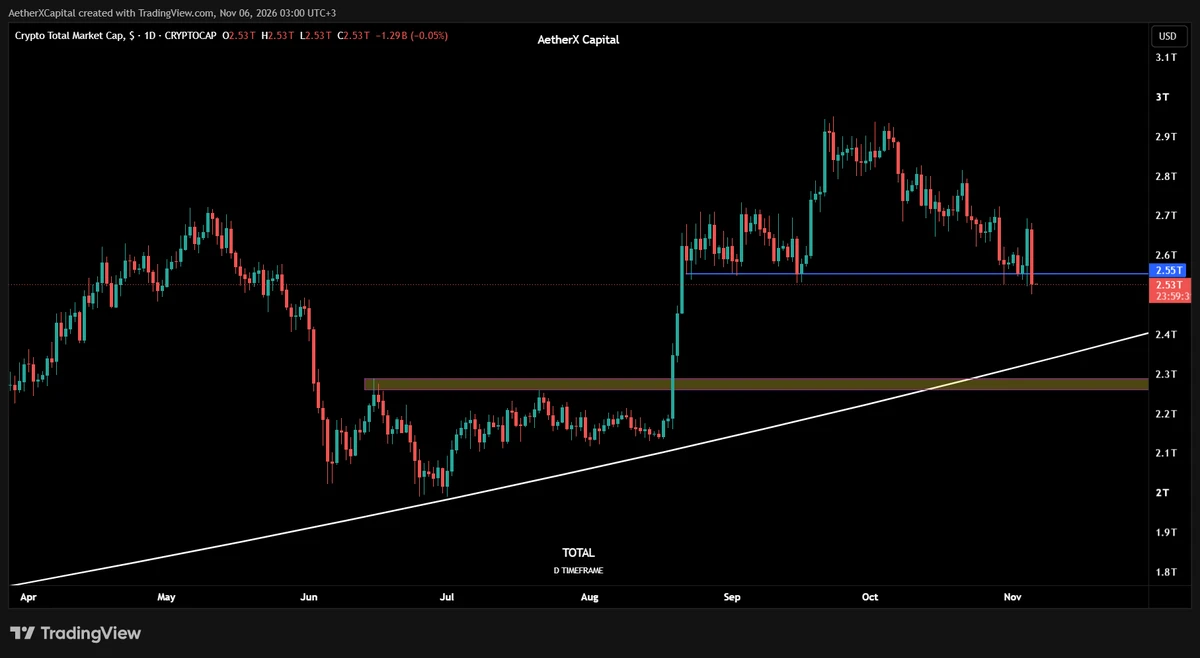
If TOTAL loses 2.55T as support, we can expect it to reach the 2.26T–2.29T area
post-image
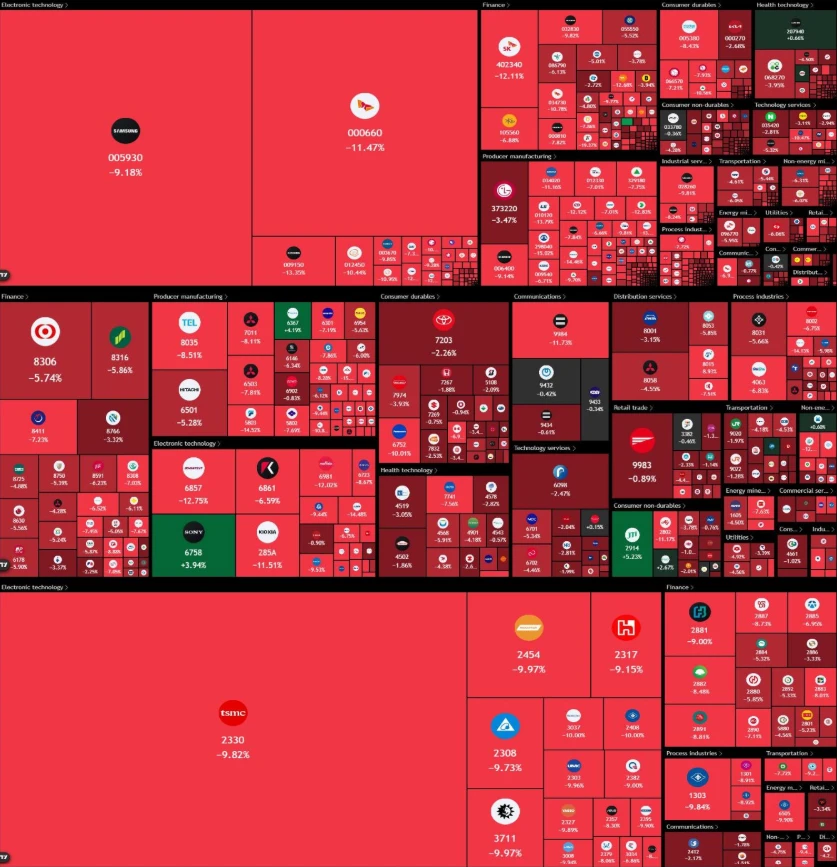
BREAKING: Asia now has 4 major stock markets in bear markets, after Japan and Taiwan joined today.

🇰🇷 South Korea: −45% from its June record
🇨🇳 China’s Shenzhen: −30% from its June high
🇹🇼 Taiwan: −24% from its October record
🇯🇵 Japan: −21% from its June record

Japan, South Korea and Taiwan have lost over $900,000,000,000 this morning.

AI giants TSMC, SK Hynix and SoftBank are all down around 10%.

It follows US chip stocks’ 2nd worst day on record.
post-image
TSM-10.96%
SK Hynix-7.59%
SKHY-13.76%
#美股财报季 #Gate股票畅聊季 #WCTCS9 #每周来晒

U.S. Tech Stocks Suffer Historic Plunge! Nasdaq Enters Correction Territory: What Comes Next, Based on History?

On Thursday, U.S. tech stocks suffered a historic plunge as concerns intensified that an AI infrastructure slowdown could follow the Democrats’ sweep of Congress, pushing the Nasdaq Composite into correction territory.

  History suggests the market may face more selling pressure in the short term, but a recovery often follows three months later.$NAS100

  The tech-heavy Nasdaq Composite plunged 5.52% in a single day, its biggest one-day drop sinc
post-image
NAS100+1.39%
  • 1
Tonight’s nonfarm payrolls data:

If the numbers come in way above expectations, unemployment doesn’t rise, and wages increase, rate-hike expectations will climb again—and that would be a double whammy for the market!

But last night’s drop had already priced in the expectations, and the analyst above has already explained that if the nonfarm payrolls data is fairly strong and rate-hike expectations ease, the market could potentially V-rebound. After all, the bill that was just introduced is only a proposal. It simply reflects the Democrats’ push to tighten AI policy and the uncertainty that c
post-image
#DemocratsWinBothChambers
Democratic Control of Both US Congress Chambers: Political, Economic, and Market Analysis
The Democratic Party has secured majorities in both the House of Representatives and the Senate following the 2026 midterm elections. This shifts the balance of power in Washington for the final two years of the current presidential term, creating a period of divided government. The House of Representatives is the lower chamber of Congress, where all 435 seats were contested. The Senate is the upper chamber, with roughly one-third of its 100 seats up for election. Democrats fli
  • 4
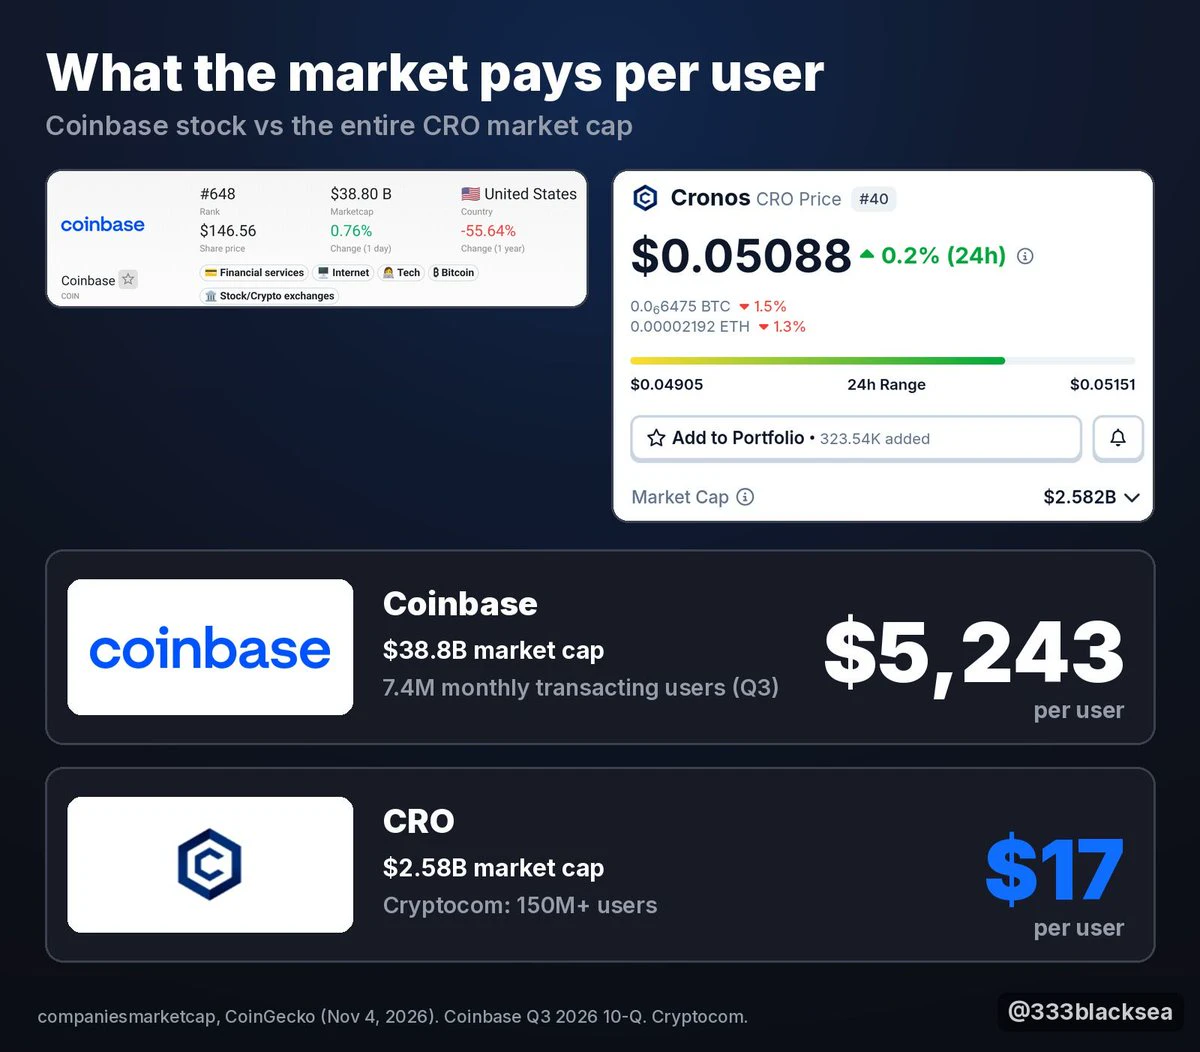
Coinbase had 7.4 million people trade on it last quarter.
The stock is worth $38.8 billion.
Cryptocom has over 150 million users.
CRO is worth $2.58 billion.
Coinbase: $5,243 per user.
CRO: $17 per user.
Wall Street already knows how to price an exchange. It just hasn't gotten to this one yet.
post-image
COIN-9.72%
CRO-2.47%
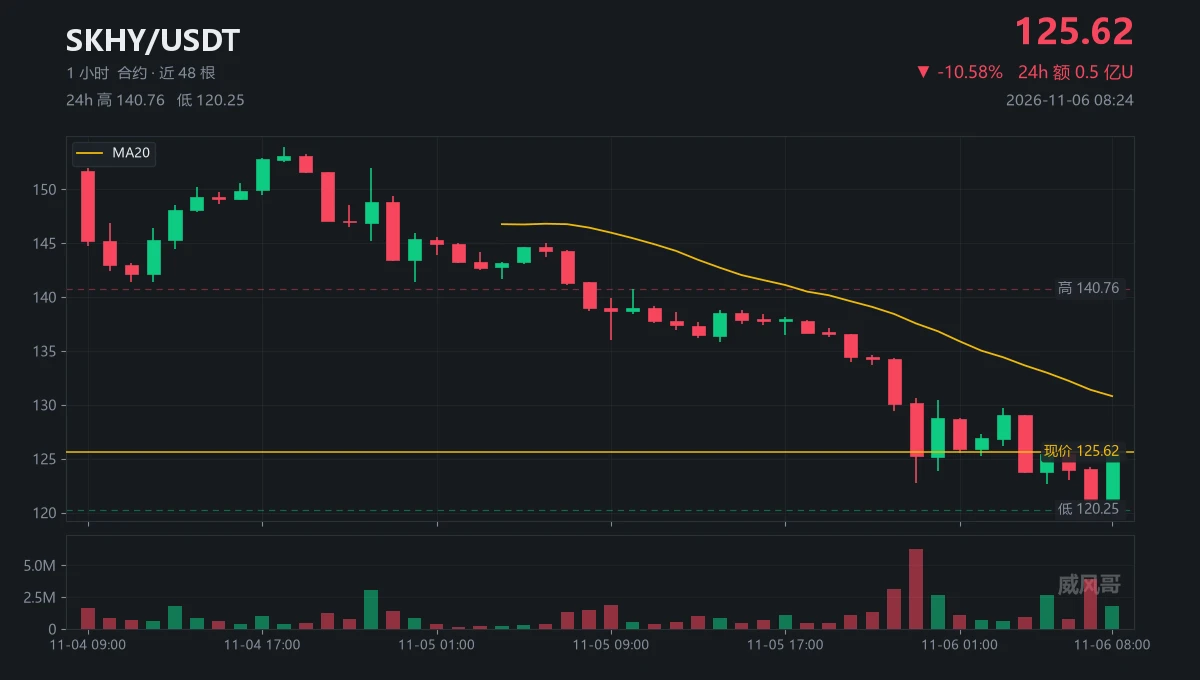
An eleven-point drop—is that enough to make people give up?
Someone left me a message: Is SK Hynix completely done for?
I replied: First, look at who's buying at 120.25
At 07:00, it plunged to 120.25 on volume of 3.96 million lots
The average volume over 48 candles is only 1.19 million—that's 3.3x (the hardest dump, closing at 121.13)
An hour later, it climbed back to 125.46
Yesterday at 23:00 was even more brutal: 6.24 million lots, 5.3x
It plunged straight from 130.17 to 122.78, shedding 7.4 points in one candle
Two big bearish candles, each dumping harder than the last
But the low only move
post-image
SKHY+0.86%
  • 12
  • 2
#GateLaunchesPoSECProofOfSecurity
Gate Introduces PoSEC: Taking Crypto Security and Transparency to the Next Level
Security and transparency are two of the most important foundations of the cryptocurrency industry. As more people enter the digital asset market, they need confidence that their funds are properly managed, stored and protected.

This is why I appreciate Gate's introduction of Proof of Security (PoSEC). In my opinion, this is an important step toward making exchange security more transparent and measurable.

Gate is showing that protecting customer assets is not only about mainta
BTC-0.67%
ETH-1.26%
GT-2.41%
DOGE-0.22%
SOL-0.77%
  • 5
$XRP It's at a key support level. Whether the bulls can hold it comes down to this move. The hardest part of trading isn't really calling the direction—it's waiting for a signal you understand. Now it's time to wait for confirmation. If it holds, there's something to discuss; if it doesn't, that's a different story. As for this coin, we'll come back next week to see if this call was right. If you're watching it, keep an eye on it.
post-image
XRP-1.15%
  • 9
  • 1
Anthropic’s AI Verification Tool Has a Costly Catch
FlashProve could help verify model computation, but its benchmark takes roughly 70 to 95 times the GPU work of ordinary inference.
Quick Take
⚠️ Personal market analysis only. NFA — manage risk and DYOR.
Educational content, not investment advice or a recommendation to buy, sell, deposit, or withdraw any asset. No paid promotion or referral/affiliate links.
post-image
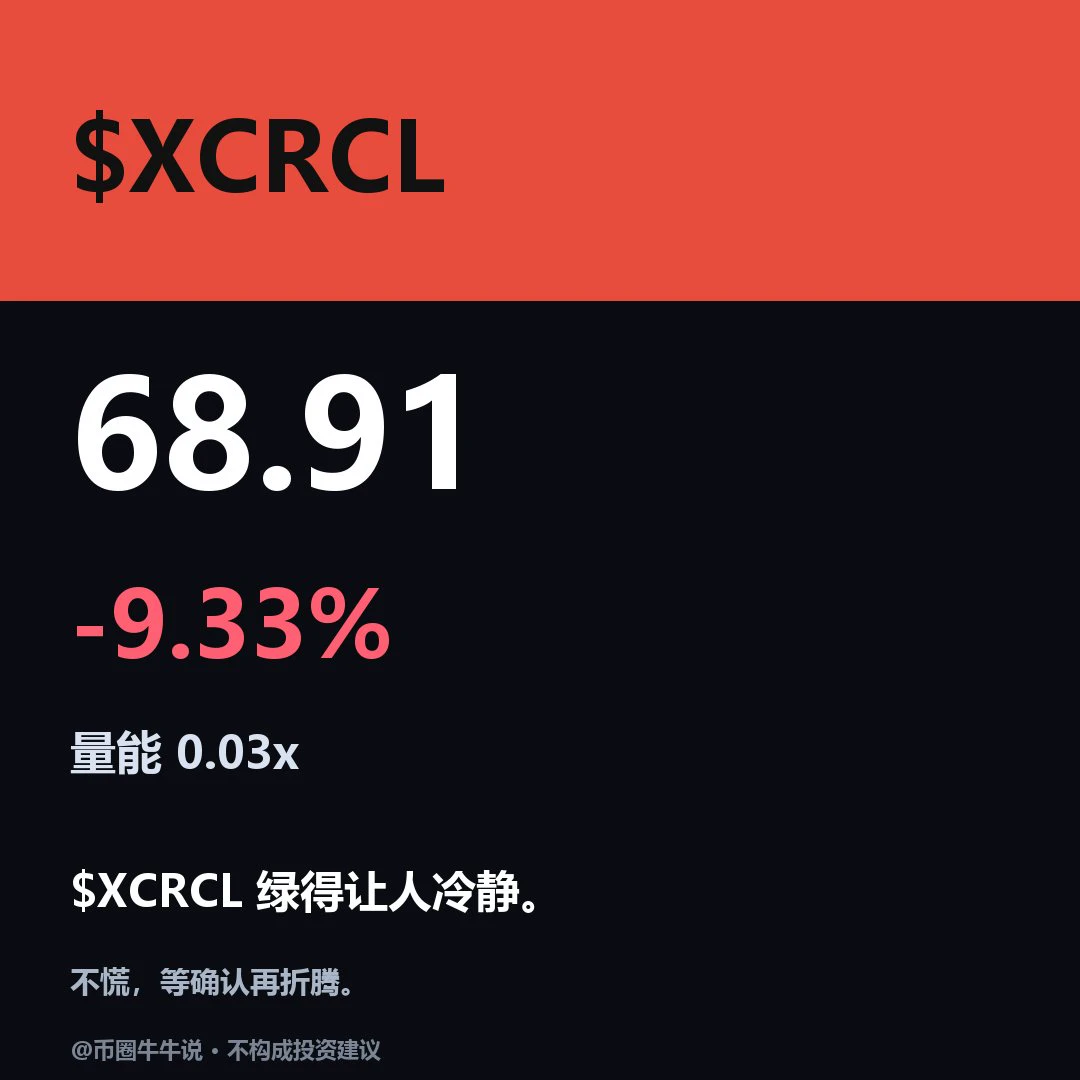
$XCRCL Currently at 68.91, down 9.33% over 24H (65.34–76.50). Weak on the 1H: RSI 30.59, with price below EMA20 at 70.50; weak on the 4H: RSI 37.55, with price below EMA20 at 72.75. 1H volume ratio is 0.03. If price holds above the 76.5 resistance, watch for continuation; a break below the 65.34 support would weaken the short-term outlook. Follow up to check whether price can hold above 76.5 and recover after losing 65.34. Volume is only 0.03x the average, so a single break above a level still needs confirmation from participation; if price breaks below and fails to recover, the setup is inval
post-image
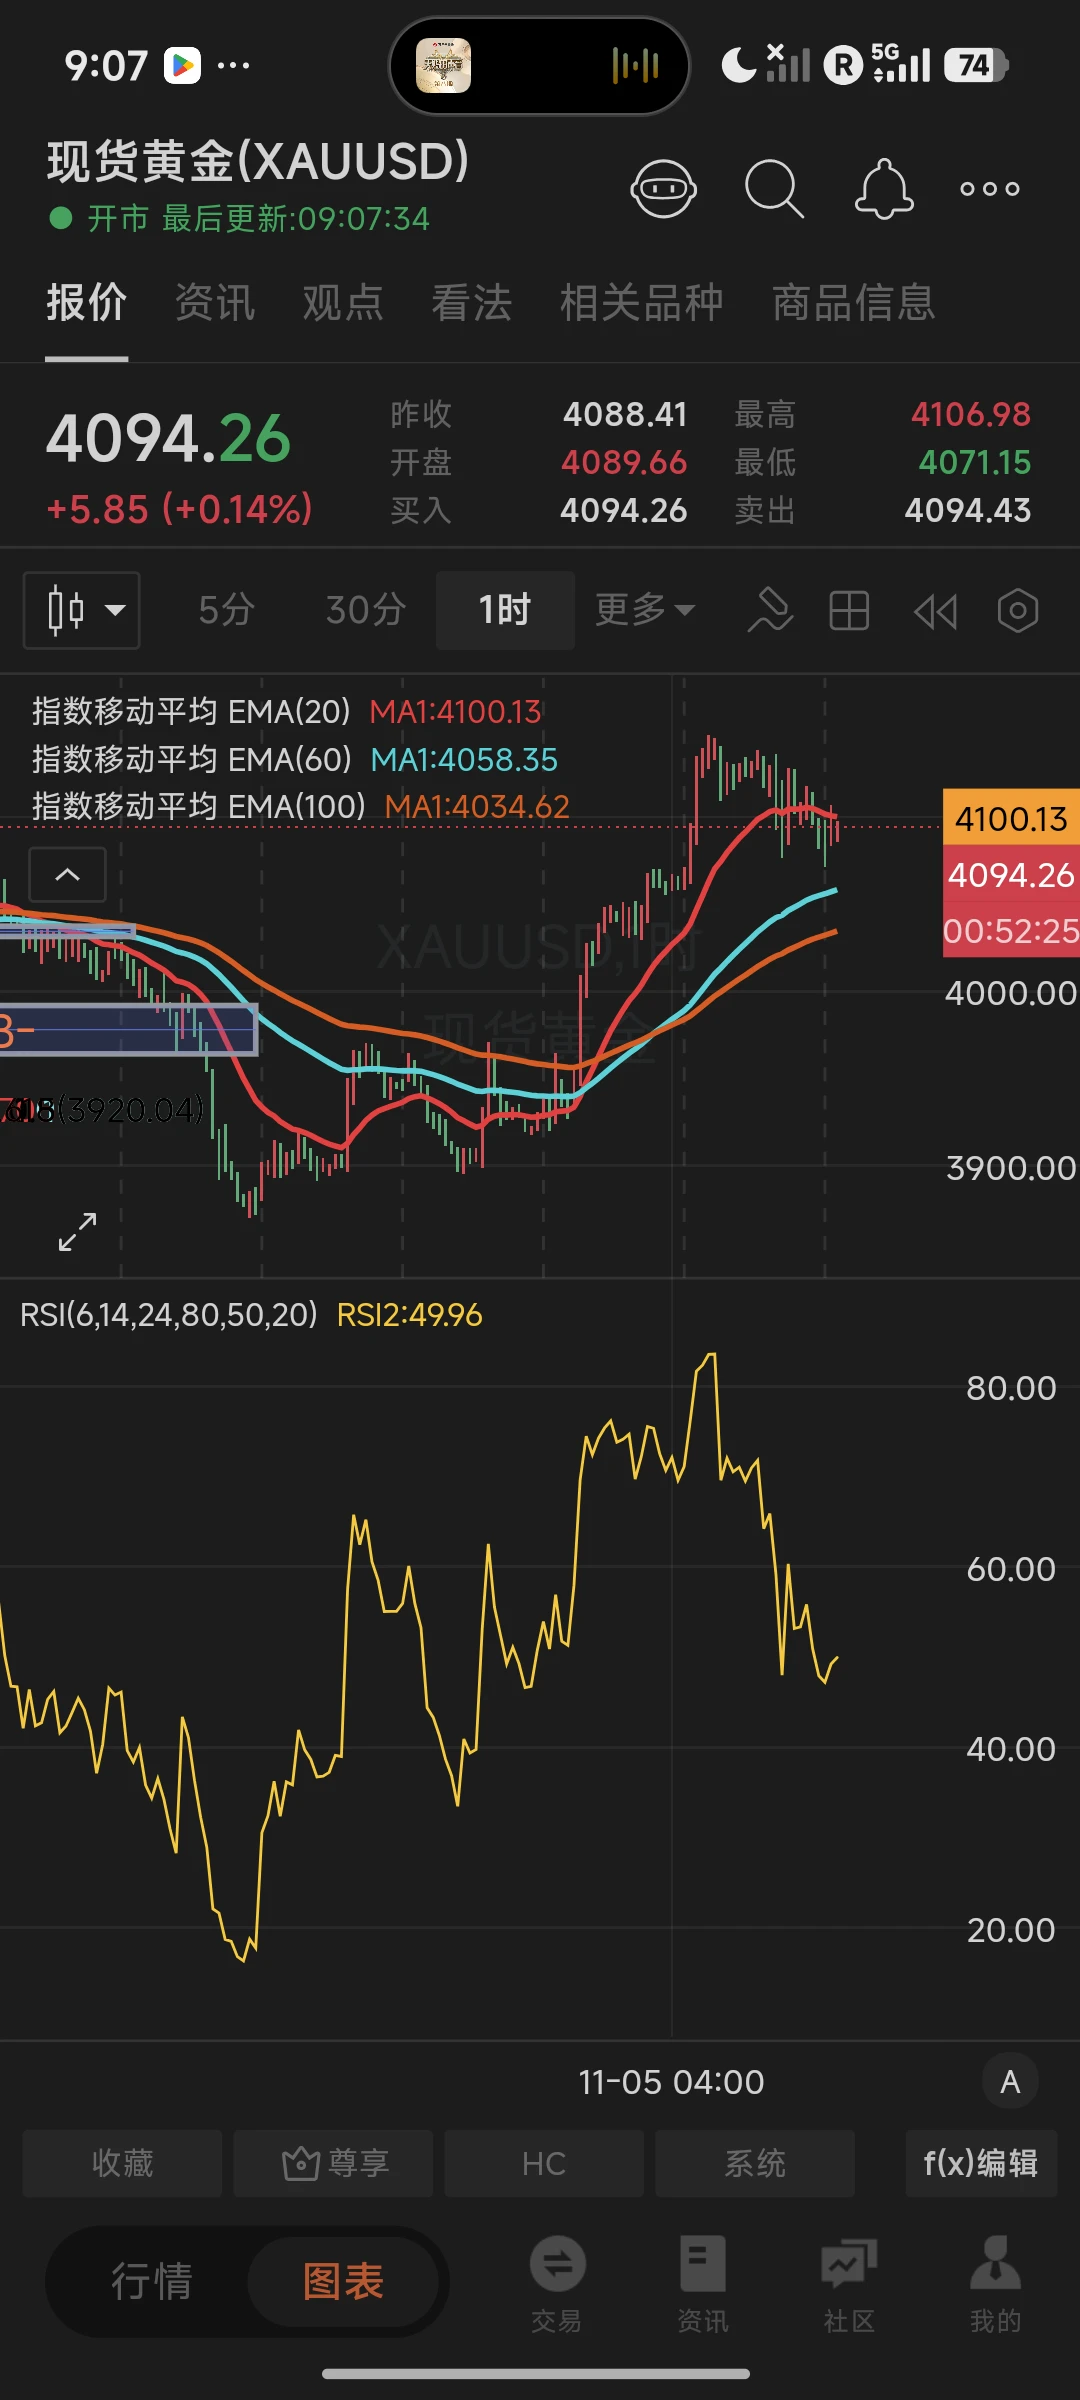
11.5 XAUUSD Asian-European Session Outlook$XAUUSD

Yesterday, the daily chart price was rejected near the resistance at 4143. Today, watch for a retest of this resistance during the day session. The next lower resistance is around 4126.

Resistance above: around 4126 (1h), around 4142 (4h, 1day), around 4178.6 (1day), 4420-4238 (1day)

Support below: 4064-4070 (4h), 4000-4014 (4h), 3966-3970 (1day)
post-image
XAUUSD-0.77%
  • 1
Load More

Join 40 M users in our growing community

⚡️ Join 40 M users in the crypto craze discussion

💬 Engage with your favorite top creators

👍 See what interests you

Trending Topics

USStocksFaceHistoricSelloff

60.36k Views3.41k Discussing

U.S. stocks suffered a sharp selloff on Thursday, with the Nasdaq closing down more than 5% and the Philadelphia Semiconductor Index falling over 12%. AI and chip stocks including $NVDA and $AMD were hit especially hard. Markets are reassessing AI valuations, data-center spending and future returns. Is this just short-term deleveraging, or the start of a deeper correction in the AI trade? Which sectors are you watching next?

GateLaunchesPoSECProofOfSecurity

10.49k Views556 Discussing

USNonfarmPayrolls

8.23k Views3.95k Discussing

View More