Square
Following
Hot
News
Notifications
Profile
Share your thoughts
placeholder
Article
0.2680 got slammed down to 0.2022, all in one day, then climbed back to 0.2496. $MAGMA swung 30 points, with 21.2M in volume.

First, look at the structure. This didn’t happen on its own; something from outside is driving it. Last night, the dollar and oil moved together, risk assets wobbled along with them, and the high-volatility names in crypto reacted first. $MAGMA is the kind of market where trading value is just over 20 million, and one round trip by large funds is enough to carve out this range. The transmission is easy to understand: when macro conditions loosen or tighten, the effec
MAGMA-0.57%
  • 1
$MMT Short setup: After a sharp rejection from the top following a parabolic rally to 0.30, the price plunged -19.87%. The sell-off is fierce, and sellers have taken full control of the market. Numerous red candles have appeared on the chart as the price falls rapidly and support levels break one after another. Short plan • Entry: 0.2100 – 0.2160 (current breakdown range) • Take-profit 1: 0.1950 • Take-profit 2: 0.1800 • Take-profit 3: 0.1650 • Stop-loss: 0.2300 Why short? • A classic pump-and-dump pattern; the top has already formed. • Momentum has completely turned bearish after the rejecti
post-image
MMT-2.35%
Trenches
IDOL
I
bade
b
IDOL
0x3b...ab07
Market Cap
$.
Change
.
24h Vol
$.
Holders
.
JAGENT
J
bade
b
JAGENT
0x8e...ae15
Market Cap
$.
Change
.
24h Vol
$.
Holders
.
PIEVERSE
P
bade
b
PIEVERSE
0x0e...25a9
Market Cap
$.
Change
.
24h Vol
$.
Holders
.
FIONA
F
bade
b
FIONA
B34n...pump
Market Cap
$.
Change
.
24h Vol
$.
Holders
.
CLAUDIA
C
bade
b
CLAUDIA
2j5S...W2ZM
Market Cap
$.
Change
.
24h Vol
$.
Holders
.
#If you had 10K USDT
Could you achieve financial freedom in the crypto market?
For example, if ETH goes from 1,500 to 8,888, my assets would increase ➕ severalfold.
Or add to my position with unrealized profits! The sky’s the limit!
Work hard to grow my capital! Scale up my position ❗️
post-image
  • 4
$AKE I got wrecked by this garbage coin again today
AKE+6.07%
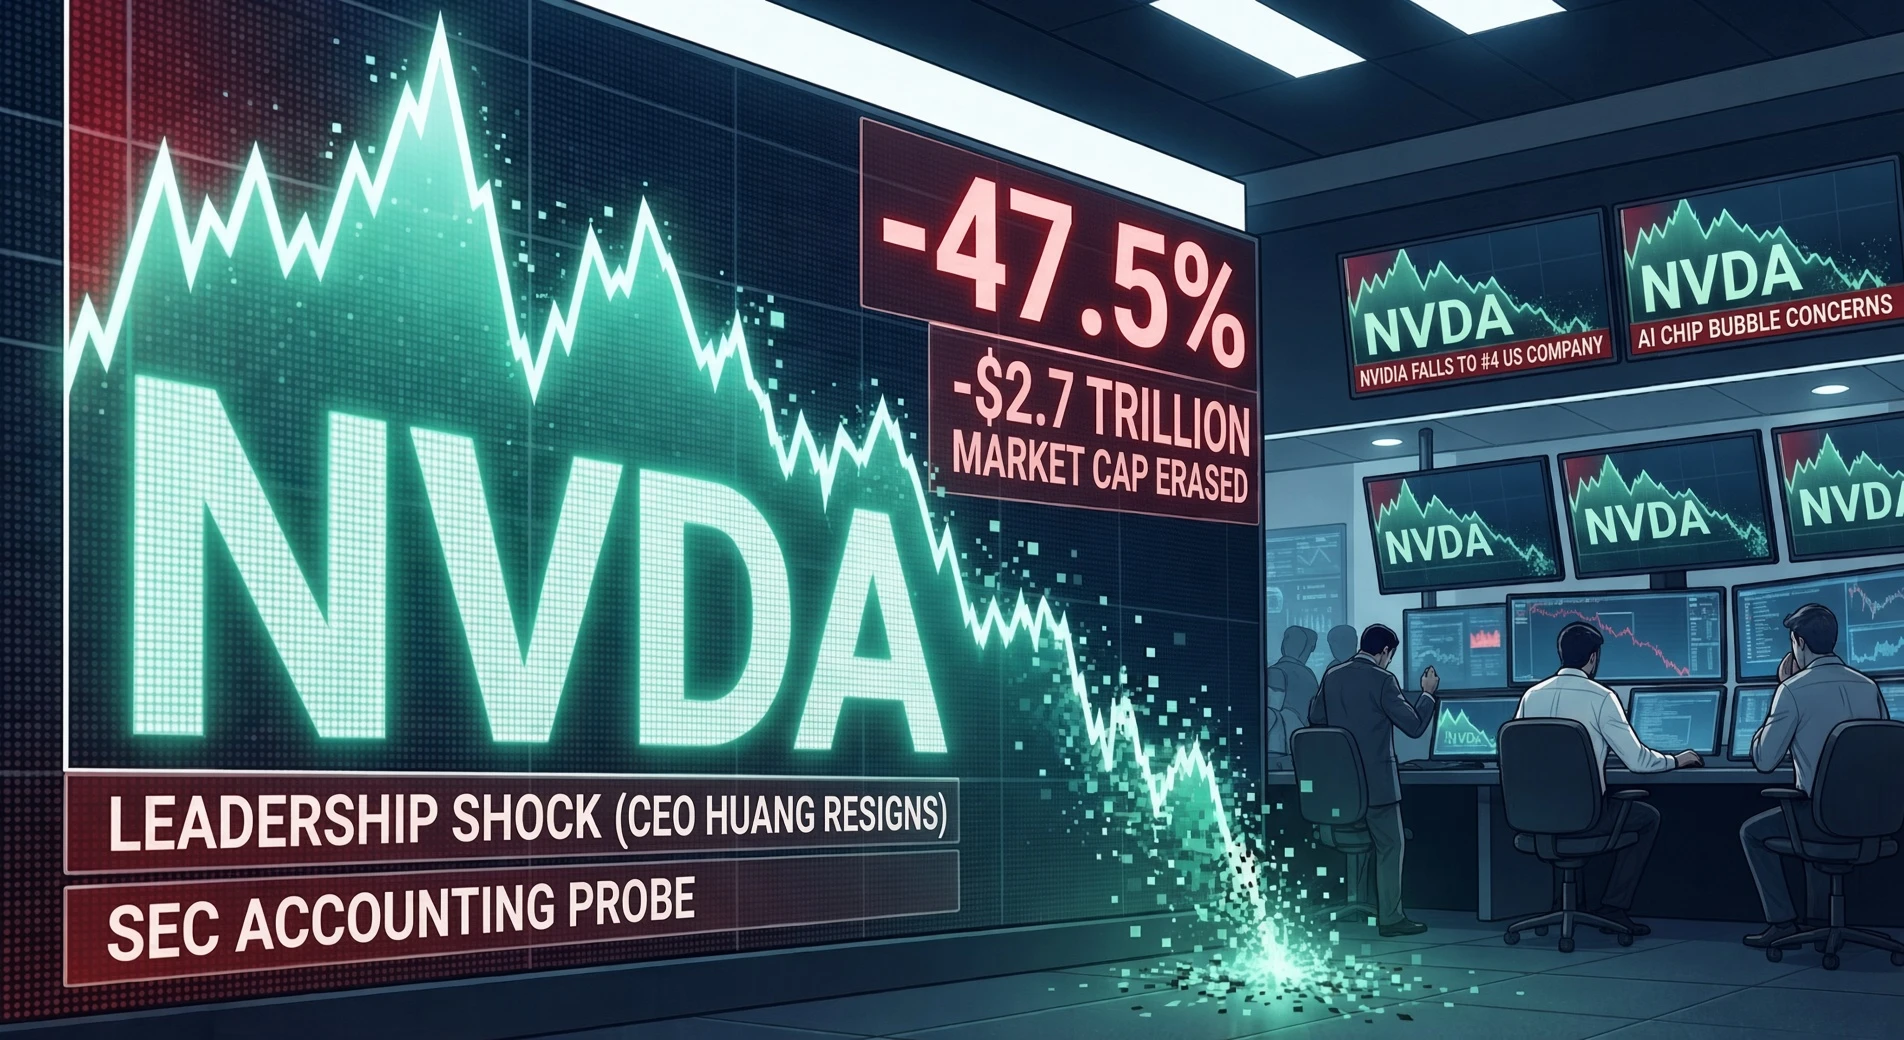
Historic Selloff: Nvidia Wipes Out $2.7 Trillion in 1.5 Months

Between its all-time high in early October 2026 and November 20, 2026, AI chip giant Nvidia (NVDA) lost roughly $2.7 trillion in market capitalization—erasing nearly 47% of its value (dropping from ~$5.77 trillion to ~$3.0 trillion) and marking its longest weekly losing streak since the 2008 financial crisis.

3 Key Drivers Behind the Rout:

- Leadership Shock: Co-founder and CEO Jensen Huang abruptly resigned in mid-November following personal scandals involving ties to a businesswoman suspected of intelligence links and U.S. exp
post-image
NVDAG-0.24%
$NVDA

$2.7 trillion wiped out in 1.5 months

Nvidia's plunge has everyone stunned

Is the AI myth really about to crumble this time?

Holy shit

Guys

Wall Street is really going hard this time

Nvidia, once riding high

In just a month and a half

Has seen about $2.7 trillion wiped off its market cap

What the hell does that mean?

$2.7 trillion

And that's in U.S. dollars

The market cap it lost is a number many publicly traded companies will never reach in their entire existence

In early October

Nvidia's market cap briefly approached $5.8 trillion

The market was practically treating it
post-image
NVDA-0.35%
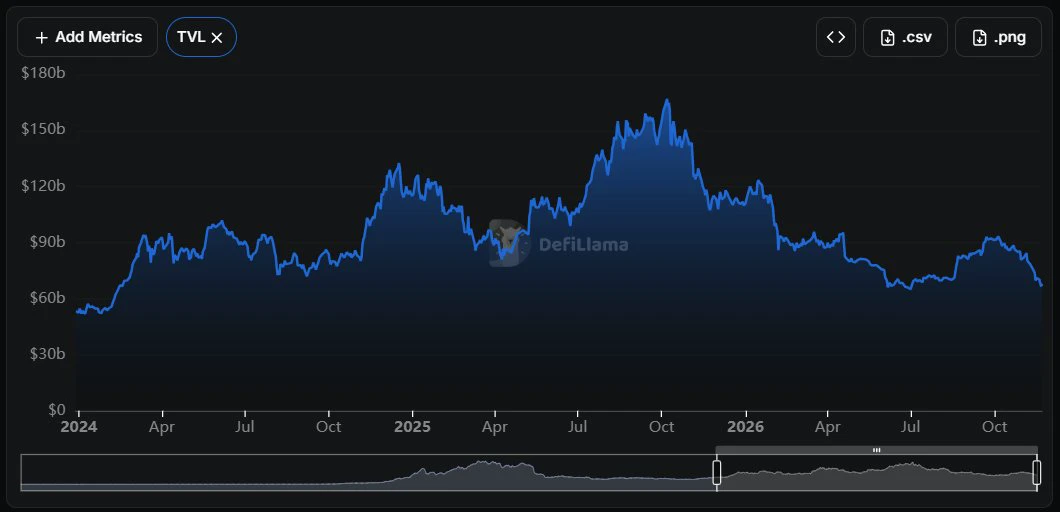
nearly $100B wiped out from DeFi TVL
down from $166B to $67B in just over a year
post-image
📈Nov 22 Midday Market Outlook📈

$ETH 思路:

ETH broke above 1680 on volume; chase longs on the right side and tighten the stop loss.

ETH broke below 1661 on volume; chase shorts on the right side and keep a stop loss in place.

If a pullback to 1600 confirms support, add one lot long; stop out if it falls below 1559.

If ETH holds above 1680 on the hourly timeframe, look for 1725-1768.

Watch 1725 overhead for a one-lot short; stop out if it breaks above 1768.

Left-side wick order: long at 1536, stop out if it falls below 1481.

Resistance above: 1680-1725-1768
Support below: 1661-16
ETH-1.23%
morning market updates
live-cover
LIVE2,977
SOL-0.77%
BTC-0.67%
ETH-1.26%
USDC+0.01%
XRP-1.15%
$IDOL It plunged from 0.0480 to 0.0164 in one day, falling nearly 30%, with a trading value of 480 million. This kind of price action is completely different from a coin that slowly bleeds lower.
First, look at the size and pace of the drop. $IDOL happened entirely in a single day, like slamming on the brakes; with a slow bleed, the price drops a little every day, wearing you down. They hurt in different ways: the first hurts in the moment, while the second tests your patience.
Next, look at trading activity. Nearly 500 million in trading value in a single day means tokens are changing hands
IDOL-6.71%
  • 1
  • 2
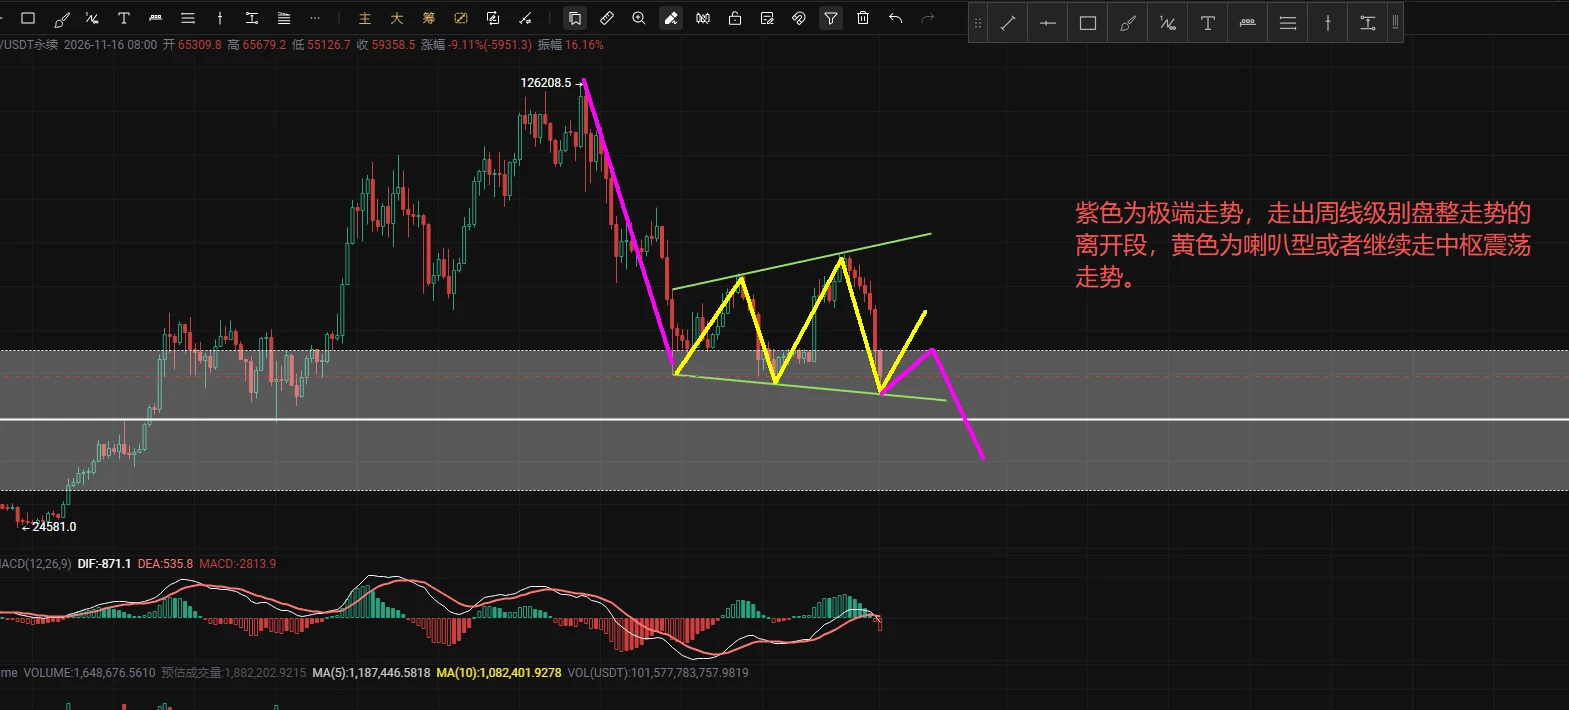
BTC’s key weekly level has arrived! Can 55000 hold?
After pulling back from its high, Bitcoin found support near 55000 on the weekly chart and formed a bullish rebound candle. Is this a technical bounce during a decline, or a trend reversal? For now, I’m leaning toward the former. The price has now fallen below the lower boundary of the range at 59800.
If it still can’t reclaim 59800 and hold above 65300 next week, the probability of a further drop toward 49500 will rise significantly.
On the daily chart: A high-volume bullish candle appeared at 55000, showing that some capital is buying the d
post-image
BTC-0.65%
The World's Largest Hedge Fund Is Playing It Safe:
Inside Bridgewater’s Defensive Strategy
Ray Dalio’s Bridgewater Fund, the biggest hedge fund in the world, is sending a clear message to the market with a massive 11.29% allocation to SPY (S&P 500 ETF) and 5.02% to IVV (iShares Core S&P 500 ETF), showing a heavy reliance on broad market stability rather than risky stock picking. This "All-Weather" approach indicates that the smartest money is expecting choppy waters ahead and is prioritizing capital preservation by essentially owning the entire US stock market, while keeping a small hedge in
post-image
IVV-3.91%
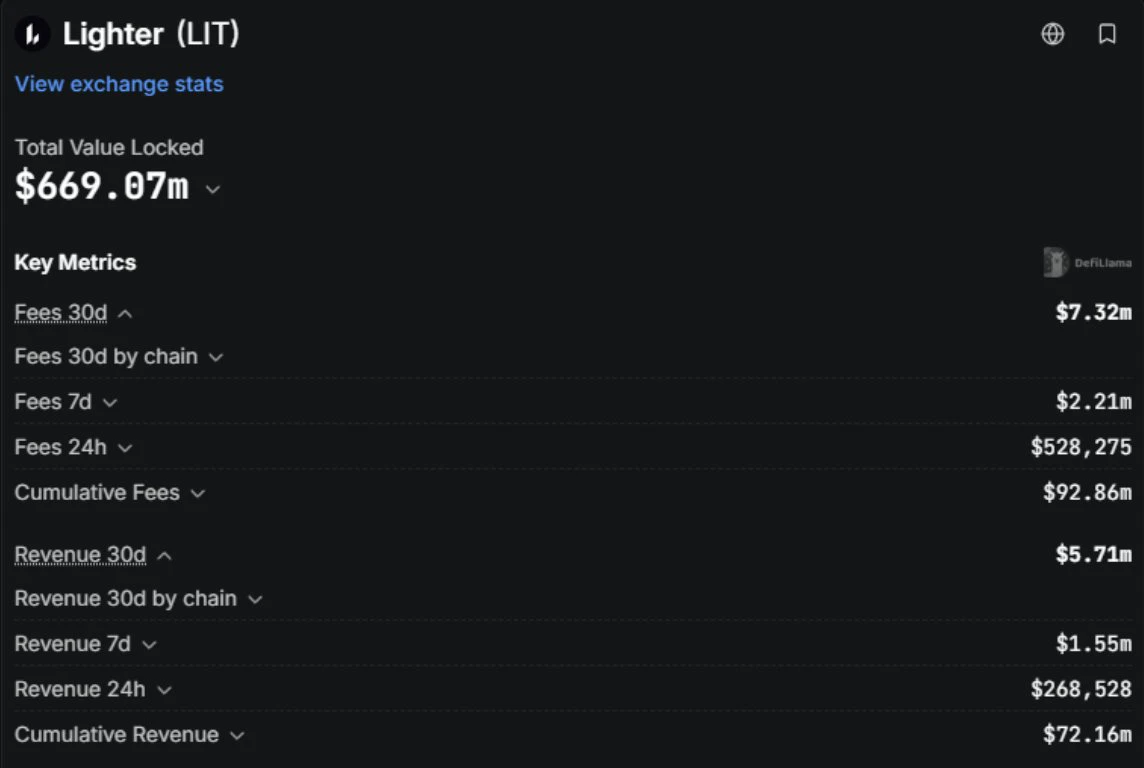
🐋 WHALE WATCH : Lighter made $1.55M in revenue last week. Insiders unlock $7.6M worth of $LIT in the same window.
500M tokens sit with the team and investors vesting over 36 months at 3.19M tokens per week. Buybacks come out of revenue. Revenue covers one dollar for every five that unlocks.
The math doesnt work until revenue grows 5x. Watch the cliff.
post-image
LIT-4.56%
$ICP The downtrend is accelerating! Bears remain firmly in control. Strong short-selling strategy: Entry: $1.865–$1.890 Take-profit 1: $1.820 Take-profit 2: $1.750 Take-profit 3: $1.680 Stop-loss: $1.950 ICP continues to form lower highs and lower lows on the daily chart. Selling pressure is intensifying as the price approaches a new low. A break below $1.864 could trigger another sharp decline. Sell and trade $ICP
post-image
ICP-1.14%
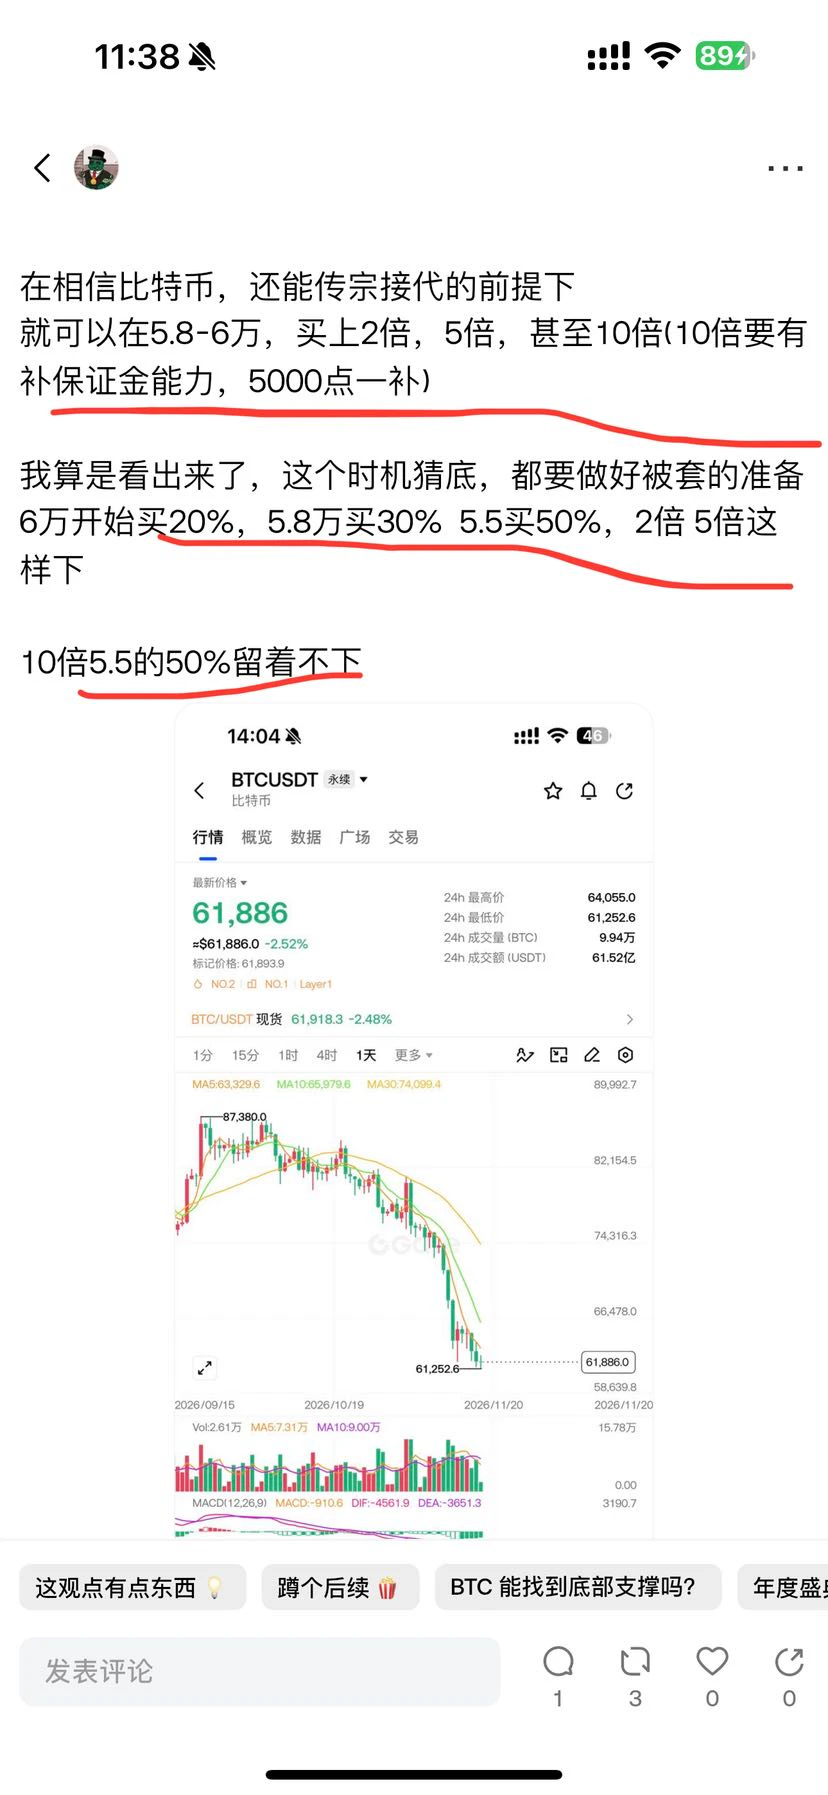
At 62k, I knew this shit was going to break below 60k

Sanpao went long on a dip buy at 60k with 20%
When it dropped to 58k, buy another 30%; the average entry price was already 58k, nearly 59k,

This time, the dip buy finally broke even and turned a profit. I just missed adding at 55k; otherwise, I would’ve made at least 2,000 points

Now I’ll be blunt: take the small profit on this trade and get out
I can’t keep holding. Bitcoin hasn’t bottomed yet; there are lower lows ahead

I don’t think my dip buy at 60k was actually the bottom. I can’t get trapped at 60k
Now there’s a chance to get out
post-image
BTC-0.67%
  • 1
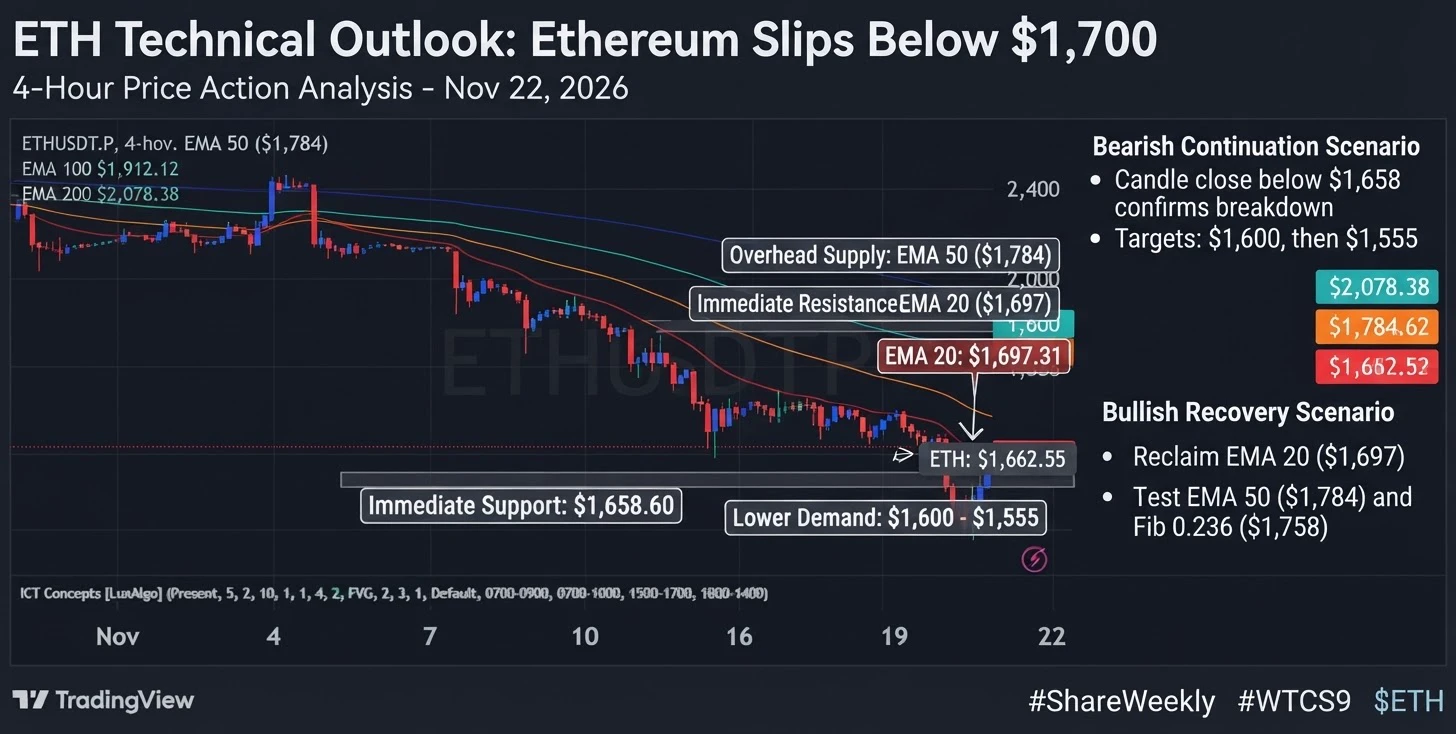
#ETHTechnicalOutlook : Ethereum Slips Toward $1,662 as Downward Momentum Continues
Ethereum is trading around $1,662.55 after extending its decline from the $2,400.00+ swing high region. The sustained breakdown on the 4-hour chart has kept market structure under heavy pressure, with ETH trading below all key short- and medium-term exponential moving averages. Price is currently hovering just above its 4-hour session low near $1,658.60, where buyers must step in quickly to prevent a deeper leg down.
Market Structure & Trend
ETH has lost several key horizontal support zones on its way down from
post-image
ETH-1.23%
📈11.22 Midday Market Outlook📈

$BTC 观点:

Personally, I don't think these weekend pumps and dumps reflect Bitcoin's true trend. We’ll have to see what happens on Monday.

$BTC Although it broke out of the price channel and moved back above 60k, it failed to break through 61,200, as indicated by the red arrow above.

It’s now consolidating between 61,200 and 59,800. As long as Bitcoin’s pullback holds above 59,800, there’s no real problem. If it breaks below 59,800, a second retest is coming; first, we’ll see whether 57,600 can hold.

That’s because 57,600 was a previous support
BTC-0.65%
🔹 Ethereum(ETH) Surpasses 1,700 USDT with a Narrowed 1.69 Decrease in 24 Hours
live-cover
LIVE2,266
BTC-0.65%
ETH-1.23%
SOL-0.74%
BTC-0.67%
SOL-0.77%
Hawk, get in now and hold for five years at $1 each. Screenshot this. If it doesn’t reach $1, I’ll livestream myself eating shit
post-image
Load More

Join 40 M users in our growing community

⚡️ Join 40 M users in the crypto craze discussion

💬 Engage with your favorite top creators

👍 See what interests you

Trending Topics

BTCReboundFaces60KTest

2.1M Views30.1K Discussing

BTC rebounded from around $55,300 on November 21, briefly reclaiming $60,000 before pulling back to around $59,300. The $60K level is back in focus as traders assess whether the recovery can last. Is this rebound a sign of stabilization or a short-lived recovery? Would reclaiming and holding $60K be enough, or do you need confirmation from trading volume and fund flows?

PCEAndGDPDataNextWeek

257.8K Views2.6K Discussing

GateDirectIPOPhase3ANTAllocates92100Shares

811.6K Views5K Discussing

View More