Square
Following
Hot
News
Notifications
Profile
Share your thoughts
placeholder
Article
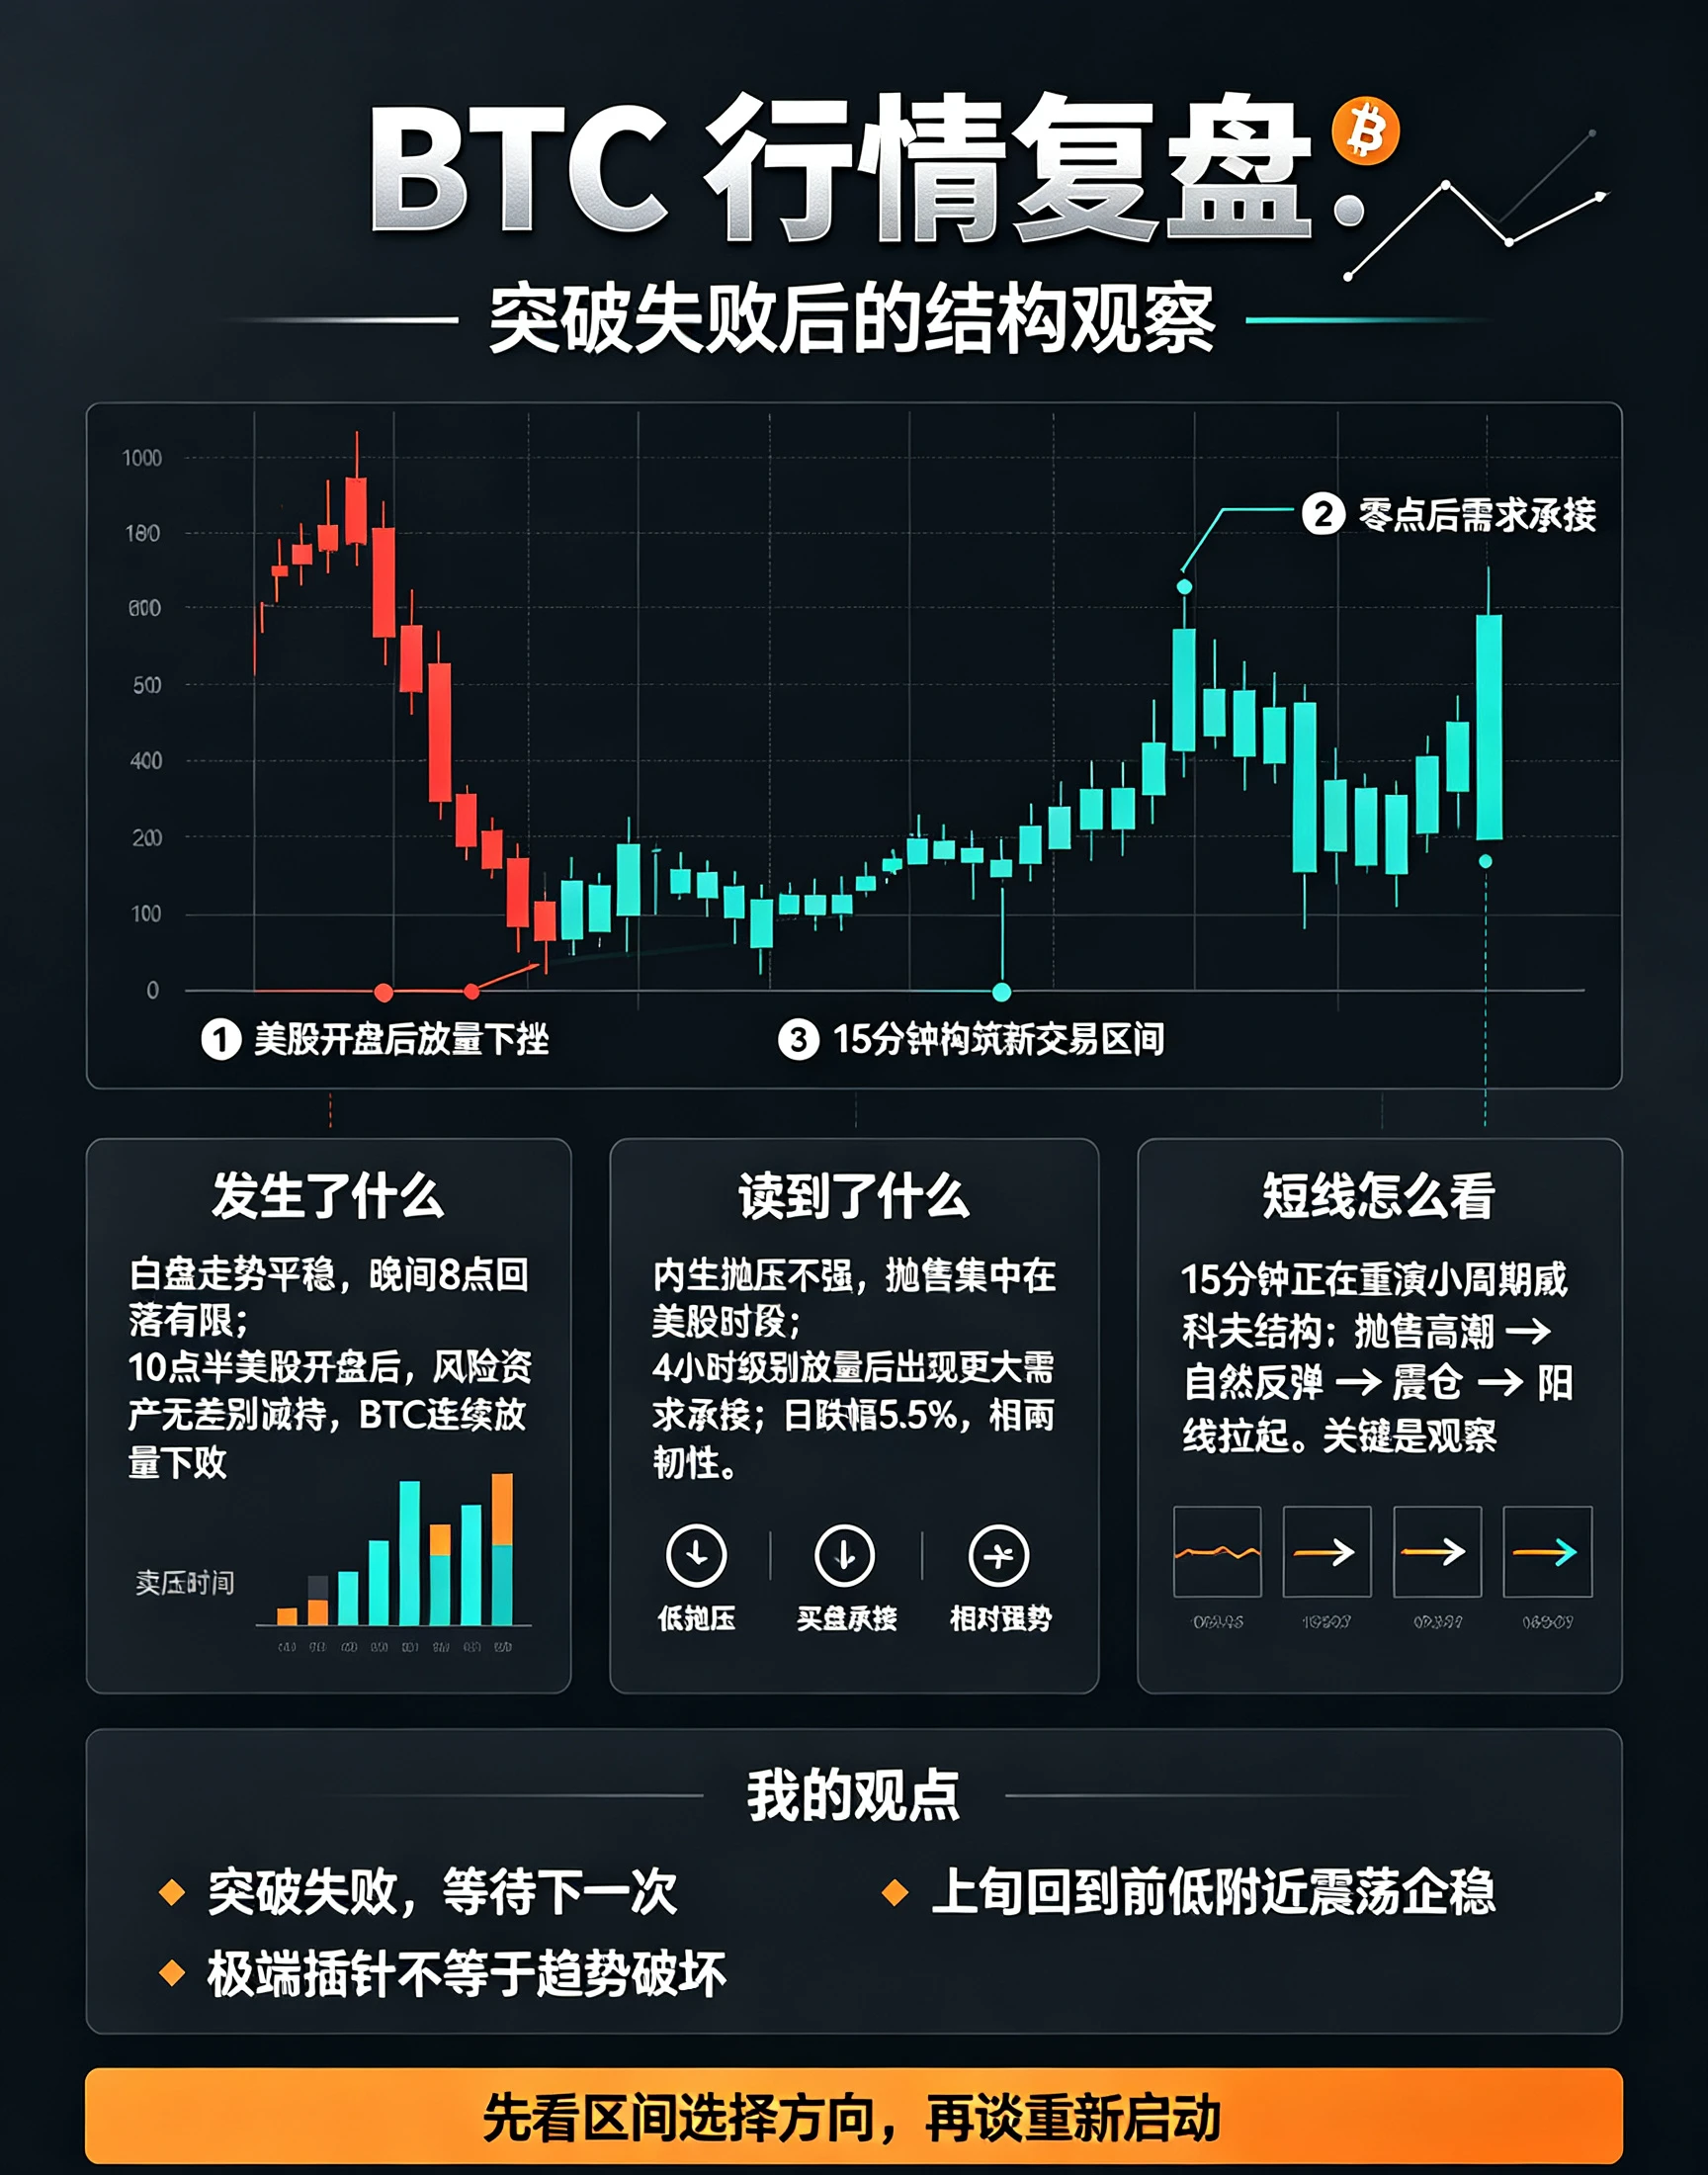
BTC traded steadily during the day yesterday, then saw a sharp pullback at 8 pm, though volume was limited. It was not until U.S. stocks opened at 10:30 pm that the market turned sharply lower, with successive high-volume declines and a concentrated wave of selling. The price fell through the two support levels previously anticipated, one after the other, signaling the failure of this breakout attempt.
The decline also sent several clear signals. First, endogenous selling pressure within crypto was not significant: the market was largely unaffected during non-U.S. trading hours, with selling c
post-image
BTC-0.65%
🔥 Don’t just scroll. Comment for a chance to win rewards
See a take that resonates? Add your thoughts. Disagree? Share your reasons.

🎁 The Gate Square Comment Challenge is on
🏆 Climb the ranks: Compete for Gate merch worth approximately 150 USDT, a 150 USDT Futures Position Voucher, and more
🎉 First-comment reward: Register and leave your first valid comment to receive a 10 USDT Futures Position Voucher
⭐ Standout replies: Each round, 3 users with outstanding comments receive 5 USDT each

💬 No minimum likes required. Thoughtful comments could win rewards.
📌 Today’s check-in: Leave at le
post-image
Gate_Square
🔥 Don’t just scroll. Comment for a chance to win rewards
See a take that resonates? Add your thoughts. Disagree? Share your reasons.

🎁 The Gate Square Comment Challenge is on
🏆 Climb the ranks: Compete for Gate merch worth approximately 150 USDT, a 150 USDT Futures Position Voucher, and more
🎉 First-comment reward: Register and leave your first valid comment to receive a 10 USDT Futures Position Voucher
⭐ Standout replies: Each round, 3 users with outstanding comments receive 5 USDT each

💬 No minimum likes required. Thoughtful comments could win rewards.
📌 Today’s check-in: Leave at least 1 valid comment on each of 3 different posts by other users.
👉 Register now and join the comments for a chance to win
https://www.gate.com/campaigns/6881
Write your own comments. One-Click Comments do not count toward campaign tasks or reward selection.
‍#GateSquare #CommentChallenge
repost-content-media
  • 4
Trenches
fxUSD
f
bade
b
fxUSD
0x08...d8f6
Market Cap
$.
Change
.
24h Vol
$.
Holders
.
ZIG
Z
bade
b
ZIG
0x8c...1145
Market Cap
$.
Change
.
24h Vol
$.
Holders
.
BTC
B
bade
b
BTC
C5xp...pump
Market Cap
$.
Change
.
24h Vol
$.
Holders
.
CORLA
C
bade
b
CORLA
0xba...7777
Market Cap
$.
Change
.
24h Vol
$.
Holders
.
STONK
S
bade
b
STONK
6GmA...UNgx
Market Cap
$.
Change
.
24h Vol
$.
Holders
.
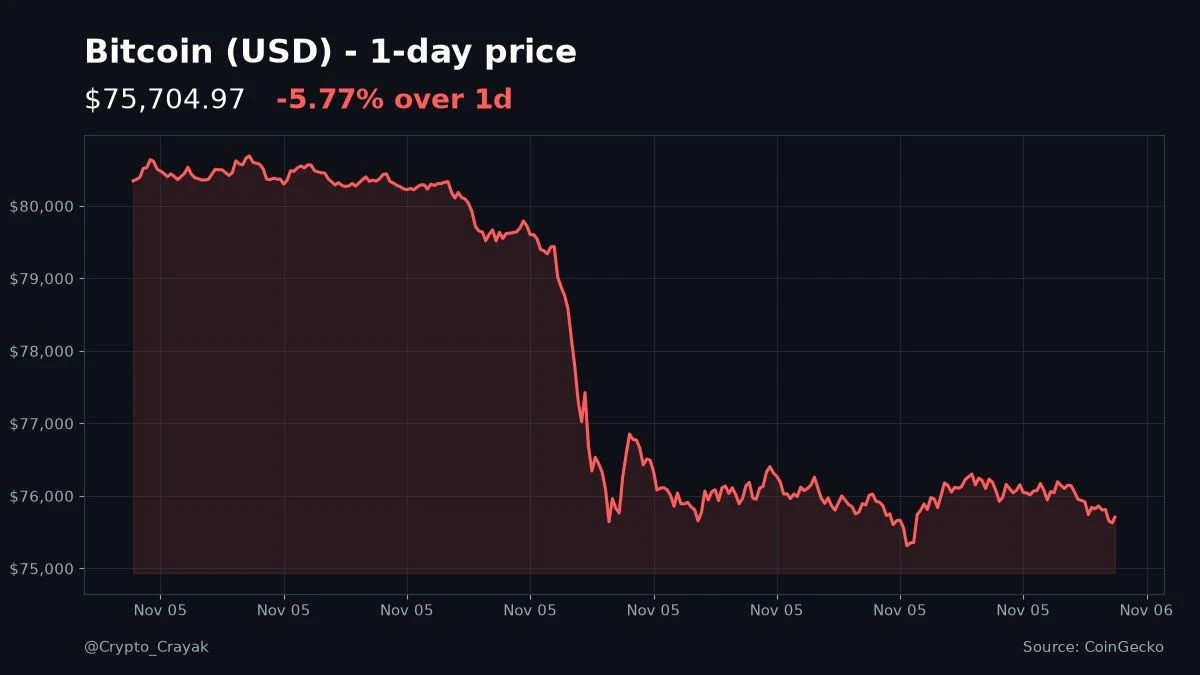
Bitcoin plunged nearly 6,000 points in a one-way move from a high of 81196. The market has been extremely volatile, and both longs and shorts can get trapped if they let their guard down. Some chased longs near the top and are now over a thousand points underwater; others blindly bought the dip after the crash, only to get trapped halfway down after a second leg lower. And some chased shorts all the way to the floor, only to be caught by the rebound, leaving them stuck and unsure what to do.

Here are three key ways to manage trapped positions:
First, if you're deeply underwater on a long open
post-image
BTC-0.67%
  • 2
From Vision to Reality: Why Do Verifiable Milestones Matter More Than Grand Narratives?

In the Web3 world, there is never a shortage of grand visions.

Some envision global payment networks, others discuss digital identity and open finance, while still others hope to reconnect people and assets through blockchain.

But one question is worth considering:

When every project is talking about the future, what should ordinary users look at to decide whether a project is worth following over the long term?

The answer may not be how ambitious its vision is, but whether it can consistently turn tha
post-image
$AKE $AKE stages a strong rebound… the bulls have finally awakened. Long entry: 0.00385 – 0.00395 Take profit 1: 0.00430 Take profit 2: 0.00480 Take profit 3: 0.00550 Stop-loss: 0.00330 After a prolonged correction, AKE staged a strong rebound from the 0.001877 support level. Buyers are re-entering, but 0.0040 is the resistance level to break next. If upward momentum continues, we may see the price move toward 0.0048 – 0.0055. Let’s go, $AKE
post-image
AKE+6.07%
#AsiaPacificStocksPlunge

Asia-Pacific stock markets are facing significant selling pressure, creating fresh uncertainty among investors across the region. Major stock indexes are experiencing declines as traders carefully monitor global economic conditions, market sentiment, and the latest financial developments.

The recent market weakness highlights how connected global financial markets have become. When uncertainty increases in one major economy, its impact can quickly spread to other regions. Investors become more cautious, reduce risky positions, and look for s
#USTechSelloff. #USStocksFaceHistoricSelloff
Oracle Could Lead the Next AI Applications Rally
The US technology market is facing heavy selling pressure, but I believe the AI revolution is far from over. Instead, investors are changing their priorities. Previously, the focus was on AI chips, servers, and data centers. Now investors want to see real revenue, sustainable profits, and measurable returns from AI investments.

My main focus is Oracle (ORCL) because its cloud infrastructure, enterprise software, and database technology could position it strongly in the next stage of AI adoption.
1.
  • 2
  • 2
Fear & Greed just faceplanted from 50 straight down to 28. Whole market's still hovering near $2.58T after that dump. Mood flipped faster than the candles did, if I'm honest. You buying this fear or waiting it out? #crypto
post-image
#AsiaPacificStocksPlunge 🔬

Is the sea of red in Asia merely profit-taking?

Those fixated on the massive red percentages flashing across their screens during the historic collapse of Asian markets are missing the true paradox: the very companies that ignited the artificial intelligence revolution are now buckling under the political uncertainty of the future they themselves created.

The wave of selling triggered in global markets following the U.S. midterm elections has swept across the Pacific, striking the heart of Asia’s technology sector with the force of a bombshell. In South Korea, th
post-image
User_any
Don’t let the numbers mislead you; those figures don’t point to a market collapse, but rather to an entirely different structural mechanism.

The real story lies within a historic wave of selling—triggered in the artificial intelligence and semiconductor sectors following the U.S. midterm elections—that rippled across the Pacific all the way to Seoul. What unfolded on Thursday, November 5, 2026, was more than just a correction; it was a watershed moment—a stress test for the AI trade, challenging both its valuations and the underlying policy landscape.

Just how severe was the sell-off on Wall Street?

The wave of selling that hit U.S. markets on Thursday marked the sharpest decline in recent years. The Nasdaq tumbled 5.52% to 24,315 points, falling 11.9% from its early-October peak and officially entering correction territory. The S&P 500 dropped 4.36%, while the Dow Jones slid 3.44%, shedding 1,833 points.

The devastation was most acute in the semiconductor sector. The semiconductor index plummeted 12.25% in a single day—its worst performance since March 2020. The stocks on your screen tell the story: Nvidia fell 9.33%, AMD 17.64%, Micron 17.23%, and SanDisk 22.24%, with various Asian ADRs also posting losses exceeding 10%. In total, approximately $2 trillion in market capitalization evaporated in just one day.

What was the hidden cause behind the sell-off?

There isn’t a single reason, but the midterm elections served as the primary catalyst. The Democrats gaining the upper hand in Congress has raised questions among investors as to whether regulations concerning the construction of data centers might become more stringent.

The market has begun to price in the possibility that the development of data centers—the backbone of the artificial intelligence revolution—could slow down due to new energy and environmental regulations. Signals from newly elected officials in states like Texas, Georgia, and Ohio, suggesting potential restrictions on data centers, have further fueled these concerns. According to one analysis, approximately 30% of the projected data center capacity in the United States through 2028 is now at risk due to potential construction delays.

Compounding this, a chip manufacturer’s announcement of a 26% decline in sales for its mobile phone chips has led the market to wonder: is spending on artificial intelligence beginning to cool off?

How did the shockwave from across the Pacific hit Seoul?

The turmoil on Wall Street spread to South Korea the moment its markets opened. The KOSPI index plummeted by more than 8%, falling below the 5,000-point mark and triggering a circuit breaker just three minutes into the trading session.

Korean corporate giants were at the heart of this collapse: SK Hynix shares fell by as much as 11.71% to 1,116,000 won—a sharp reversal, considering the company had reported record-breaking quarterly sales just a week earlier. Samsung Electronics shares dropped 9.98% to 181,400 won. A similar trend emerged in Japan, where Tokyo Electron, SoftBank, and Advantest saw their values decline by 2.58%, 8.59%, and 5.07%, respectively. Because the stock markets in South Korea and Japan are heavily weighted toward the semiconductor sector, they tend to amplify any technology-related shock originating in the United States. What is the secret behind the "-38" figures on the screen?

The extreme figures—such as -38.65% and +38.64%—seen in the leveraged products in the image do not represent a market collapse; rather, they are the result of reverse splits and the structural nature of leveraged ETFs.

For a product designed to deliver triple the daily performance of an index, a 12% decline in the semiconductor index would mathematically result in a drop of approximately 36%. The 38% decline shown on the screen also reflects a price adjustment following a reverse split. Conversely, a product designed to move inversely to the index (betting on a decline) will rise as the index falls. However, because such funds tend to lose value consistently over the long term, they frequently undergo reverse splits. The +38% increase seen on the screen is actually a byproduct of the consolidation process intended to offset the fund's historical loss in value.

In short, these figures are "structural noise" inherent to the nature of leveraged ETFs; they do not reflect the actual performance of the underlying stocks.

Is this a buying opportunity or a new regime?

The market is currently caught between two opposing scenarios. On one side are those who argue that this is merely a temporary correction—a liquidation of overheated positions in the artificial intelligence sector. On the other side are those who believe that AI valuations remain detached from reality and that this is, therefore, not a buying opportunity.

One thing is certain: the market is no longer driven by the same narrative. The triad of valuation, policy, and liquidity is being recalibrated. It would not be surprising to see further macro shocks of this nature until regulations regarding data centers in the United States are clarified. What you should monitor is the distinction between technical price adjustments in leveraged products and the primary market trend; the extent to which the declines in Seoul and Tokyo are driven by regulatory uncertainty in the United States; and whether semiconductor companies—despite these policy-related headwinds—are managing to maintain their order backlogs.

This content is for informational purposes only and does not constitute investment advice.

$MU $AMD $SNDK $TSLA $INTC
#USStocksFaceHistoricSelloff
#GateSquareTradingChallenge #Gate股票畅聊季 #GateStockTalkSeason #ShareWeekly
repost-content-media
HK50-0.21%
JPN225+0.09%
NAS100+1.29%
US30-0.40%
  • 9
  • 1
Democrats win both chambers, $TRUMP plunges to near 1.169—I’m positioning
Down 19.672% in 24h! While major coins breathe a sigh of relief, $TRUMP is still taking its final hit—and I’m bullish at this level.

A Democratic sweep of both chambers was already priced in, and the broader market rose in response. Trump-related assets are the last to clear out: DJT fell as much as 7.2% pre-market, while $TRUMP plunged from 1.224 to 1.176 after the event, down 3.92%. When the outcome was confirmed, it was down just 7.6% over 24h; now it’s plunged 19.672% over 24h—the narrative premium is nearing the en
TRUMP-0.95%
UAI has had an unusual increase; I opened a short position because the price has already changed. This increase is a jump toward a deeper decline.
#WCTCS9
#SquareTradingExpert
$UAI
UAI-7.51%
  • 1
[trending Topic] Crypto Market Under Pressure BTC and ETH are falling with boarder risk assets
live-cover
LIVE1,378
How to Build a Complete Trading Plan: From Entry and Stop-Loss to Position Management, So Every Trade Follows a Clear Process

In the cryptocurrency market, some traders watch the market, study indicators, and look for opportunities every day, yet still struggle to develop consistent trading habits.

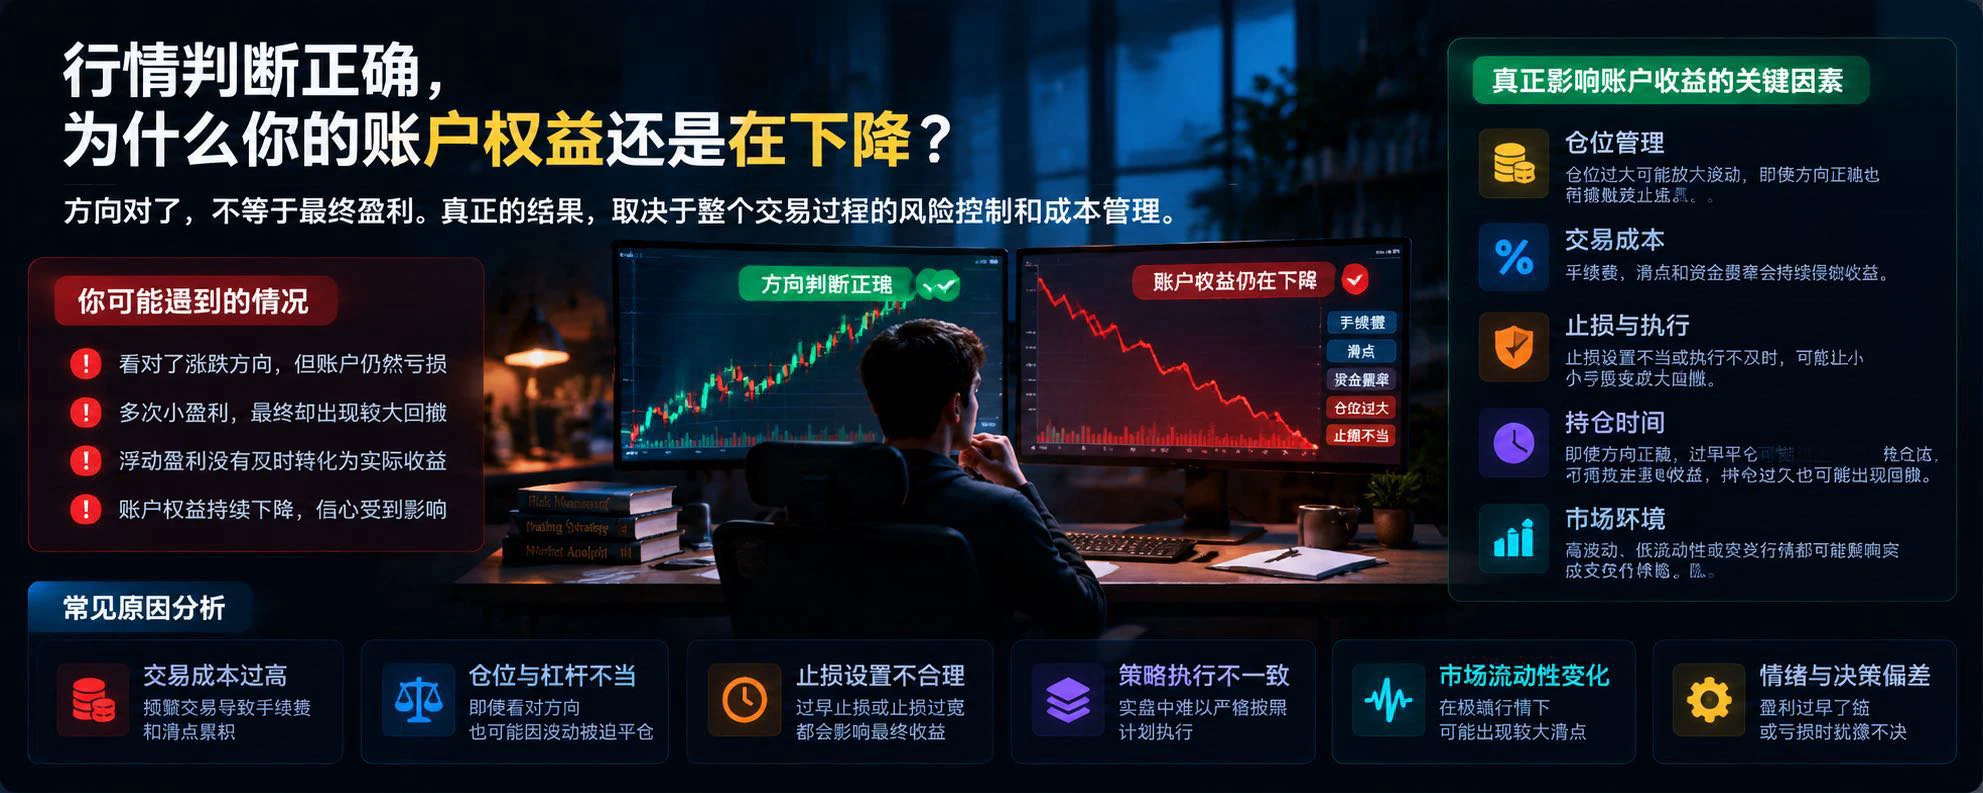
Sometimes, they get the direction right but exit early because their position is too large; sometimes, they can’t resist moving their stop-loss when the market moves slightly against them; and sometimes, after several consecutive losses, they start trading frequently, hoping to quickly make back w
𝗖𝗥𝗬𝗣𝗧𝗢 𝗕𝗟𝗘𝗘𝗗𝗦 𝗔𝗦 𝗥𝗜𝗦𝗞 𝗔𝗣𝗣𝗘𝗧𝗜𝗧𝗘 𝗙𝗔𝗗𝗘𝗦 🔻
The crypto market is under pressure as Bitcoin and Ethereum follow the broader risk-off move.

$BTC Around $76,200
$ETH Around $2,242

Bitcoin has dropped toward its lowest levels since September, while Ethereum has also suffered a sharp decline.

My approach is cautious:

- Avoid chasing falling prices.
- Watch important support zones.
- Wait for a confirmed recovery.
- Preserve capital during uncertainty.

Buying every dip is not a strategy. Sometimes staying on the sidelines is the smarter move.
#ShareWeekly
#CryptoMa
BTC-5.05%
ETH-7.19%
  • 6
  • 2
South Koreas KOSPI Plunges 8, Triggering a Trading Halt! Losses Narrow After Trading Resumes.
live-cover
LIVE2,562
📢 Reposted signal card | Source: Jotham Numb
$BCH Long trade incoming: Entry 261.49 / Stop-loss 253.8 / Target 322.94 Time: Not specified in the original post
By the way, I reposted this person's $ETHFI trade earlier today, and now they're back again. They're so diligent, even I feel outdone.😂
As always, I just repost the signals. Whether to follow and how much to put in is up to you to decide. The market can go crazy, but risk management mustn't.
Personal notes shared for reference only; this is not investment advice. #Must-read for beginners: Everything you need is here.
BCH+1.05%
ETHFI+1.48%
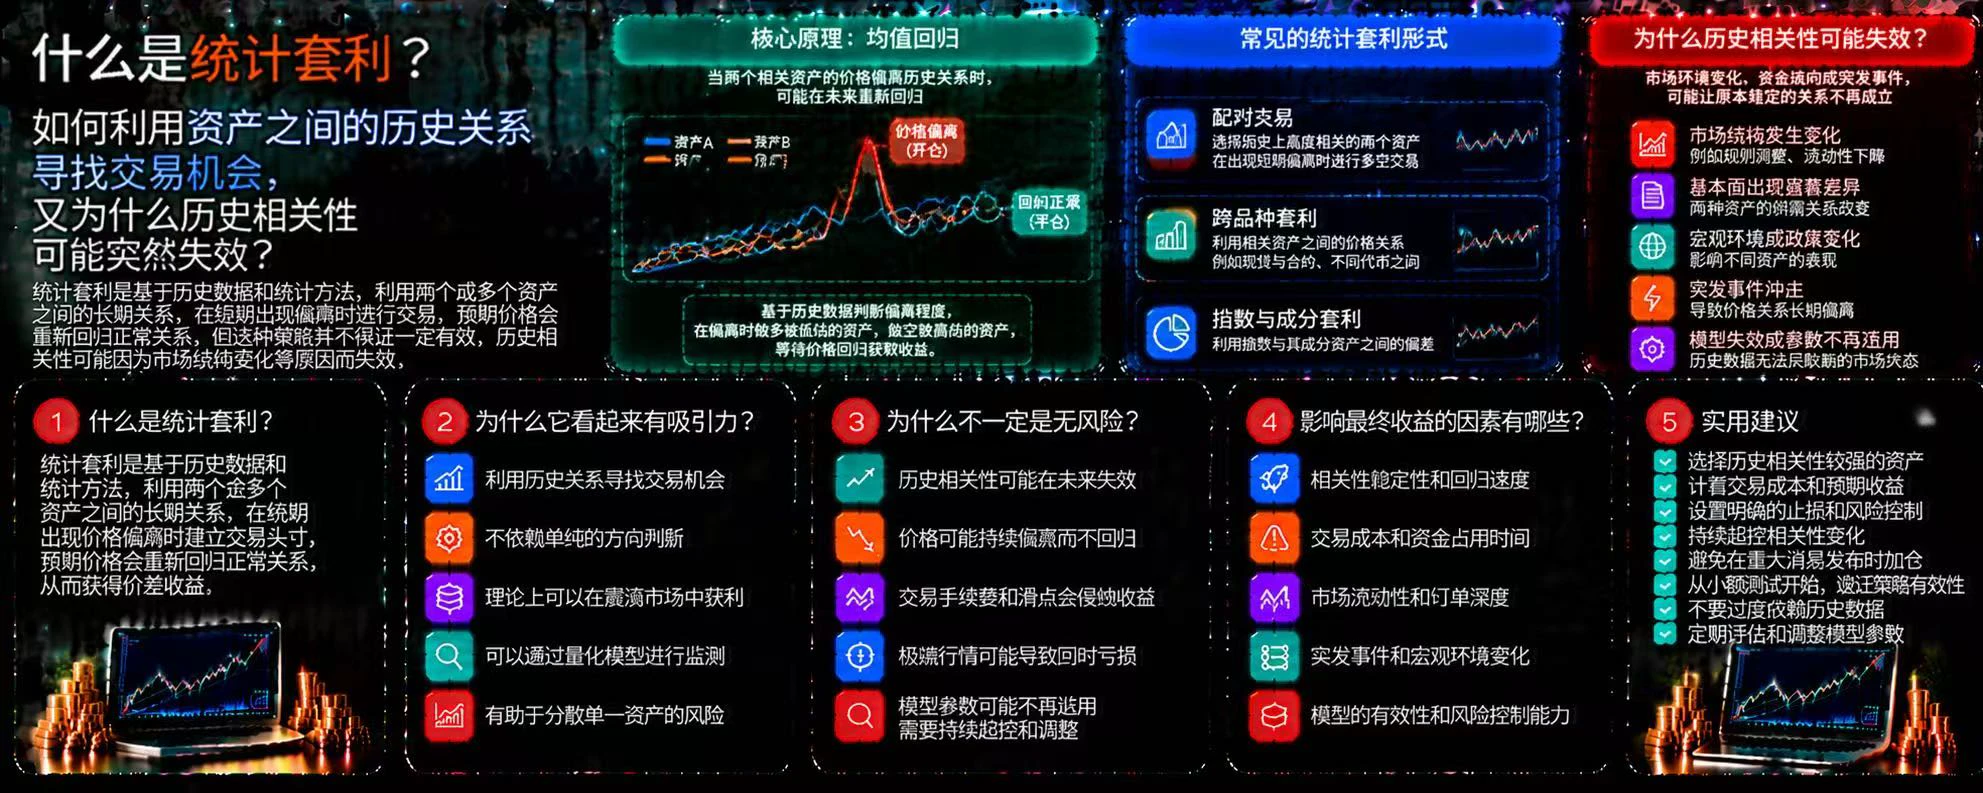
What Is Statistical Arbitrage? How Can Historical Relationships Between Assets Reveal Trading Opportunities, and Why Might Historical Correlations Suddenly Break Down?

In the crypto market, some assets have long displayed similar price movements. When their historical relationship temporarily deviates, traders may try to use that divergence to identify opportunities. This is the basic idea behind statistical arbitrage, but historical patterns are no guarantee of future repetition.

First, what is statistical arbitrage?

Statistical arbitrage is a type of trading strategy that uses historical
post-image
0.003826 wick recovered, $PUMP volume dries up at the bottom—I’m bullish
Absurd: $PUMP is surging on CoinGecko’s trending searches, yet the market is showing 24h -8.74%. It dumped on heavy volume early in the morning to 0.003826 and immediately recovered; current price is 0.003968. With trending-search traffic and its 30-day range position down to just 0.071, my answer is clear: bullish, buy the dip.

First, the volume ratio is 0.674, with trading volume below the 30-day average—the selling pressure has truly dried up. Second, the funding rate of 4.781e-05 is neutral, and OI is down 5.06%; lev
PUMP-1.06%
$MU I went to Hong Kong last weekend and successfully got a Hong Kong bank card from ZA Bank. Next time I go, I plan to get cards from Bank of China (Hong Kong) and Hang Seng as well. The process went very smoothly
MU-17.23%
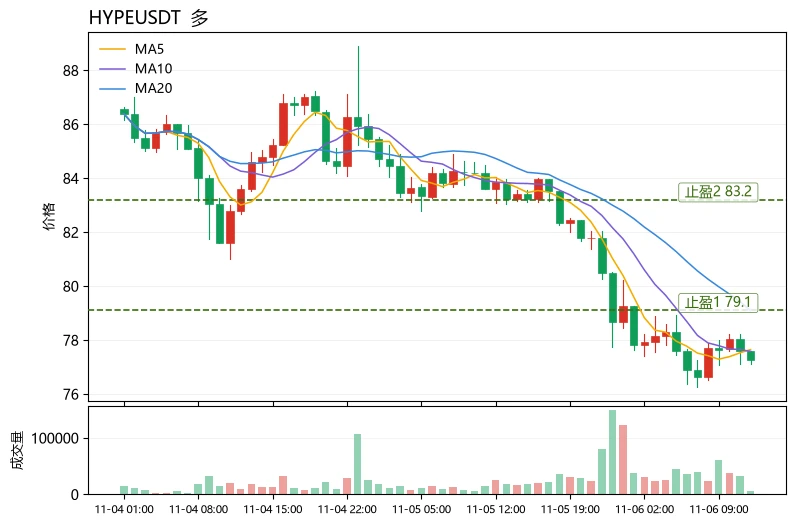
Many people see a 7% drop in 24h and rush to buy the dip, but overlook a key factor: when assets are both falling, the key to rebound potential is which one’s structure remains intact and whose buying demand is still there. Compared with others in the same sector, $HYPE fell 7.14%, making it more resilient than $BEAMX at -15.38% and $XRP at -7.97%. Its trading volume of 78.8M is also far higher than BEAMX’s 5.5M, giving it a clear liquidity advantage. Technically, $HYPE is currently at 77.24, below MA5=77.65 and MA20=79.09, but RSI=32.2 is nearing oversold territory, and the MACD histogram
post-image
HYPE+0.24%
BEAMX+5.82%
XRP-1.15%
Load More

Join 40 M users in our growing community

⚡️ Join 40 M users in the crypto craze discussion

💬 Engage with your favorite top creators

👍 See what interests you

Trending Topics

USStocksFaceHistoricSelloff

987 Views3.5k Discussing

U.S. stocks suffered a sharp selloff on Thursday, with the Nasdaq closing down more than 5% and the Philadelphia Semiconductor Index falling over 12%. AI and chip stocks including $NVDA and $AMD were hit especially hard. Markets are reassessing AI valuations, data-center spending and future returns. Is this just short-term deleveraging, or the start of a deeper correction in the AI trade? Which sectors are you watching next?

GateLaunchesPoSECProofOfSecurity

12.01k Views574 Discussing

USNonfarmPayrolls

9.34k Views4k Discussing

View More