Square
Following
Hot
News
Notifications
Profile
Share your thoughts
placeholder
Article
The crypto market doesn't sell coins; it sells hope.
Think about it: why would someone be willing to put their salary into a market that fluctuates nonstop, 24 hours a day?
Not because the candlesticks look good,
but because here, you can imagine turning 1,000 yuan into 1 million yuan.
This kind of imagination is almost nonexistent in real life.
Salaries are linear: work for a month, get paid for a month.
The crypto market is exponential: overnight, your money could multiply tenfold, or go to zero.
People don't love taking risks; they love the idea that "there's still a chance."
People who can
post-image
BTC-0.65%
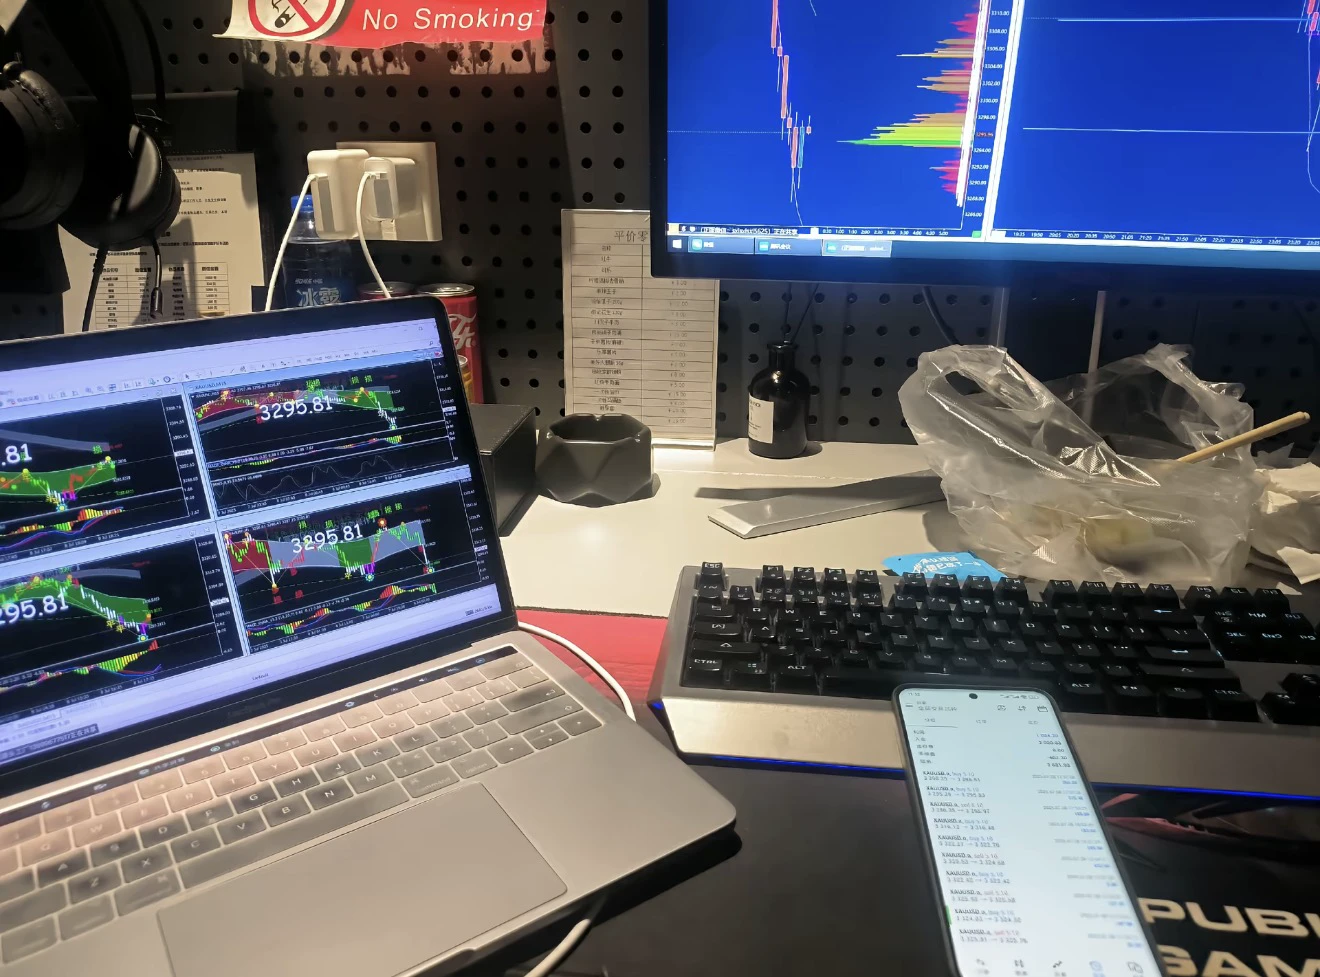
Everyone, the midday gold spot order has already taken profit. No need for all the twists and turns—you can feel how steady it is $XAUT #Gate全球合规版图扩展
XAUT+0.34%
Trenches
PIEVERSE
P
bade
b
PIEVERSE
0x0e...25a9
Market Cap
$.
Change
.
24h Vol
$.
Holders
.
牛逼
牛
bade
b
牛逼
0x96...7777
Market Cap
$.
Change
.
24h Vol
$.
Holders
.
STONK
S
bade
b
STONK
6GmA...UNgx
Market Cap
$.
Change
.
24h Vol
$.
Holders
.
ON
O
bade
b
ON
0x0e...1d48
Market Cap
$.
Change
.
24h Vol
$.
Holders
.
FLOAT
F
bade
b
FLOAT
Bv1a...BMmr
Market Cap
$.
Change
.
24h Vol
$.
Holders
.
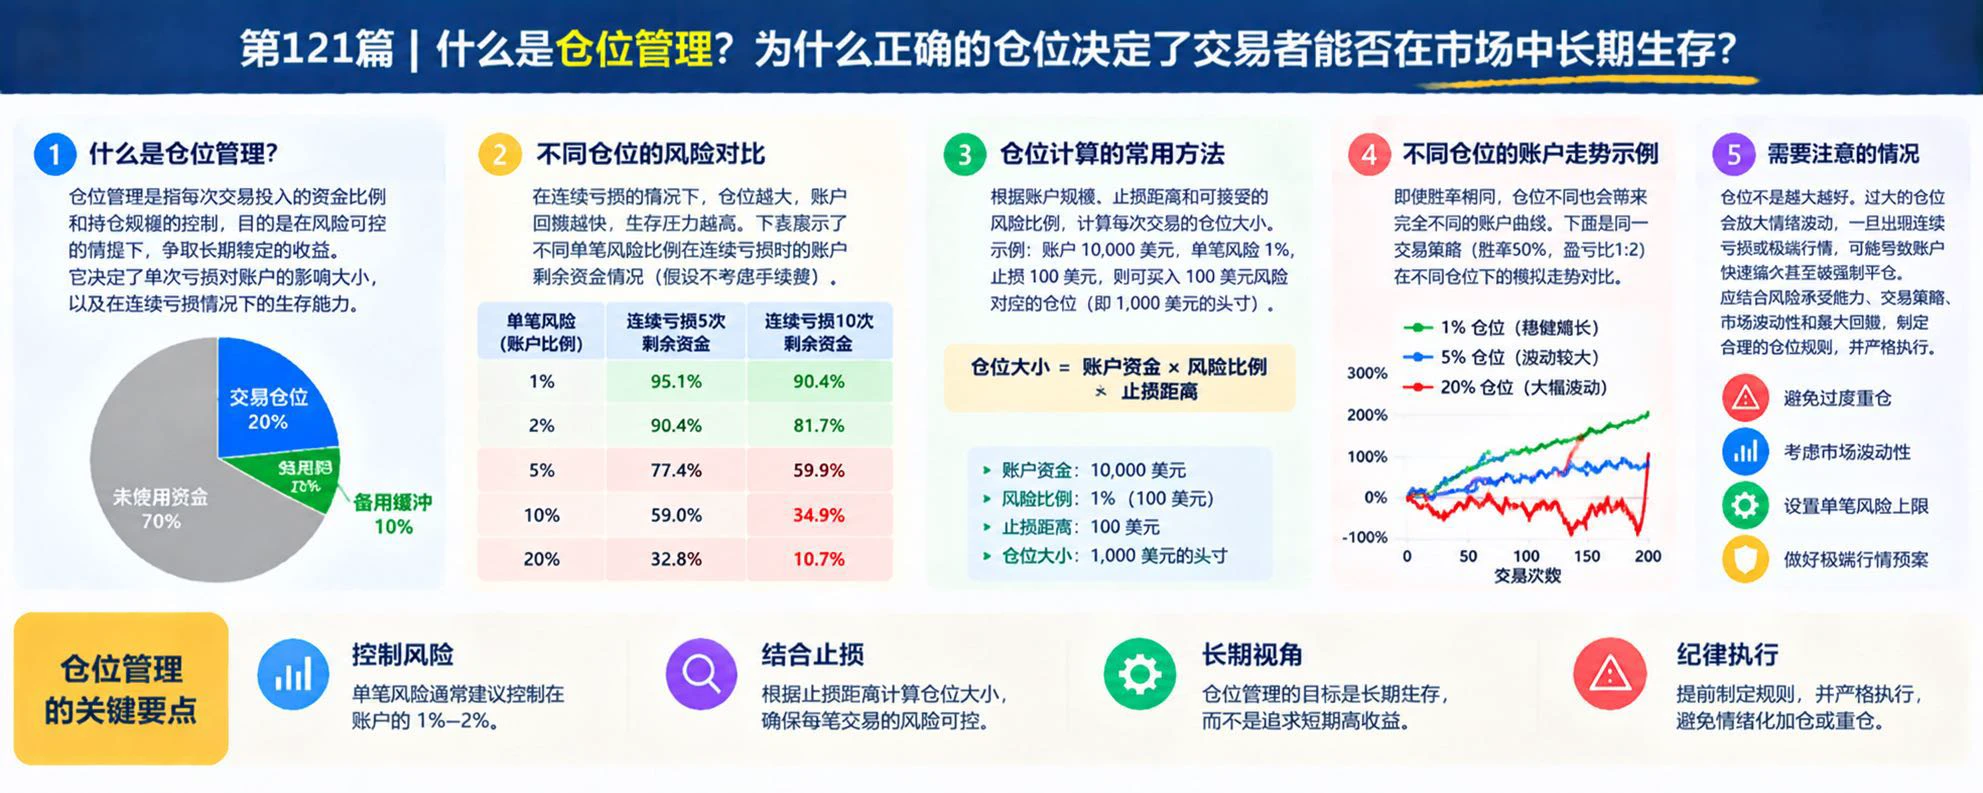
What is position sizing? Why does proper position sizing determine whether traders can survive in the market long term?

In cryptocurrency trading, even if your directional judgment is correct, an oversized position can still lead to severe losses due to short-term volatility. Position sizing is not simply deciding how much to buy; it means determining how much risk each trade should take based on your account balance, stop-loss distance, and acceptable loss.

First, what is position sizing?

Position sizing is a method for controlling the size of each trade, risk exposure, and overall account
post-image
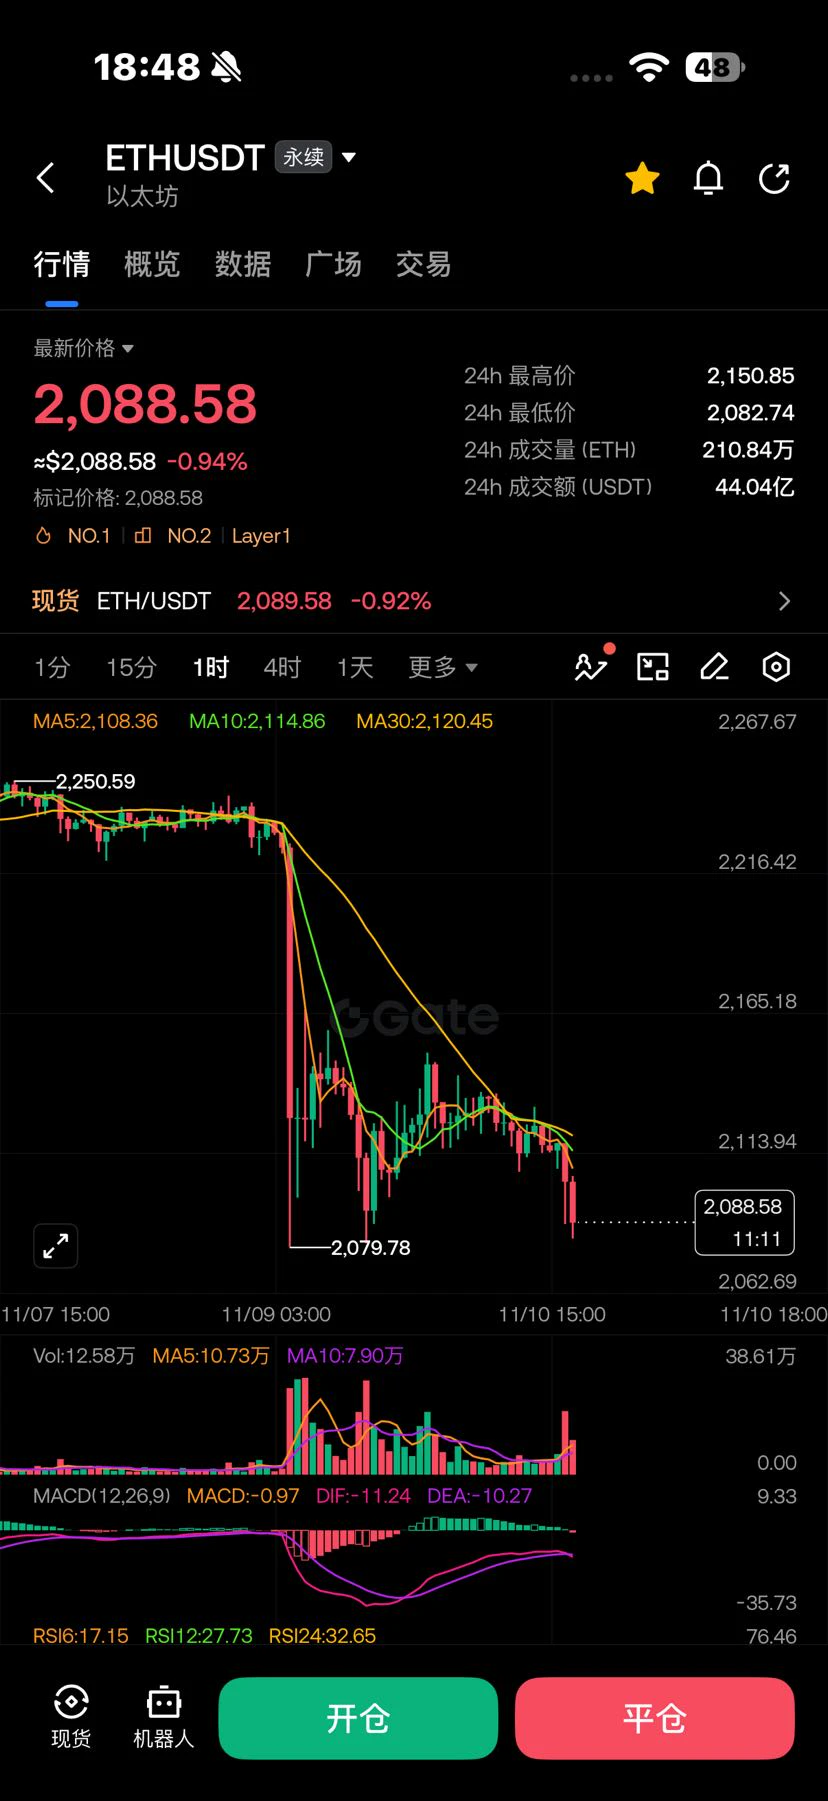
The crypto market has once again fallen to a daily low and is one step away from setting a new low. The bearish trend is strong. Even if tonight’s CPI data is favorable, crypto will not outperform U.S. tech stocks. If the data is unfavorable, there is a high probability that the market will break below the daily low and fall toward 2,000 points. Overall, the recommendation remains to go long U.S. stocks and short crypto as a hedge, or wait until after the news before entering. #Gate全球合规版图扩展
post-image
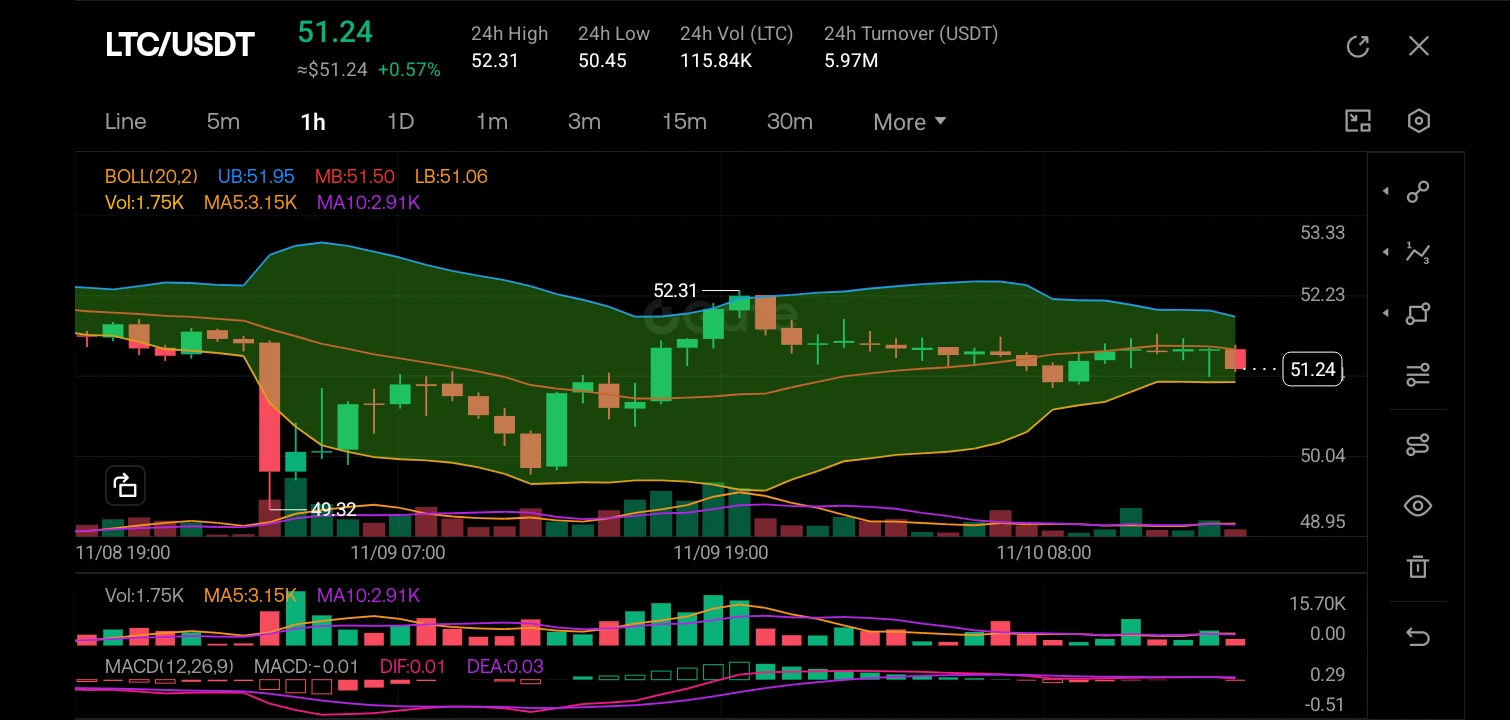
$LTC ‌
The market structure has transitioned from a sharp bearish breakdown to a steady bullish recovery and consolidation phase. After bottoming out at 49.32, the price has established a higher low structure and is currently compressing near the 51.24 level, indicating a shift in market control from sellers to buyers.

The K-lines show a strong upward impulse followed by a period of sideways consolidation. The price is currently trading right at the Middle Bollinger Band (MB) of 51.50, acting as immediate pivot support. The Bollinger Bands are relatively tight, suggesting low volatility and
post-image
LTC-0.07%
  • 1
🎉 Nov 9 Gate Nvidia Earnings Preview Official Livestream Giveaway Results Announced

Thank you all for participating in this livestream. Congratulations to the following lucky winners:
🎁 Gate Football
Rebirth: Dogecoin Riches
Summit Media Big Short
Big Villain Lili-chan

💰 $100 USDT Position Trial Voucher
Baohe Andy Lau
EB Ahui
Dingling Kualang

Rewards are expected to be distributed within 3 business days. Please check your account for the deposit!
🎁 Want to win more exclusive merchandise? Be sure to tune in to Gate Live for exciting livestreams, red packet giveaways, and surprise perks.
post-image
  • 9
  • 1
So strange. On the Yunnan metro, you can board in the middle and from both sides too.
post-image
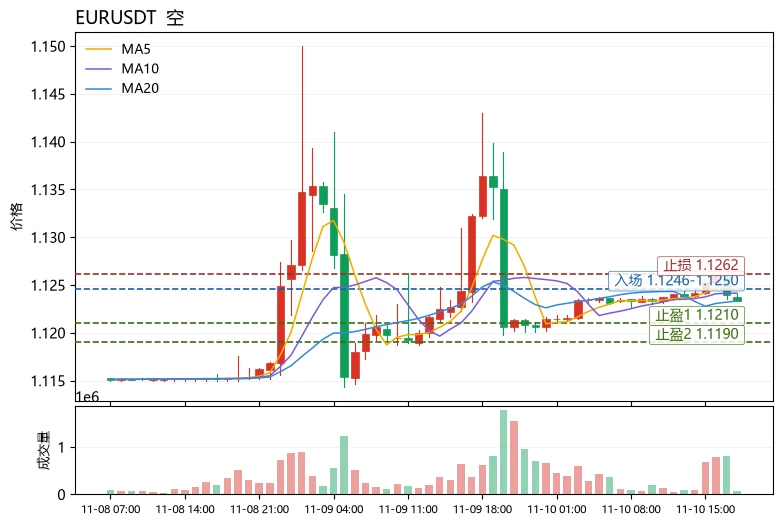
The most unusual detail in today's market is that $EUR 's MA5 (1.12464) is still above its MA20 (1.12333), yet the price has fallen to 1.1233, down 1.38% over 24h. The moving averages have not yet formed a death cross, but the price has already lost the MA20—a typical case of “structure lagging behind price,” with the bullish structure passively breaking down. The MACD histogram remains bearish at -7.58e-06, RSI is only 49.0 with no oversold cushion, and the Bollinger Bands have narrowed to [1.12075, 1.12592], with a range of about 2.08% over 30 candlesticks. After volatility compression, the
post-image
QNT+4.79%
NEAR+1.17%
Over the past month and a half, the market has already given us the answer.
BTC fell from 87,000 to 74,000, down 15%.
SOL fell from above 100 to 84.
There was no major crash in between, just a little drop one day, then another little drop the next.
This kind of market is the most agonizing and the most painful.
Who made money during this period?
Not the short sellers, but those who stayed out of the market.
Do the math and you’ll understand:
If you were fully invested at 87,000, you’re now down 15%,
and it would take a 17.6% rise just to break even.
But if you had stayed out until now, with th
post-image
BTC-0.65%
Live market update
live-cover
LIVE1,963
What Is an RSI and MACD Combination Strategy? How Can Different Indicators Confirm Each Other to Reduce Misjudgments from a Single Signal?

In cryptocurrency trading, using just one technical indicator can leave you vulnerable to interference from sideways markets or short-term volatility. RSI mainly reflects recent price momentum, while MACD helps track trend direction and changes in momentum. Combining the two lets you analyze the market from different perspectives, but it does not mean the signals will necessarily be more accurate.

First, what does each indicator show?

RSI is typically us
post-image
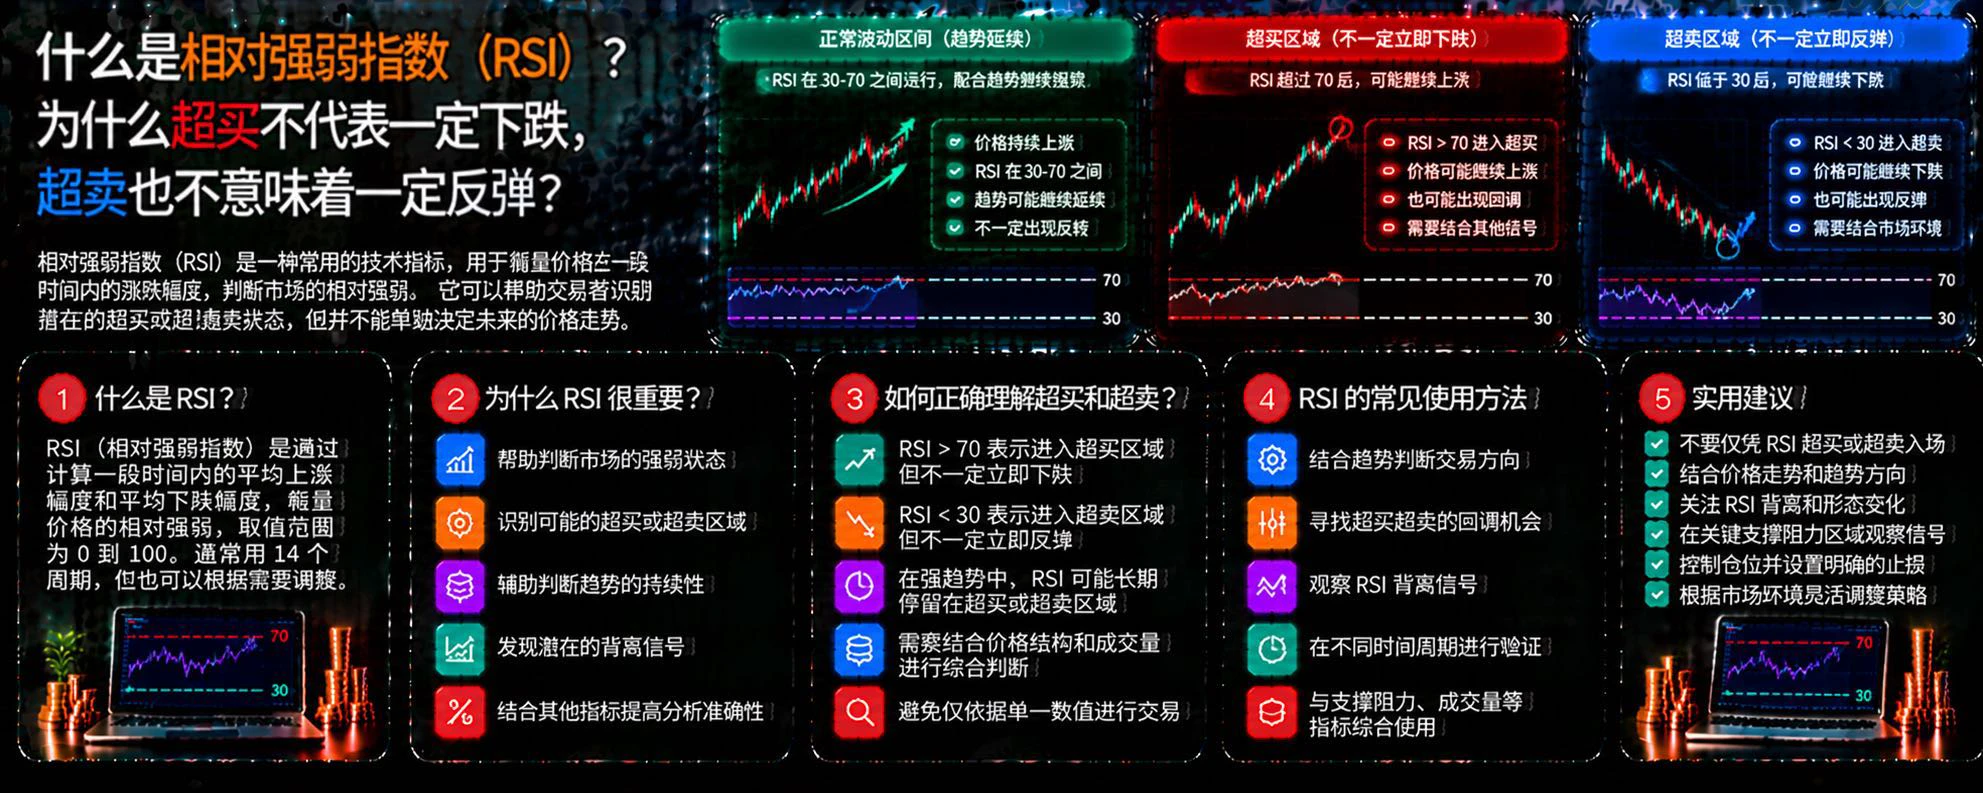
What Is the RSI Indicator? How Can the Relative Strength Index Help Identify Market Momentum and Potential Overbought or Oversold Zones?

In crypto trading, BTC may suddenly pull back after rising for a while, or rebound after a sustained decline. RSI (Relative Strength Index) is a common momentum indicator that can help traders observe the relative strength of recent price gains and losses, but it cannot accurately predict every market reversal.

First, what is RSI?

RSI typically ranges from 0—100, with 14 periods being a common setting. The indicator compares the average gains and average l
post-image
BTC-0.67%
Eshu Live_Over all crypto market updates
live-cover
LIVE2,578
Me: CPI comes out tonight; just stick to the plan.
Also me: Did it just go up? Should I chase? Why is it dropping again? 😂

VIPs, does anyone else have “a strategy in my head, but my fingers have a mind of their own”?

Having a trading bot to help makes things much easier:
👉 Clearly define in advance what conditions trigger entry, how many batches to execute, and where to take profit or cut losses
👉 Then go to
@Gate_zh
the trading bot, choose a strategy and set the parameters. Once the conditions are met, it executes according to plan, so you’re less likely to change your mind on the spot
post-image
  • 1
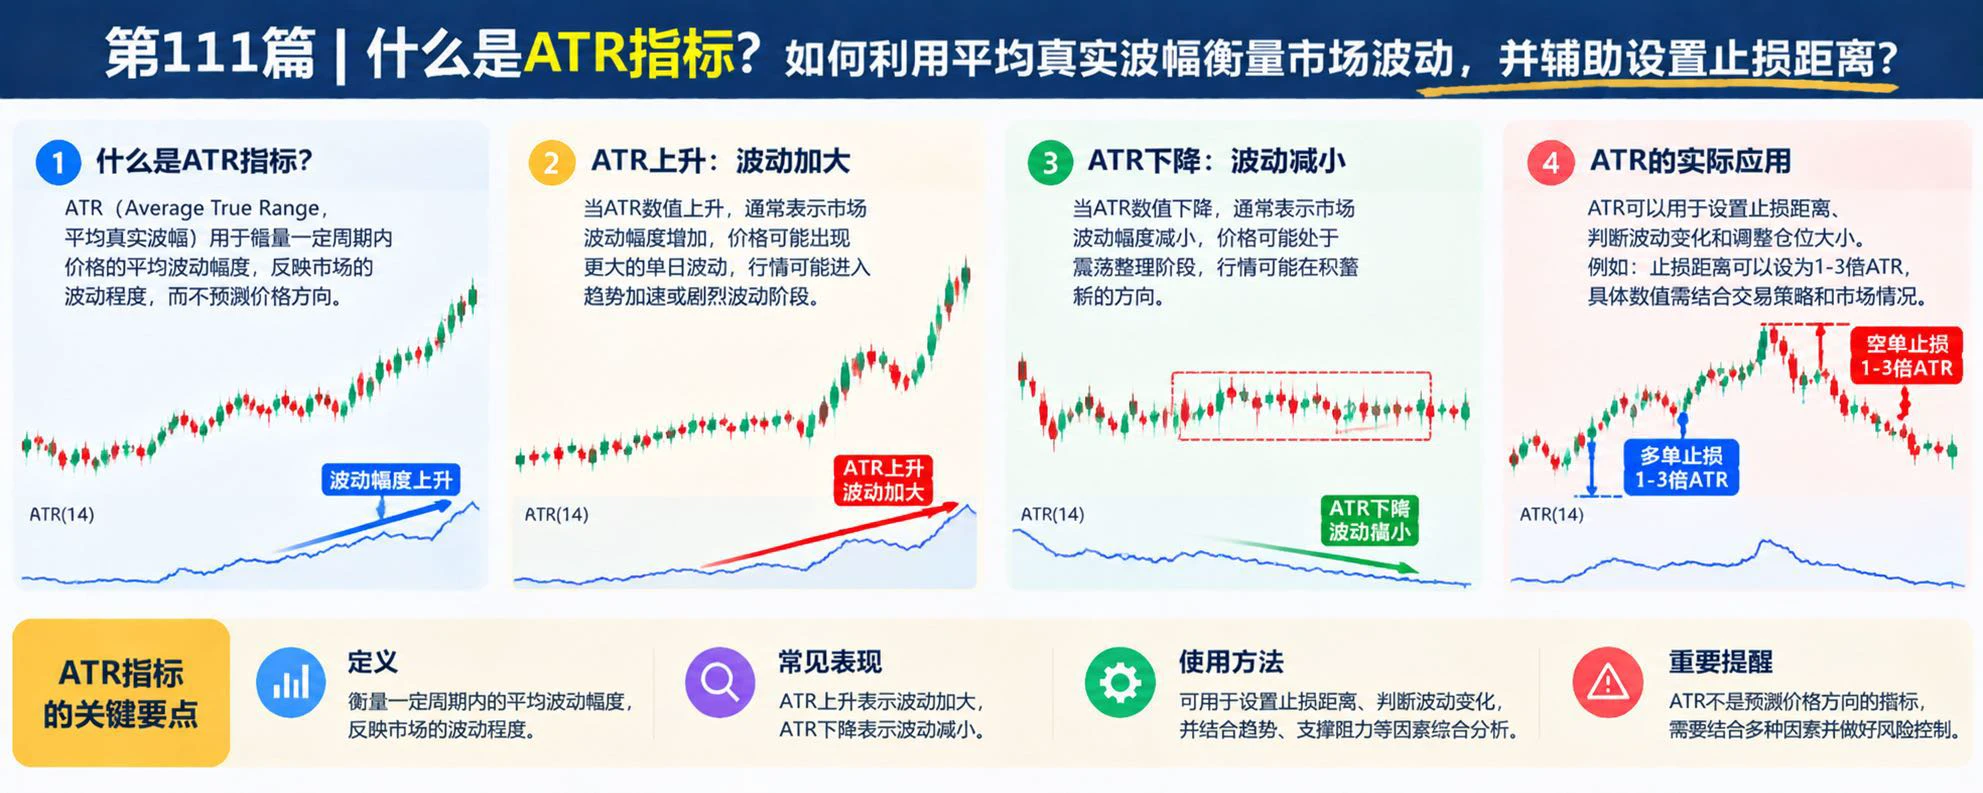
What Is the ATR Indicator? How Can Average True Range Measure Market Volatility and Help Set Stop-Loss Distances?

In crypto trading, a 2% stop-loss can mean very different things in calm and highly volatile markets. ATR (Average True Range) can help traders measure market volatility and inform stop-loss distances and position sizing, but it cannot predict whether prices will rise or fall.

First, what is ATR?

ATR calculates the true range over a given period and smooths the results to measure average market volatility. True range considers not only the difference between the high and low, bu
post-image
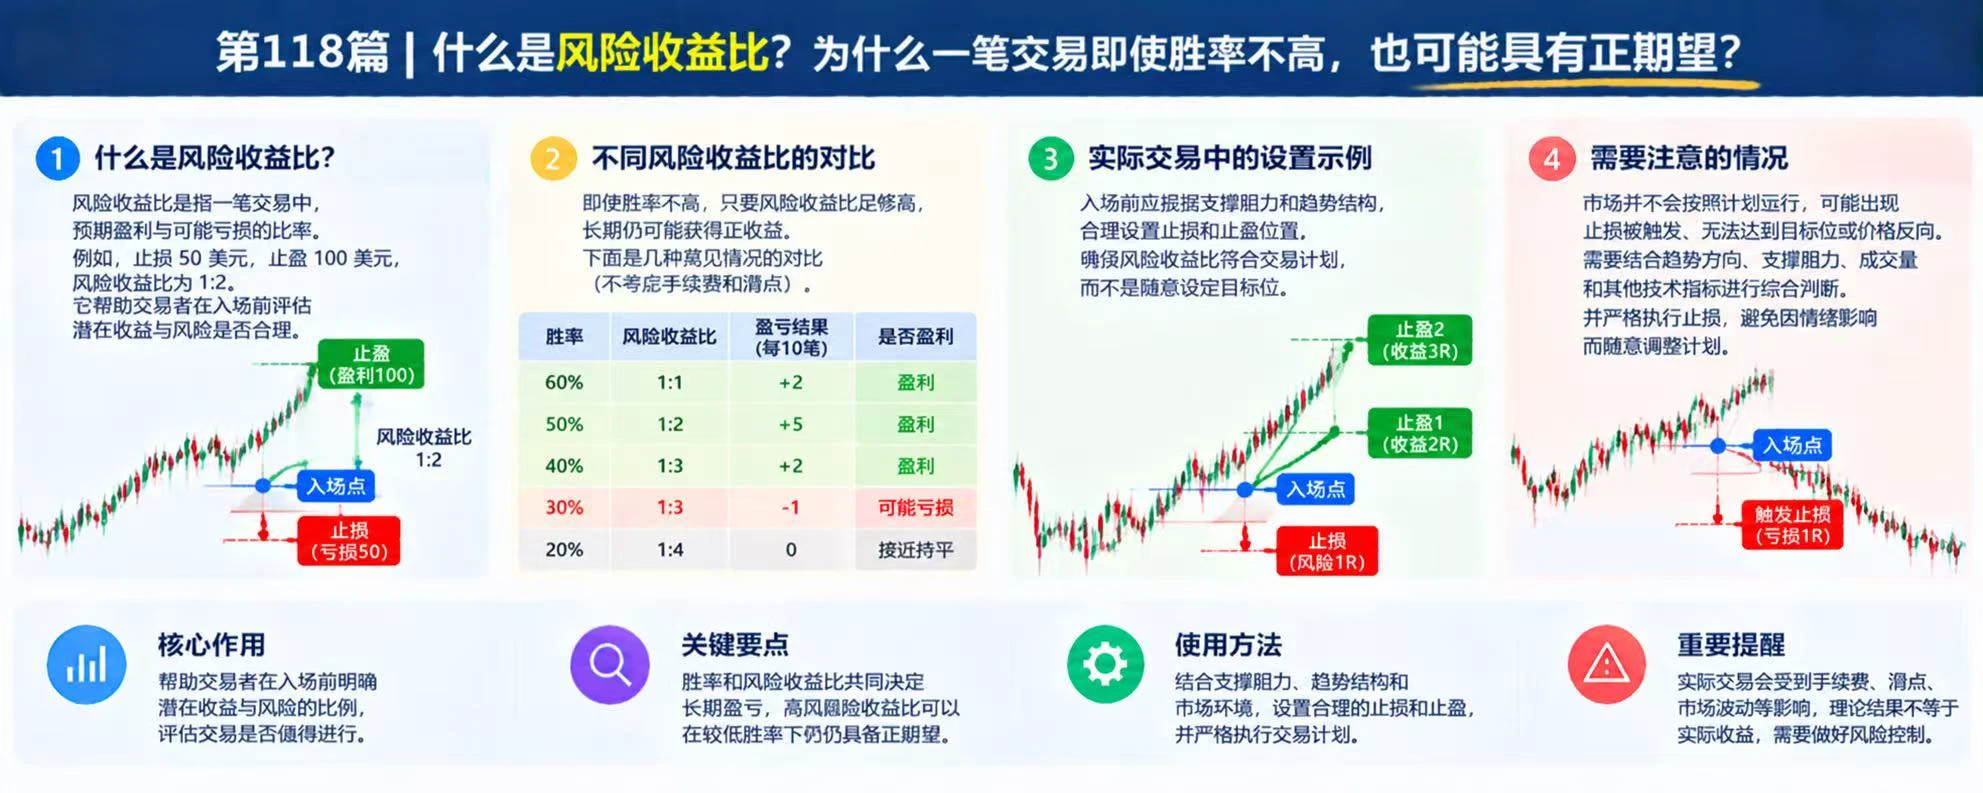
What Is the Risk-Reward Ratio? Why Can a Trade Have Positive Expectancy Even With a Low Win Rate?

In crypto trading, many people focus only on the win rate while overlooking the size of each win and loss. Even if a strategy is often wrong, it can still have positive expectancy over the long term as long as the average profit on winning trades is enough to cover the losses. The risk-reward ratio is an important tool for assessing a trade’s potential gains and losses.

First, what is the risk-reward ratio?

The risk-reward ratio typically compares the expected loss with the expected profit. For
post-image
Incase you didn't know...👇
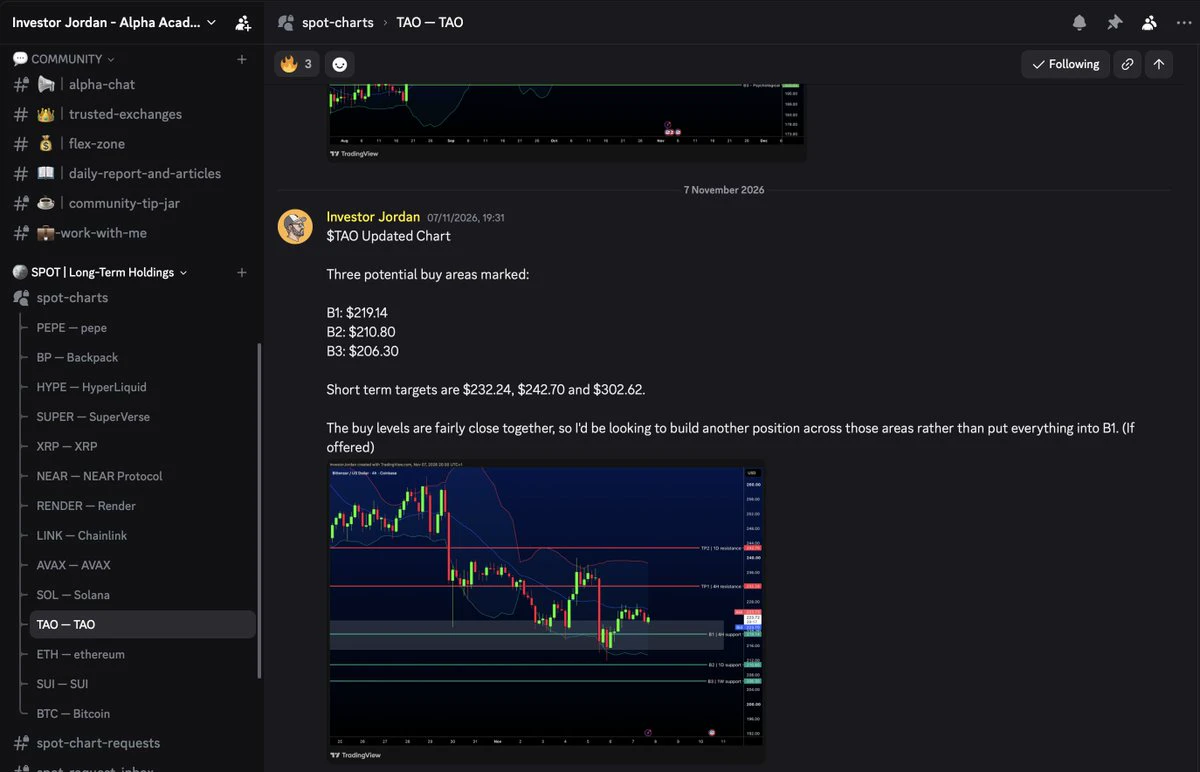
CASH is a position, and I highly advise every single one of you to be holding it in your portfolio.
Wait for our buy levels to be triggered and then deploy...example for our bittensor:native buy orders that was posted in our sub section.
post-image
TAO+0.41%
NEAR AI patched an SGLang vulnerability after an attacker accessed part of its infrastructure on Nov. 8.
The team contacted affected users. NEAR Protocol and NEAR Intents were unaffected, according to co-founder Illia Polosukhin.
@NEARProtocol @ilblackdragon
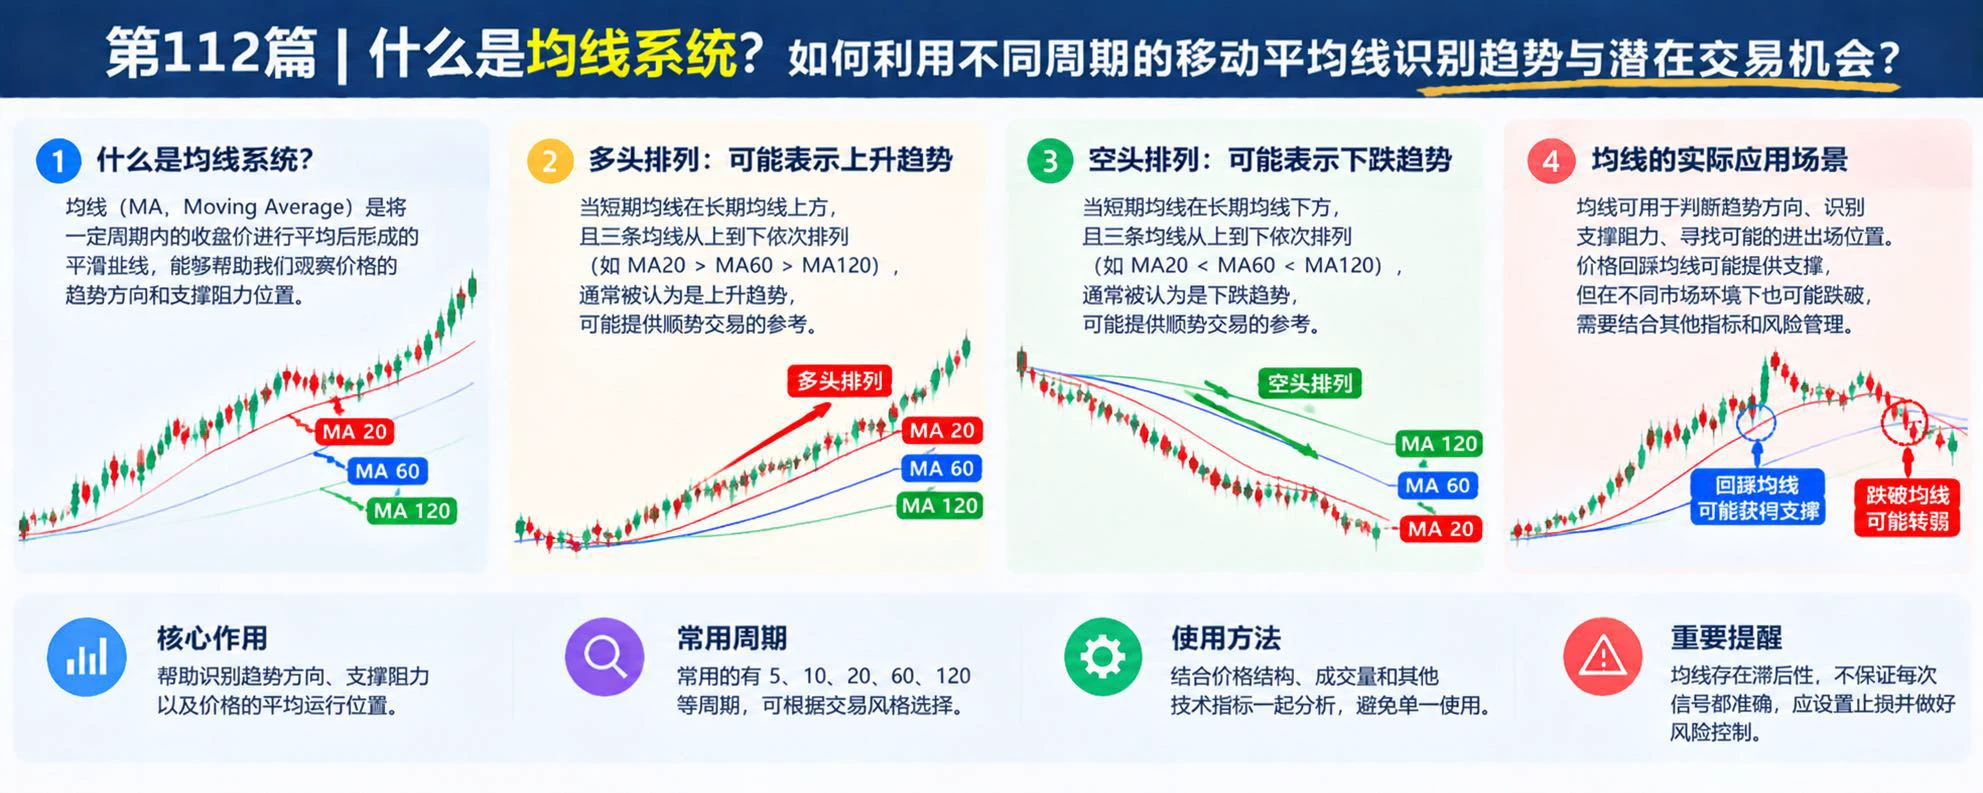
What Is a Moving Average System? How Can Different Moving Average Periods Be Used to Identify Trends and Potential Trading Opportunities?

In cryptocurrency trading, BTC’s short-term volatility often makes it difficult to judge the overall direction. Moving averages (MAs) smooth price data over a period of time, helping traders observe trends, identify potential support and resistance, and avoid overreacting to short-term noise.

First, what is a moving average system?

A moving average is the average closing price over a given period. Common periods include MA5, MA20, MA60, and MA120. Short-p
post-image
BTC-0.67%
Load More

Join 40 M users in our growing community

⚡️ Join 40 M users in the crypto craze discussion

💬 Engage with your favorite top creators

👍 See what interests you

Trending Topics

GateGlobalComplianceExpansion

646 Views201 Discussing

Gate continues to expand its global compliance footprint, now covering 81 regulated jurisdictions across Europe, North America, Asia, and Oceania. From MiCA and U.S. state-level MTLs to Japan’s FSA, Dubai, and Australia-related regulatory approvals, global exchanges are entering a new stage of compliance competition. Do you think regulatory strength will become as important as products and liquidity for exchanges in the future?

USCPIDataIncoming

56.23k Views2.3k Discussing

USIranTalksShowNewProgress

10.54k Views1.29k Discussing

View More