Square
Following
Hot
News
Profile
Share your thoughts
placeholder
Article
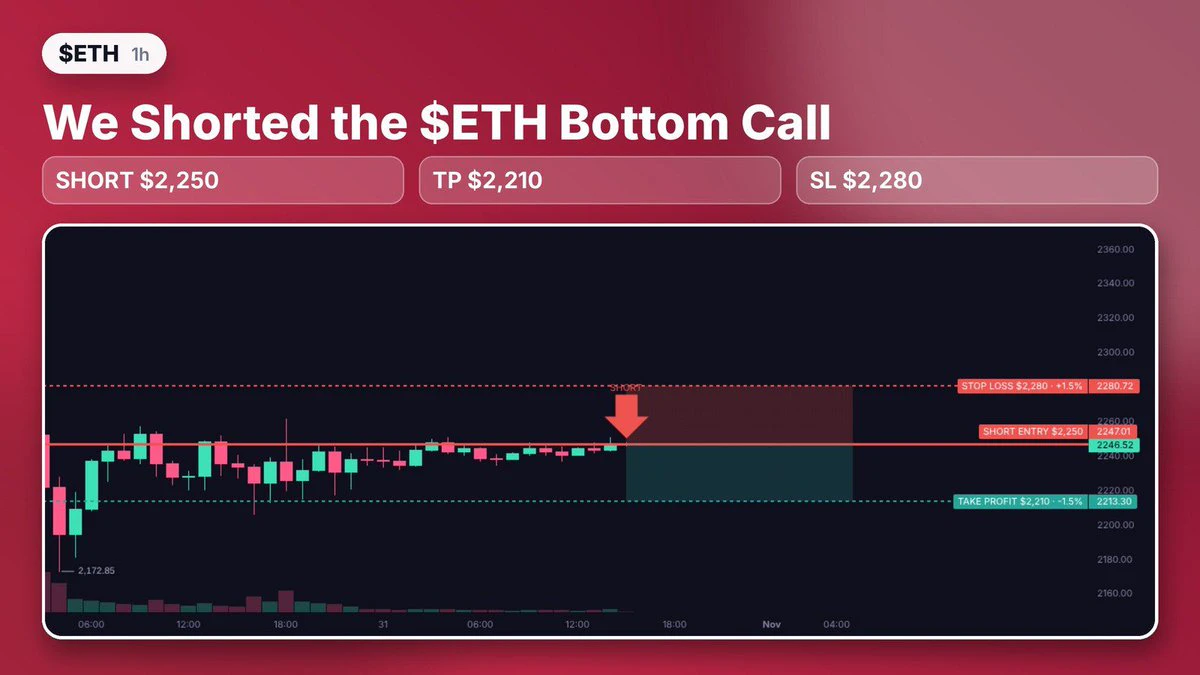
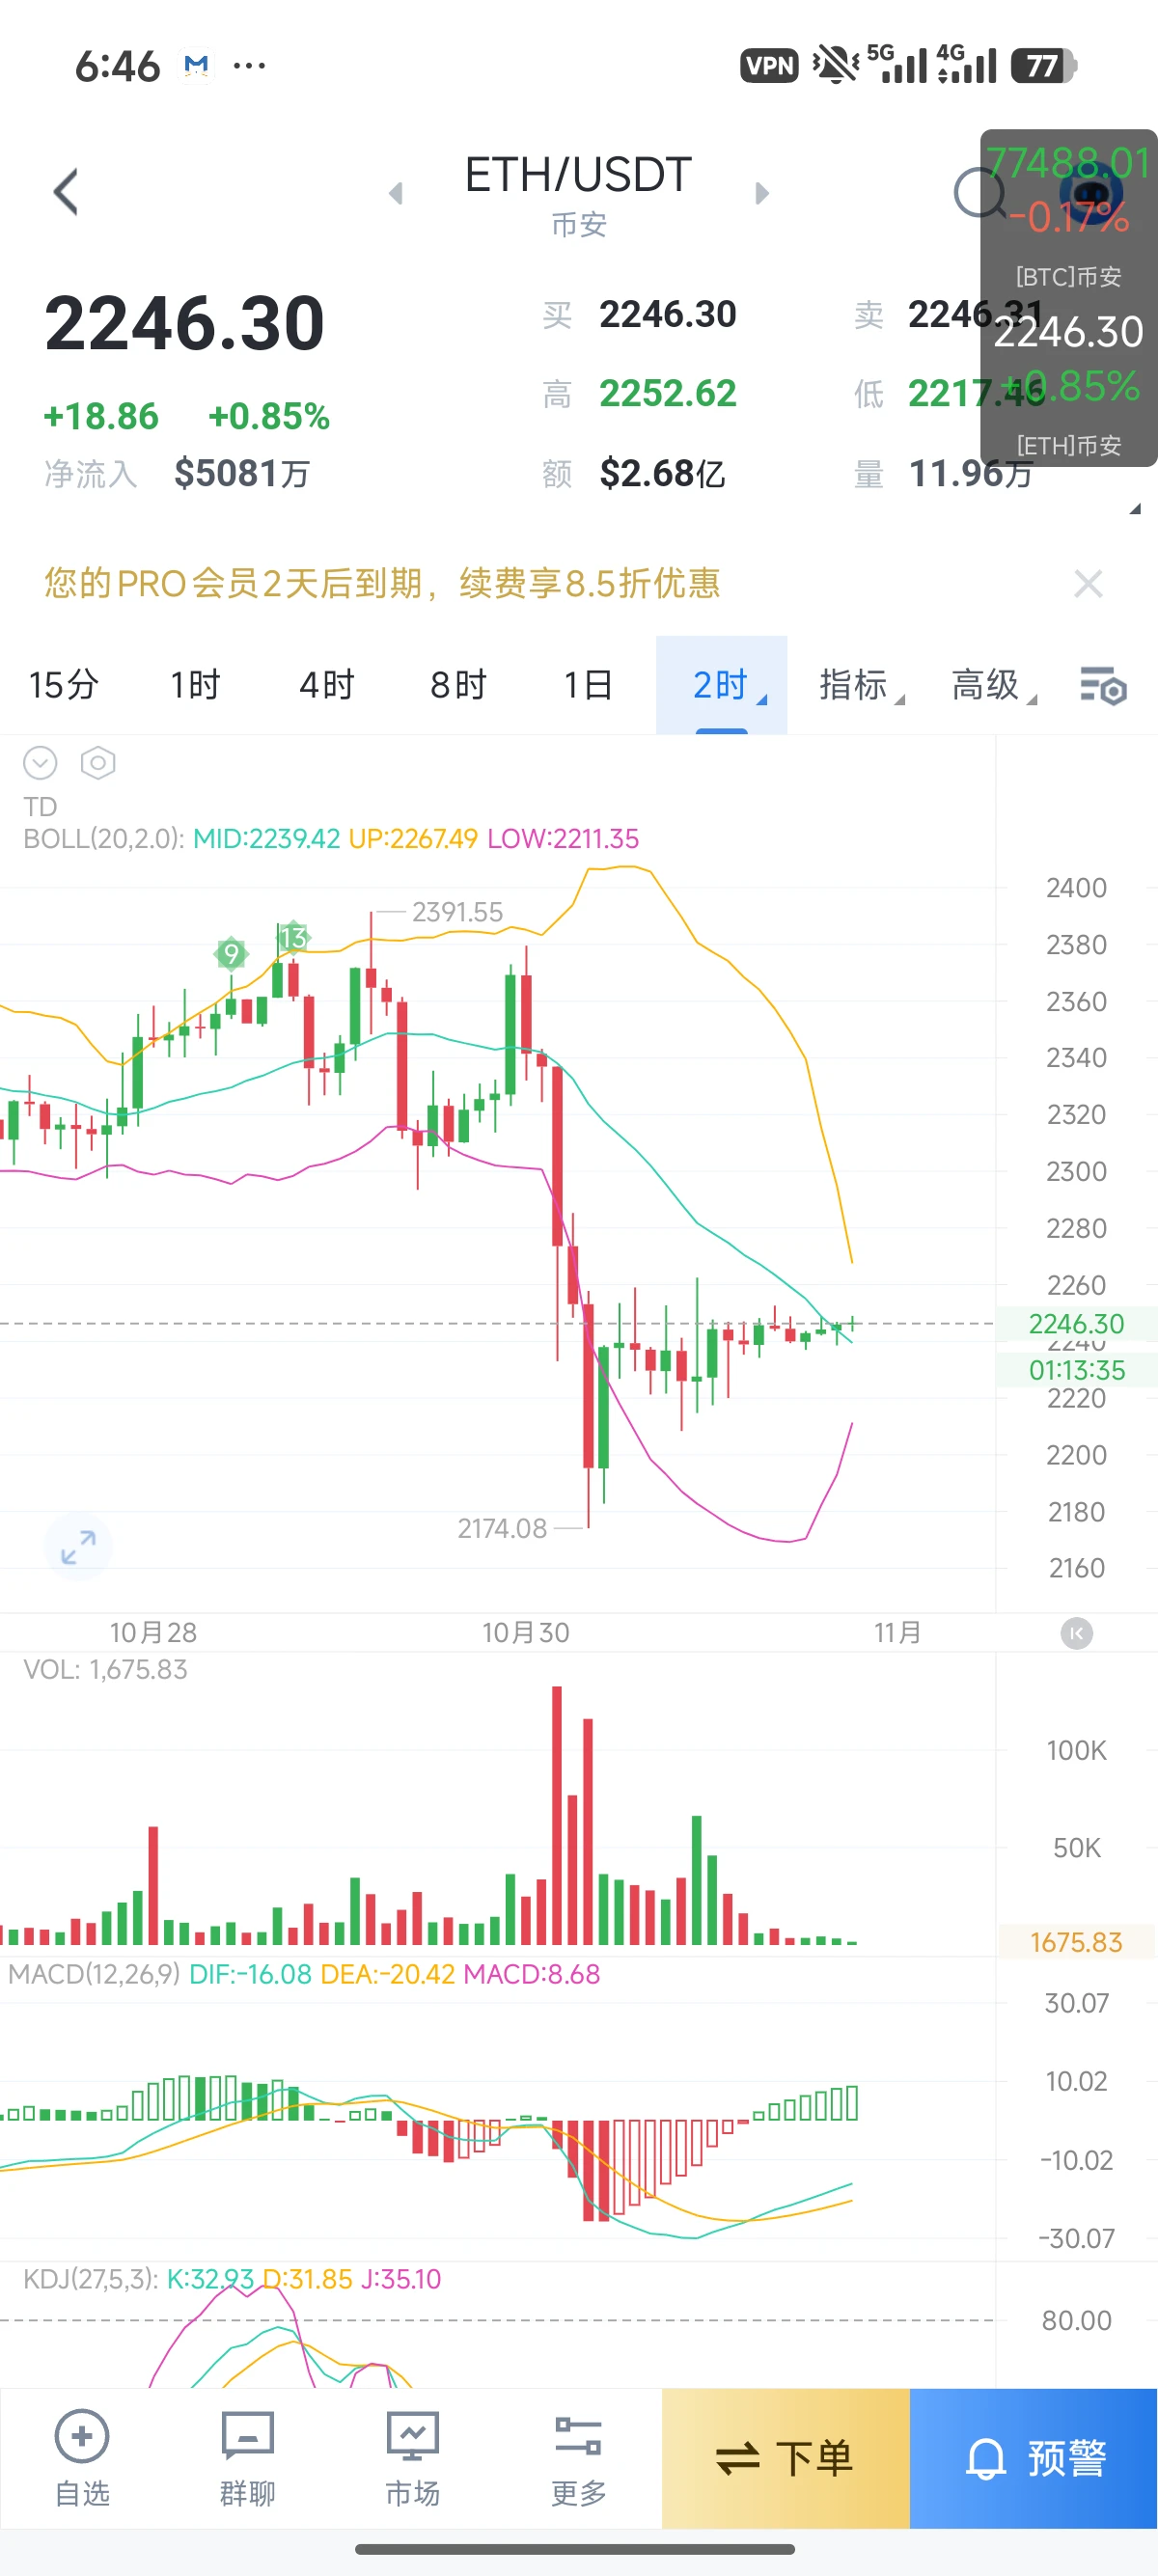
Everyone is calling $2,170 the bottom for $ETH . We just shorted it. Entry $2,250, take profit $2,210, stop $2,280. The bounce ran into $2,260 and has been giving it back since, while bitcoin stalled at $77,700 and went nowhere. We are not buying the reversal story without a buyer. Trade runs 24 hours, then we exit at market. Where do you see ETH going from here?
ETH SHORT · Entry $2,250 · TP $2,210 · SL $2,280
#Ethereum
post-image
ETH-1.26%
BTC-0.67%
Today is Saturday. The crypto market moved sideways all day with little volatility. From the sidelines, it feels like bulls don't dare to buy, profitable shorts don't want to take profit, and losing shorts don't want to close their positions. After bottoming at 2173 yesterday, the price held above 2230 and hasn't pulled back much since. Compared with yesterday, today has been a sideways move with an upward bias. Trading volume is thin, which does feel a bit like the end of a bear market, judging by trading volume and market performance over the past two months.
First, let's analyze the market
  • 9
Trenches
IDOL
I
bade
b
IDOL
0x3b...ab07
Market Cap
$.
Change
.
24h Vol
$.
Holders
.
SAFU
S
bade
b
SAFU
0x7c...7777
Market Cap
$.
Change
.
24h Vol
$.
Holders
.
Q
Q
bade
b
Q
0xc0...0589
Market Cap
$.
Change
.
24h Vol
$.
Holders
.
STONK
S
bade
b
STONK
6GmA...UNgx
Market Cap
$.
Change
.
24h Vol
$.
Holders
.
GTA6
G
bade
b
GTA6
4kjr...zDnz
Market Cap
$.
Change
.
24h Vol
$.
Holders
.
The Fear & Greed Index fell to 30,
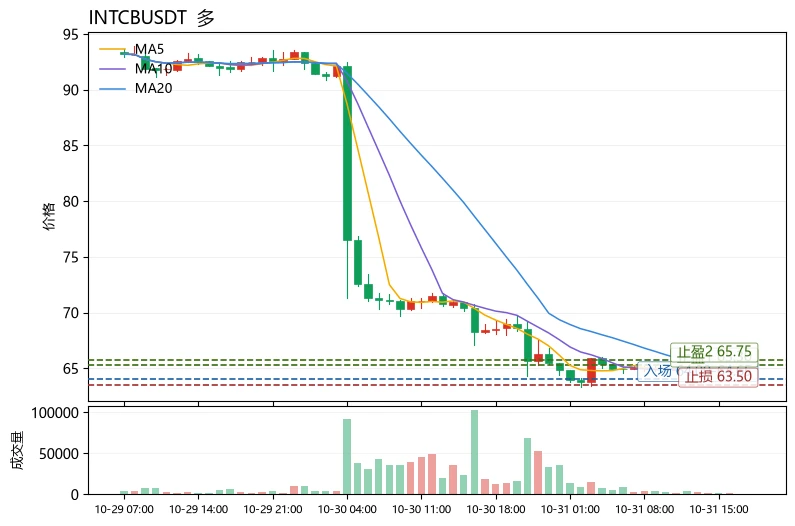
$INTCB yet an oversold rebound signal has emerged. Should we catch this move?
The answer is that you can cautiously try a small long position, but treat it only as an oversold bounce, not a reversal to bet heavily on. At the broader market level, a Fear & Greed Index of 30 is in the fear zone. ETH is barely holding above MA5, up just +0.19%, while BTC has provided no directional impetus. Capital is clearly leaning defensive, and altcoins are under greater pressure. $INTCB is down 6.39% over 24h, with its price at 64.65, below MA5 and MA20. But its RSI is jus
post-image
INTCB
INTCBINTEL
Four.meme
MC:$3.22KHolders:4
0.16%
HYPE+0.24%
The core of quantitative trading is control and transparency
Alpha Quant | Your funds, under your control
Clear operating rules, with support for real-world testing
One more choice on your trading journey
post-image
Weekends are just choppy. Wait for a pullback, then start with a small position, because this incident is nowhere near as bad as FTX. If it’s time to enter, it’s okay to enter.#ETH #BTC
post-image
ETH-1.26%
BTC-0.67%
Notice that the girl just posted a video filmed abroad with a foreigner in the frame.
post-image
Fully automated CFD gold trading bot. How did it perform during yesterday’s sharp drop? Take a look and find out
  • 1
this is about $30 dollar lol...
im down $200+
we move
post-image
MOVE-1.45%
Draft Ethereum proposal aims to let wallets permanently disable EIP-7702 delegation
live-cover
LIVE1,948
🔥 $AAVE Showing bullish recovery momentum! AAVE is rebounding strongly from recent lows and attempting to break back above the $133 resistance zone. Buyers are stepping in, and the price could rise further if the recovery momentum continues. 🚀Trade idea: Long $AAVEEntry: 132.00 – 133.50Take profit 1: 140.00Stop loss: 124.06Take profit 2: 150.00Take profit 3: 175.49Trade here $AAVE : 👇
post-image
AAVE-1.22%
$NFLX ‌
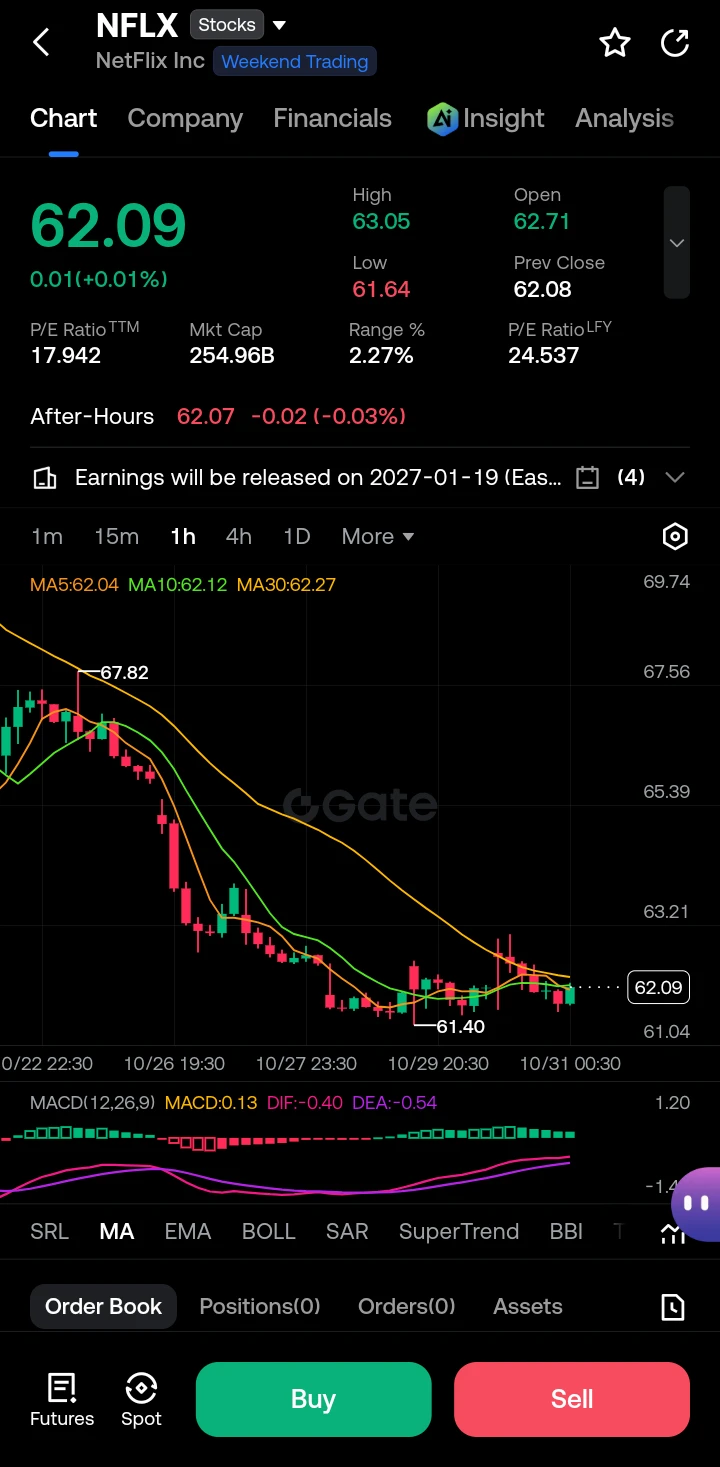
NFLX is trading near its 52-week lows around $62 after a prolonged downtrend, with the stock down ~34% YTD and ~43% over the past year (post 10-for-1 split in Nov 2025). It sits just above the recent low of ~$61.39–$61.40, showing slight stabilization on the hourly chart but remaining in a clear bearish structure with price below key moving averages. After-hours action is flat to slightly lower. Earnings were released on Oct 20, 2026; the stock sold off on softer ad guidance and engagement concerns despite a solid profit beat.​
Fact.
Price: ~$62.09 (as of the chart; close ~$62.08 on O
post-image
NFLX+0.01%
  • 9
  • 2
Sleep is the best way to stay healthy.
post-image
$BNB $ETH Is this BTC pension data really that outrageous?
post-image
BNB-0.76%
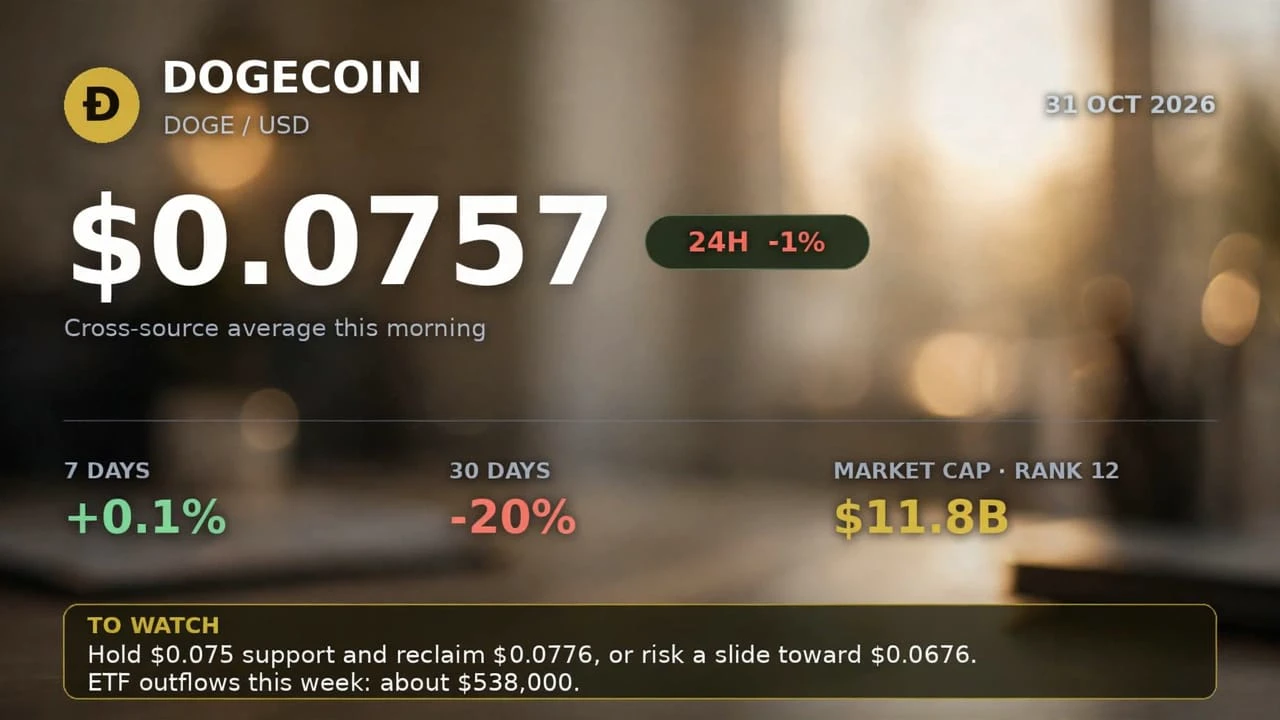
Dogecoin is trading around $0.076 this morning, down about 1% over the last 24 hours, after losing over 5% the day before and dipping to about $0.072.
The pressure is coming from both sides of the market: spot ETFs saw about $538,000 of outflows this week, and futures open interest fell over 5% in a day to about $1.05 billion as traders grew cautious.
Dogecoin is still ranked 12th by market value at around $11.8 billion, and is down about 20% over the last 30 days.
To watch: whether it holds $0.075 support and can reclaim $0.0776, or risks a slide toward its annual low near $0.0676
#doge
post-image
DOGE-0.22%
$AGENCY Muck
Most people are watching for CPI and other indicators to break out, but I think a drop is more likely first. Inflation is still hot, the labor market is cooling, and the Fed is standing pat. That’s not bullish—it means even the Fed isn’t sure. Signs of money rotating out of tech and into defensive sectors are becoming increasingly clear. Stare at charts for too long, and you start seeing what you want to see. Maybe I’m wrong. I’ll wait to be proven wrong.
post-image
  • 5
  • 1
Not everyone is qualified to kiss up.
post-image
Load More

Join 40 M users in our growing community

⚡️ Join 40 M users in the crypto craze discussion

💬 Engage with your favorite top creators

👍 See what interests you

Trending Topics

BTC大跌

286.12k Views39.61k Discussing

$BTC briefly fell below $77,000 and remains under pressure around the $77K zone, with its 24-hour decline still above 4%. With risk appetite weakening and Fed uncertainty rising, where is the next key support after losing $80K?

IntelBeatsEarningsButStockPlunges

21.64k Views834 Discussing

StrategySTRCNears100ParValue

26.6k Views4.09k Discussing

View More