







#USStocksFaceHistoricSelloff #ShareWeekly
The Market Is Moving Beyond Political Headlines: Why Capital Is Becoming More Selective
Financial markets often react positively when uncertainty disappears, but maintaining that momentum requires something much stronger: solid economic data, corporate earnings, institutional demand, and confidence in future growth. This is exactly what we are witnessing following the recent US midterm elections.
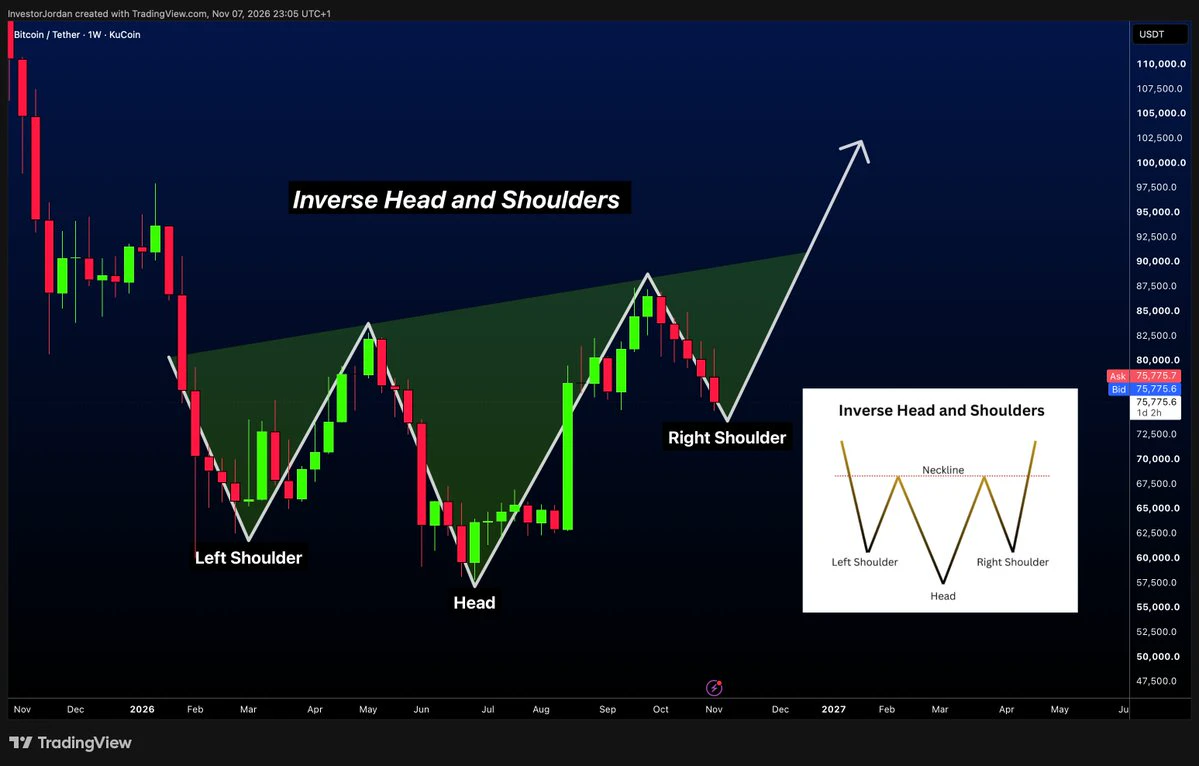
Initially, the political outcome created a wave of optimism across financial markets. Investors welcomed the reduction in political uncertainty, triggering a recovery in risk-sensitive assets. Bitcoin climbed from the $76,000 region to above $80,000, while equities experienced a broad improvement in sentiment.
However, the market quickly entered a different phase. Instead of continuing to rise together, individual sectors started moving in opposite directions. In my view, this is not necessarily a sign that the recovery has ended. It reflects a transition from headline-driven buying toward a more selective investment environment.
1. Why Is the Equity Market Experiencing a Rotation?
One of the most interesting developments is the growing divergence between traditional industries and technology stocks.
Futures linked to the Dow Jones have demonstrated relative strength, supported by industrial and financial companies, while Nasdaq futures have faced pressure from technology and semiconductor weakness.
This suggests that investors are reconsidering where the next attractive returns might come from. After a strong rally in artificial intelligence-related stocks, some market participants are taking profits and reallocating capital toward companies with established earnings, more predictable cash flows, and potentially more attractive valuations.
A balanced barbell strategy could make sense in this environment. Rather than completely abandoning technology, investors can maintain selective exposure to innovative companies while diversifying into cyclical industries.
2. Artificial Intelligence and Semiconductors: Opportunity or Valuation Risk?
AI infrastructure remains one of the strongest long-term investment themes, but expectations have become extremely demanding.
The semiconductor industry recorded global sales of approximately $517.7 billion in the third quarter, representing a 24.1% quarterly increase. Furthermore, strong supply-chain commitments and order visibility extending toward 2029 indicate that demand for advanced computing infrastructure remains significant.
Nevertheless, strong industry demand does not automatically guarantee higher stock prices. Investors are increasingly questioning whether future earnings can justify current valuations.
The upcoming November 17 earnings report from a major semiconductor manufacturer could become an important catalyst. I would particularly monitor revenue guidance, memory pricing, AI-related orders, and management's expectations for future demand.
For short-term traders, this sector offers opportunities, but earnings volatility and unexpected guidance should not be ignored.
3. Cloud Computing: The Profitability Test
Cloud computing represents another important opportunity, particularly for investors who prefer businesses with recurring revenue and stronger cash-flow visibility.
The three largest cloud providers collectively recorded 56% year-over-year revenue growth in the third quarter. This demonstrates the increasing importance of cloud infrastructure as companies expand their AI capabilities.
However, the investment narrative is changing. Previously, investors rewarded companies for announcing enormous AI infrastructure budgets. Now, they want evidence that those investments are generating measurable returns.
Companies demonstrating positive free cash flow, disciplined capital expenditure, and sustainable operating margins could attract greater institutional interest.
In my opinion, cloud computing deserves attention because its long-term growth story is supported by enterprise demand, digital transformation, and AI adoption.
4. Electric Vehicles: Recovery With Important Differences
The EV industry is also showing signs of improvement, although performance differs significantly between manufacturers.
One major manufacturer has delivered more than 480,000 vehicles for two consecutive quarters, while its automotive gross margin has improved to 18.5%. These developments suggest better operational performance and potentially stronger profitability.
On the other hand, another major manufacturer continues to lead in overall delivery volume but faces pressure from declining domestic sales in China, reaching approximately 28%, alongside disappointing earnings.
This difference highlights why investors should evaluate individual companies rather than treating the entire EV sector as one investment opportunity.
5. Bitcoin: Can Institutional Money Support the Recovery?
Bitcoin remains an important indicator of broader risk appetite.
After recovering above $80,000, the next challenge is maintaining that level through consistent demand rather than temporary optimism.
On November 4, US spot Bitcoin ETFs recorded approximately $74.6 million in net inflows, ending a three-day outflow period totaling around $1.16 billion.
This development is encouraging, but one positive session does not confirm a sustained institutional buying trend.
I would focus on several indicators: consecutive ETF inflows, trading volume, liquidity conditions, and Bitcoin's ability to hold important support levels during equity market weakness.
6. My Market Strategy: Follow Fundamentals, Not Headlines
My approach to this changing environment is relatively simple:
- Short-term opportunities: Monitor semiconductor stocks, earnings announcements, and volatility around major corporate guidance.
- Medium-term positioning: Focus on cloud companies with improving cash flow and sustainable business models.
- Long-term opportunities: Watch AI infrastructure, selected EV manufacturers, and companies benefiting from structural technological changes.
- Crypto market: Track Bitcoin ETF flows, institutional demand, and price confirmation before assuming the recovery has enough strength to continue.
The most important lesson from this rotation is that a rising market does not mean every asset deserves equal attention.
The political uncertainty may have decreased, but the investment challenge has become more demanding. Capital is moving toward businesses that can demonstrate real earnings, sustainable growth, and financial discipline.
My final perspective: I believe the next major market opportunity will come from identifying which companies can convert strong demand into actual profitability. AI, cloud computing, semiconductors, electric vehicles, and Bitcoin all deserve attention, but timing and selectivity will matter more than simply following market excitement.
What do you think will lead the next market move: AI and semiconductor stocks, cloud computing, electric vehicles, or Bitcoin?
Let's discuss your market outlook in the comments.
This is my market perspective, not financial advice.
#每周来晒 #美股史诗级抛售 #WCTCS9 @Gate_Square
The Market Is Moving Beyond Political Headlines: Why Capital Is Becoming More Selective
Financial markets often react positively when uncertainty disappears, but maintaining that momentum requires something much stronger: solid economic data, corporate earnings, institutional demand, and confidence in future growth. This is exactly what we are witnessing following the recent US midterm elections.
Initially, the political outcome created a wave of optimism across financial markets. Investors welcomed the reduction in political uncertainty, triggering a recovery in risk-sensitive assets. Bitcoin climbed from the $76,000 region to above $80,000, while equities experienced a broad improvement in sentiment.
However, the market quickly entered a different phase. Instead of continuing to rise together, individual sectors started moving in opposite directions. In my view, this is not necessarily a sign that the recovery has ended. It reflects a transition from headline-driven buying toward a more selective investment environment.
1. Why Is the Equity Market Experiencing a Rotation?
One of the most interesting developments is the growing divergence between traditional industries and technology stocks.
Futures linked to the Dow Jones have demonstrated relative strength, supported by industrial and financial companies, while Nasdaq futures have faced pressure from technology and semiconductor weakness.
This suggests that investors are reconsidering where the next attractive returns might come from. After a strong rally in artificial intelligence-related stocks, some market participants are taking profits and reallocating capital toward companies with established earnings, more predictable cash flows, and potentially more attractive valuations.
A balanced barbell strategy could make sense in this environment. Rather than completely abandoning technology, investors can maintain selective exposure to innovative companies while diversifying into cyclical industries.
2. Artificial Intelligence and Semiconductors: Opportunity or Valuation Risk?
AI infrastructure remains one of the strongest long-term investment themes, but expectations have become extremely demanding.
The semiconductor industry recorded global sales of approximately $517.7 billion in the third quarter, representing a 24.1% quarterly increase. Furthermore, strong supply-chain commitments and order visibility extending toward 2029 indicate that demand for advanced computing infrastructure remains significant.
Nevertheless, strong industry demand does not automatically guarantee higher stock prices. Investors are increasingly questioning whether future earnings can justify current valuations.
The upcoming November 17 earnings report from a major semiconductor manufacturer could become an important catalyst. I would particularly monitor revenue guidance, memory pricing, AI-related orders, and management's expectations for future demand.
For short-term traders, this sector offers opportunities, but earnings volatility and unexpected guidance should not be ignored.
3. Cloud Computing: The Profitability Test
Cloud computing represents another important opportunity, particularly for investors who prefer businesses with recurring revenue and stronger cash-flow visibility.
The three largest cloud providers collectively recorded 56% year-over-year revenue growth in the third quarter. This demonstrates the increasing importance of cloud infrastructure as companies expand their AI capabilities.
However, the investment narrative is changing. Previously, investors rewarded companies for announcing enormous AI infrastructure budgets. Now, they want evidence that those investments are generating measurable returns.
Companies demonstrating positive free cash flow, disciplined capital expenditure, and sustainable operating margins could attract greater institutional interest.
In my opinion, cloud computing deserves attention because its long-term growth story is supported by enterprise demand, digital transformation, and AI adoption.
4. Electric Vehicles: Recovery With Important Differences
The EV industry is also showing signs of improvement, although performance differs significantly between manufacturers.
One major manufacturer has delivered more than 480,000 vehicles for two consecutive quarters, while its automotive gross margin has improved to 18.5%. These developments suggest better operational performance and potentially stronger profitability.
On the other hand, another major manufacturer continues to lead in overall delivery volume but faces pressure from declining domestic sales in China, reaching approximately 28%, alongside disappointing earnings.
This difference highlights why investors should evaluate individual companies rather than treating the entire EV sector as one investment opportunity.
5. Bitcoin: Can Institutional Money Support the Recovery?
Bitcoin remains an important indicator of broader risk appetite.
After recovering above $80,000, the next challenge is maintaining that level through consistent demand rather than temporary optimism.
On November 4, US spot Bitcoin ETFs recorded approximately $74.6 million in net inflows, ending a three-day outflow period totaling around $1.16 billion.
This development is encouraging, but one positive session does not confirm a sustained institutional buying trend.
I would focus on several indicators: consecutive ETF inflows, trading volume, liquidity conditions, and Bitcoin's ability to hold important support levels during equity market weakness.
6. My Market Strategy: Follow Fundamentals, Not Headlines
My approach to this changing environment is relatively simple:
- Short-term opportunities: Monitor semiconductor stocks, earnings announcements, and volatility around major corporate guidance.
- Medium-term positioning: Focus on cloud companies with improving cash flow and sustainable business models.
- Long-term opportunities: Watch AI infrastructure, selected EV manufacturers, and companies benefiting from structural technological changes.
- Crypto market: Track Bitcoin ETF flows, institutional demand, and price confirmation before assuming the recovery has enough strength to continue.
The most important lesson from this rotation is that a rising market does not mean every asset deserves equal attention.
The political uncertainty may have decreased, but the investment challenge has become more demanding. Capital is moving toward businesses that can demonstrate real earnings, sustainable growth, and financial discipline.
My final perspective: I believe the next major market opportunity will come from identifying which companies can convert strong demand into actual profitability. AI, cloud computing, semiconductors, electric vehicles, and Bitcoin all deserve attention, but timing and selectivity will matter more than simply following market excitement.
What do you think will lead the next market move: AI and semiconductor stocks, cloud computing, electric vehicles, or Bitcoin?
Let's discuss your market outlook in the comments.
This is my market perspective, not financial advice.
#每周来晒 #美股史诗级抛售 #WCTCS9 @Gate_Square