Square
Following
Hot
News
Notifications
Profile
Share your thoughts
placeholder
Article
Question: What is the password?
post-image
Now look what happened—everything has collapsed.
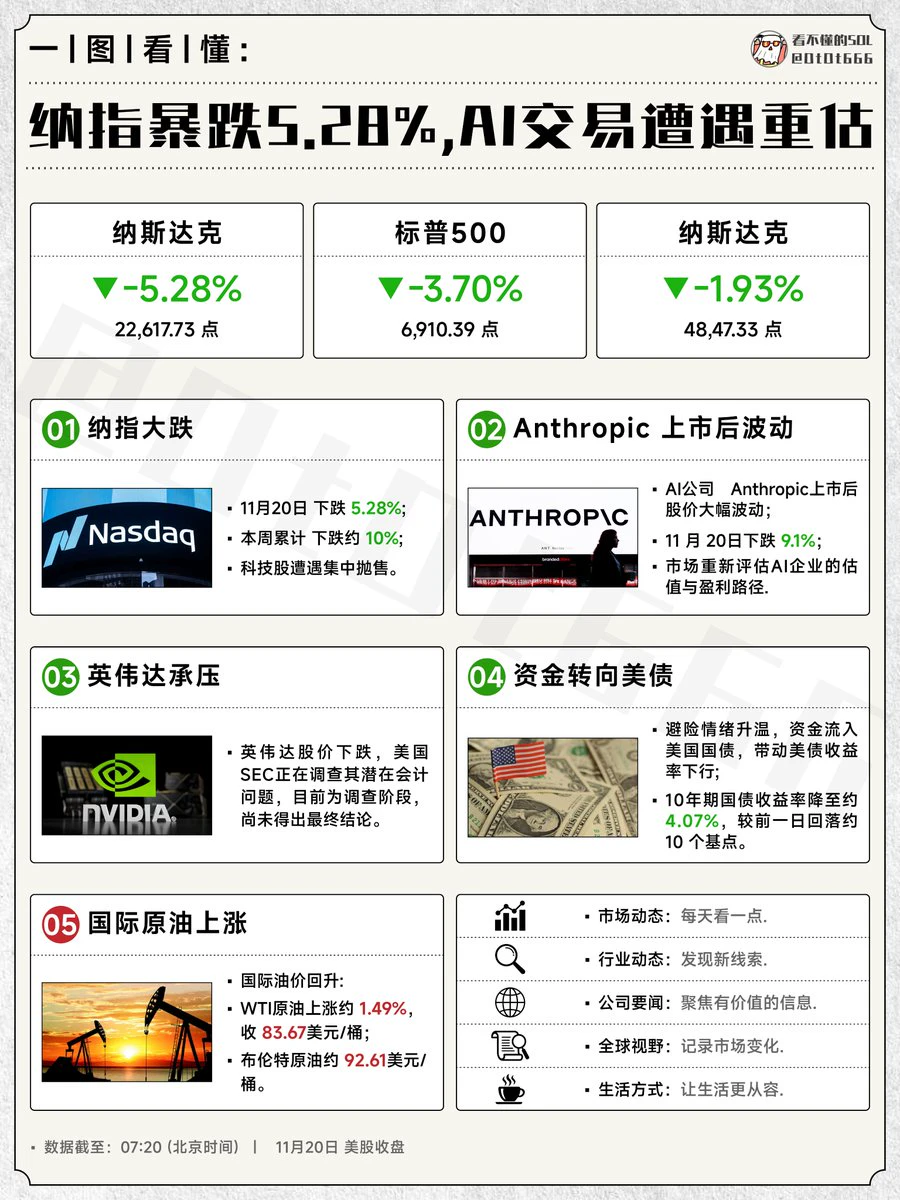
The Nasdaq plunged 5.28%, wiping out all its gains this year.
The Philadelphia Semiconductor Index fell 10.73% to close at 8,408 points, down 42% from its June high.
Nvidia fell 14%, Micron fell 13.89%,
AMD fell 13.25%, SanDisk fell 16%,
SK Hynix fell 13.11%, and TSMC fell 9.48%.
Every stock on the most actively traded list was down double digits.
Nvidia fell 23% for the week, its biggest weekly drop since October 2008. Seven straight sessions of losses wiped out $1.16 trillion in a week.
Since its October peak, it has lost $2.7 trillion in mark
post-image
NVDA-13.84%
AMD-13.27%
SNDK-15.99%
SKHY-13.06%
TSM-9.28%
  • 7
Trenches
IDOL
I
bade
b
IDOL
0x3b...ab07
Market Cap
$.
Change
.
24h Vol
$.
Holders
.
JAGENT
J
bade
b
JAGENT
0x8e...ae15
Market Cap
$.
Change
.
24h Vol
$.
Holders
.
PIEVERSE
P
bade
b
PIEVERSE
0x0e...25a9
Market Cap
$.
Change
.
24h Vol
$.
Holders
.
FIONA
F
bade
b
FIONA
B34n...pump
Market Cap
$.
Change
.
24h Vol
$.
Holders
.
CLAUDIA
C
bade
b
CLAUDIA
2j5S...W2ZM
Market Cap
$.
Change
.
24h Vol
$.
Holders
.
Bitcoin Faces New Inflation Threat as US Factory Price Hits 4-Year High
US factory prices rose in November and inflation data due Nov. 25 could reshape Fed rate expectations and the cost of dollar loans tied to Bitcoin positions.
Nearly half of manufacturers surveyed by the Philadelphia Fed said they raised selling prices in November, while reports of rising and falling new orders were nearly balanced.
⚠️ Personal market analysis only. NFA — manage risk and DYOR.
Educational content, not investment advice or a recommendation to buy, sell, deposit, or withdraw any asset. No paid promotion or re
post-image
BTC-0.67%
  • 1
  • 1
$CVX The short position is fully set up, with the current sell price locked at $0.162.
Entry cost: $1.125
Continue adding to the short position $CVX 🔥
CVX -1.59%
Risk warning: The above is only a sharing of personal trading ideas and does not constitute investment advice. Leveraged contract trading carries extremely high risk; please manage your positions accordingly.
post-image
CVX-1.44%
The $ENA Price Has Moved—Why Hasn’t Volume Followed?

$ENA is currently priced at 0.0971, up 1.357% over the past 24 hours. Its intraday high is 0.1, and its low is 0.0897. On the 1-hour and 4-hour timeframes, $ENA is showing a weak trend amid volatility. However, the price has broken above the 1-hour EMA20 at 0.09773796, and RSI14 at 35.29 is nearing neutral territory, indicating active short-term buying. The 1-hour support is at 0.0897, with resistance at 0.1. The price is above support, suggesting stronger short-term bullish momentum. However, the volume ratio is only 0.52, far below averag
post-image
ENA+8.04%
  • 1
$EVAA It’s down nearly 40% in 24 hours. This doesn’t look like a technical correction—it feels like a real drop, not a fake one
post-image
EVAA-0.49%
#下周PCE与GDP数据将揭晓 Next week's PCE and GDP arrive together: watch these three columns for the rate-hike path

On Nov 25 at 21:30, US PCE, revised GDP, and personal spending are released simultaneously. There is little suspense over the direction of rate hikes; the focus is on the magnitude and path. Just watch these three columns: prices, growth, and asset correlations.

I. Information to watch
Next week has a set of data worth marking on the calendar in advance. According to CLS's investment calendar, on Nov 25 at 21:30, the US October Personal Consumption Expenditures Price Index, the revised a
Trump
Fed Decision in December?
25 bps increase
90%1.11x
No change
6.9%14.49x
$1.71M 24H+3 more
USIDX-0.09%
GLDX-0.40%
PAXG+0.37%
  • 1
The World's Largest Hedge Fund Is Playing It Safe:
Inside Bridgewater’s Defensive Strategy
Ray Dalio’s Bridgewater Fund, the biggest hedge fund in the world, is sending a clear message to the market with a massive 11.29% allocation to SPY (S&P 500 ETF) and 5.02% to IVV (iShares Core S&P 500 ETF), showing a heavy reliance on broad market stability rather than risky stock picking. This "All-Weather" approach indicates that the smartest money is expecting choppy waters ahead and is prioritizing capital preservation by essentially owning the entire US stock market, while keeping a small hedge in
post-image
IVV-3.91%
... Does it really have this effect?
post-image
$BNB — Buyers are pushing to break through the price again 🚀BNB showed strong recovery momentum around $543. If buyers continue to control the situation and the price breaks through nearby resistance, we may see further gains toward the next resistance area. Trading strategy: long 📈Entry price: 541.50 – 544.00Take profit 1: 548.00Take profit 2: 551.00Take profit 3: 556.00Stop loss: 534.00
post-image
BNB-0.76%
MARKET OVERVIEW
live-cover
LIVE1,763
BTC-0.67%
$HYPE 60.5, 24H +6.42%. It has rebounded from the lows to 60.5—a sizable gain—but the short-term trend hasn’t fully turned bullish yet. I don’t want to mistake a rebound for a reversal. This looks more like a recovery than the start of a new trend. 61.9 is resistance; I’d only look higher once it holds above that level. A break below 55.88 would weaken the short-term outlook. Volume hasn’t followed through, so I won’t chase until a breakout is confirmed. This is a level to watch closely right now. Let’s watch the market and not rush—I’d rather wait for a clear direction. Not investment advice.
post-image
HYPE+0.24%
[New Streamer] Market Prediction
live-cover
LIVE1,902
BTC-0.67%
#PCEAndGDPDataNextWeek

According to the U.S. Bureau of Economic Analysis schedule, both releases arrive on Wednesday, November 25, 2026, at 8:30 AM Eastern Time. That double-header puts fresh growth and inflation numbers directly in front of markets ahead of the December 8–9 Federal Reserve meeting.
📊 WHAT HAPPENED

In the prior PCE release covering September 2026, headline PCE rose 0.5 percent month-over-month and 3.6 percent year-over-year, while core PCE—which leaves out volatile food and energy prices—rose 0.3 percent on the month and 3.1 percent over the year. Meanwhile, the advance e
BTC-0.67%
$BABY Currently heavily shorting, later sell at $0.003048. Short entry price: $0.007333 $BABY 👇
post-image
BABY+8.31%
Thank you to all my friends who supported me by voting for me in the Gate 2026 Annual Gala! You, too, can participate in the voting—doing so will earn you one entry into a lucky draw where you could win surprise prizes. https://www.gate.com/competition/Annual-Gala?ref_type=165&ch=Direct&ref=UFRFAQ0M
  • 6
$AKE These people who secretly engineer market dumps make more money
AKE+6.07%
$MMT Short setup: After a sharp rejection from the top following a parabolic rally to 0.30, the price plunged -19.87%. The sell-off is fierce, and sellers have taken full control of the market. Numerous red candles have appeared on the chart as the price falls rapidly and support levels break one after another. Short plan • Entry: 0.2100 – 0.2160 (current breakdown range) • Take-profit 1: 0.1950 • Take-profit 2: 0.1800 • Take-profit 3: 0.1650 • Stop-loss: 0.2300 Why short? • A classic pump-and-dump pattern; the top has already formed. • Momentum has completely turned bearish after the rejecti
post-image
MMT-2.35%
Load More

Join 40 M users in our growing community

⚡️ Join 40 M users in the crypto craze discussion

💬 Engage with your favorite top creators

👍 See what interests you

Trending Topics

BTCReboundFaces60KTest

2.1M Views30.1K Discussing

BTC rebounded from around $55,300 on November 21, briefly reclaiming $60,000 before pulling back to around $59,300. The $60K level is back in focus as traders assess whether the recovery can last. Is this rebound a sign of stabilization or a short-lived recovery? Would reclaiming and holding $60K be enough, or do you need confirmation from trading volume and fund flows?

PCEAndGDPDataNextWeek

257.8K Views2.6K Discussing

GateDirectIPOPhase3ANTAllocates92100Shares

811.6K Views5K Discussing

View More