Square
Following
Hot
News
Notifications
Profile
Share your thoughts
placeholder
Article
#GateSocialAnnualStreamerAndCreatorAwards
Gate Social 2026 Awards: What Makes a Creator Deserve Recognition?

A year-end community award should represent more than a popularity contest. Views and engagement can show that content is reaching people, but they do not always tell us whether that content is genuinely useful, original or worth remembering.

Gate Social's 2026 Year-End Community Awards have opened registration for two categories: Annual Streamer and Annual Creator. The Top 20 participants in each category will receive recognition and rewards, with prizes including DJI products, AirP
post-image
GateSquare
🏆 Gate Social 2026 Year-End Community Gala | Registration for the Annual Awards Is Now Open!

🎙️ Compete in two categories—Streamer of the Year and Creator of the Year—and vie for annual honors!
🎁 Everyone in the TOP 20 will receive a reward! Win amazing prizes like DJI products, AirPods, and projectors!
🌍 The Chinese-language and global divisions are opening simultaneously. Show your skills and compete for the grand annual prize!

⏰ Registration period: November 3–November 10 (UTC+8)
👉 Register now: https://www.gate.com/announcements/article/102561
‍#GateLive #GateSquare
repost-content-media
[New Streamer] Market Prediction
live-cover
LIVE1,679
Trenches
fxUSD
f
bade
b
fxUSD
0x08...d8f6
Market Cap
$.
Change
.
24h Vol
$.
Holders
.
ZIG
Z
bade
b
ZIG
0x8c...1145
Market Cap
$.
Change
.
24h Vol
$.
Holders
.
BTC
B
bade
b
BTC
C5xp...pump
Market Cap
$.
Change
.
24h Vol
$.
Holders
.
STONK
S
bade
b
STONK
6GmA...UNgx
Market Cap
$.
Change
.
24h Vol
$.
Holders
.
CORLA
C
bade
b
CORLA
0xba...7777
Market Cap
$.
Change
.
24h Vol
$.
Holders
.
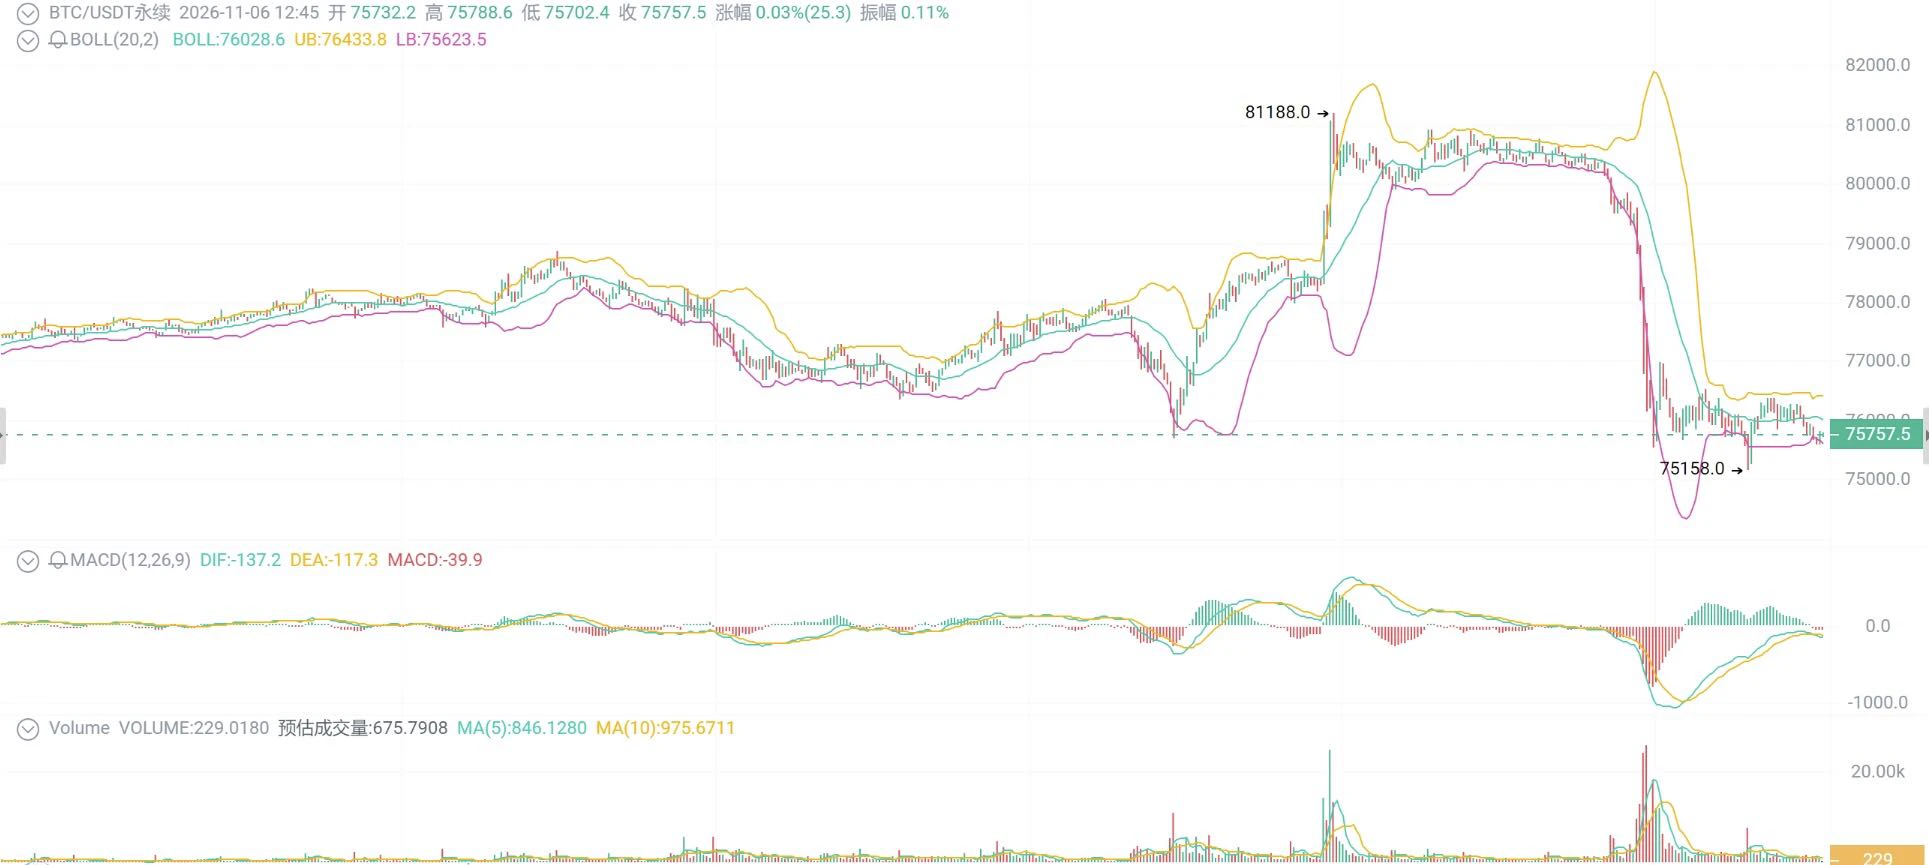
📉11.6 Midday Market Outlook. 📉

$BTC 观点:

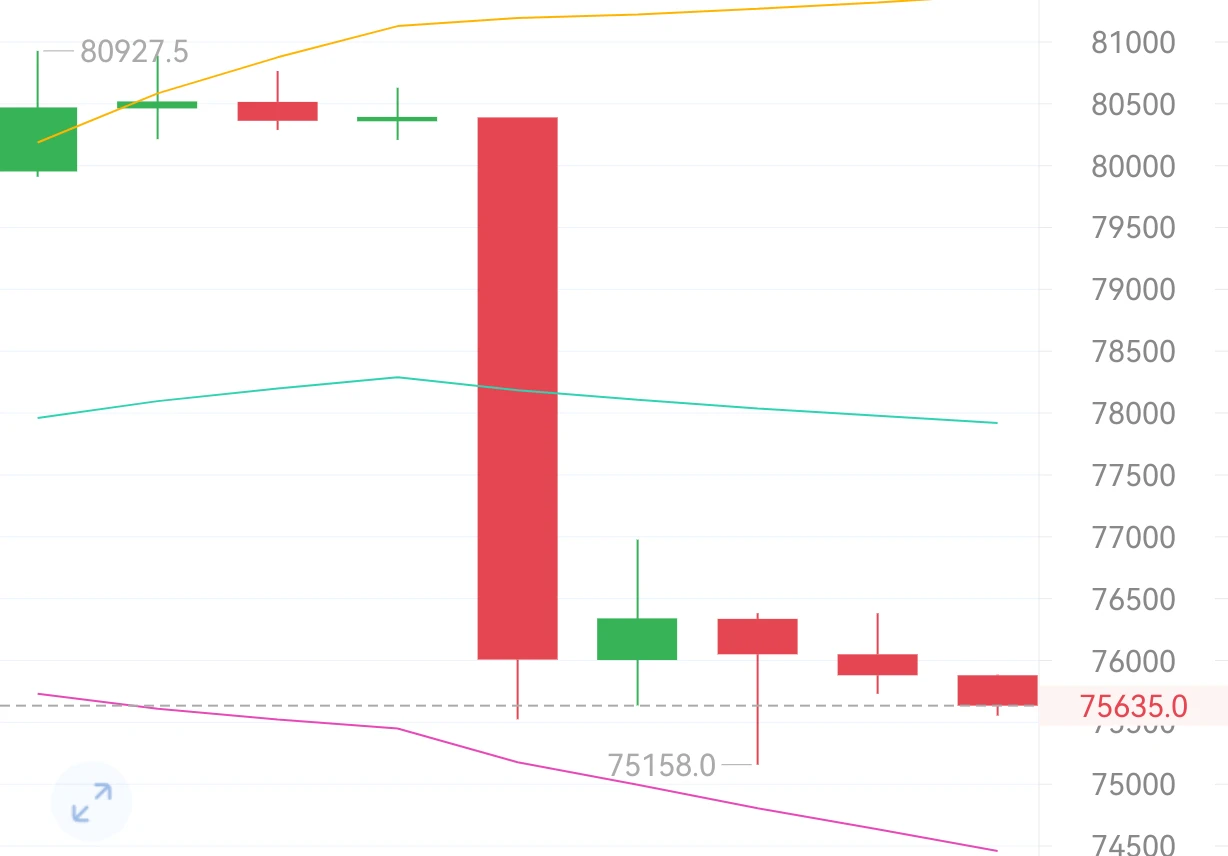
Everyone's confused by this drop😵‍💫. It came so fast, just like the rally the day before yesterday—you barely had time to react before it was over.

Yesterday's drop was the same. Before we even knew what was happening, prices were getting hammered. But remember: no matter how the market moves, it's always right.

BTC pulled another Bart move and fell back inside the megaphone pattern, setting a new low at 75155. Fortunately, it held at the pattern's lower boundary; otherwise, it would have gone straight down to 73863 for a visit.

7628
BTC-0.65%
#每周来晒 #美股史诗级抛售
U.S. Tech Stocks Face a Historic Sell-Off: Is the AI Boom Entering a Deeper Correction?
The U.S. stock market has experienced a significant wave of selling pressure, bringing technology stocks and the artificial intelligence sector into the spotlight. The sharp decline in the Nasdaq, along with heavy losses in major technology and semiconductor companies such as NVIDIA (NVDA) and AMD, has raised important questions about the market's next direction.
This sell-off is more than just a temporary market movement. It highlights how quickly investor sentiment can change when valuat
NDAQ-2.63%
NVDA-9.33%
AMD-17.64%
The fourth trade is already up 8 points. I’ve moved the stop to breakeven—holding tight #Gate安全卫士免费开通
#AsiaPacificStocksPlunge 🔬

Is the sea of red in Asia merely profit-taking?

Those fixated on the massive red percentages flashing across their screens during the historic collapse of Asian markets are missing the true paradox: the very companies that ignited the artificial intelligence revolution are now buckling under the political uncertainty of the future they themselves created.

The wave of selling triggered in global markets following the U.S. midterm elections has swept across the Pacific, striking the heart of Asia’s technology sector with the force of a bombshell. In South Korea, th
post-image
User_any
Don’t let the numbers mislead you; those figures don’t point to a market collapse, but rather to an entirely different structural mechanism.

The real story lies within a historic wave of selling—triggered in the artificial intelligence and semiconductor sectors following the U.S. midterm elections—that rippled across the Pacific all the way to Seoul. What unfolded on Thursday, November 5, 2026, was more than just a correction; it was a watershed moment—a stress test for the AI trade, challenging both its valuations and the underlying policy landscape.

Just how severe was the sell-off on Wall Street?

The wave of selling that hit U.S. markets on Thursday marked the sharpest decline in recent years. The Nasdaq tumbled 5.52% to 24,315 points, falling 11.9% from its early-October peak and officially entering correction territory. The S&P 500 dropped 4.36%, while the Dow Jones slid 3.44%, shedding 1,833 points.

The devastation was most acute in the semiconductor sector. The semiconductor index plummeted 12.25% in a single day—its worst performance since March 2020. The stocks on your screen tell the story: Nvidia fell 9.33%, AMD 17.64%, Micron 17.23%, and SanDisk 22.24%, with various Asian ADRs also posting losses exceeding 10%. In total, approximately $2 trillion in market capitalization evaporated in just one day.

What was the hidden cause behind the sell-off?

There isn’t a single reason, but the midterm elections served as the primary catalyst. The Democrats gaining the upper hand in Congress has raised questions among investors as to whether regulations concerning the construction of data centers might become more stringent.

The market has begun to price in the possibility that the development of data centers—the backbone of the artificial intelligence revolution—could slow down due to new energy and environmental regulations. Signals from newly elected officials in states like Texas, Georgia, and Ohio, suggesting potential restrictions on data centers, have further fueled these concerns. According to one analysis, approximately 30% of the projected data center capacity in the United States through 2028 is now at risk due to potential construction delays.

Compounding this, a chip manufacturer’s announcement of a 26% decline in sales for its mobile phone chips has led the market to wonder: is spending on artificial intelligence beginning to cool off?

How did the shockwave from across the Pacific hit Seoul?

The turmoil on Wall Street spread to South Korea the moment its markets opened. The KOSPI index plummeted by more than 8%, falling below the 5,000-point mark and triggering a circuit breaker just three minutes into the trading session.

Korean corporate giants were at the heart of this collapse: SK Hynix shares fell by as much as 11.71% to 1,116,000 won—a sharp reversal, considering the company had reported record-breaking quarterly sales just a week earlier. Samsung Electronics shares dropped 9.98% to 181,400 won. A similar trend emerged in Japan, where Tokyo Electron, SoftBank, and Advantest saw their values decline by 2.58%, 8.59%, and 5.07%, respectively. Because the stock markets in South Korea and Japan are heavily weighted toward the semiconductor sector, they tend to amplify any technology-related shock originating in the United States. What is the secret behind the "-38" figures on the screen?

The extreme figures—such as -38.65% and +38.64%—seen in the leveraged products in the image do not represent a market collapse; rather, they are the result of reverse splits and the structural nature of leveraged ETFs.

For a product designed to deliver triple the daily performance of an index, a 12% decline in the semiconductor index would mathematically result in a drop of approximately 36%. The 38% decline shown on the screen also reflects a price adjustment following a reverse split. Conversely, a product designed to move inversely to the index (betting on a decline) will rise as the index falls. However, because such funds tend to lose value consistently over the long term, they frequently undergo reverse splits. The +38% increase seen on the screen is actually a byproduct of the consolidation process intended to offset the fund's historical loss in value.

In short, these figures are "structural noise" inherent to the nature of leveraged ETFs; they do not reflect the actual performance of the underlying stocks.

Is this a buying opportunity or a new regime?

The market is currently caught between two opposing scenarios. On one side are those who argue that this is merely a temporary correction—a liquidation of overheated positions in the artificial intelligence sector. On the other side are those who believe that AI valuations remain detached from reality and that this is, therefore, not a buying opportunity.

One thing is certain: the market is no longer driven by the same narrative. The triad of valuation, policy, and liquidity is being recalibrated. It would not be surprising to see further macro shocks of this nature until regulations regarding data centers in the United States are clarified. What you should monitor is the distinction between technical price adjustments in leveraged products and the primary market trend; the extent to which the declines in Seoul and Tokyo are driven by regulatory uncertainty in the United States; and whether semiconductor companies—despite these policy-related headwinds—are managing to maintain their order backlogs.

This content is for informational purposes only and does not constitute investment advice.

$MU $AMD $SNDK $TSLA $INTC
#USStocksFaceHistoricSelloff
#GateSquareTradingChallenge #Gate股票畅聊季 #GateStockTalkSeason #ShareWeekly
repost-content-media
HK50+0.17%
JPN225+0.33%
NAS100+1.26%
US30-0.48%
  • 14
  • 1
Bitcoin outlook: At this stage, we are bullish and looking for suitable opportunities to go long at lower levels. This pullback is more of a deep shakeout during the uptrend and has not directly damaged the broader bullish structure. After repeated tests of key support below, buying interest has continued to come in.

Although the short-term market may remain choppy, downside momentum is weakening, and conditions for a bullish counterattack are gradually maturing. A reminder to everyone: being bullish does not mean entering blindly. Entry levels are crucial. Chasing highs carries very high ris
post-image
BTC-0.65%
ETH-1.23%
SOL-0.74%
$MSTU Down 21.67% in a day—this isn’t a pullback; someone just flipped the table.
Last night, the group was still shouting “to 33”; today, it hit a low of 23.69, with the price now at 25.63 and 24-hour trading volume at $11.1 million. What does that mean? It’s like the entire day’s sales of a medium-sized mall being crammed into this one coin, with everyone rushing for the exits. From a high of 33.02 to a low of 23.69, the range was nearly 40%. Anyone who chased the price higher this morning now has an account that feels like it’s on a drop tower ride.
In plain English: it’s like cabbage going
MSTU-3.61%
  • 6
  • 1
#ETHDrops5.5%
Ethereum is facing renewed selling pressure as its price drops approximately 5.5%, putting the broader cryptocurrency market on alert. The decline comes during a period of increased volatility across digital assets, with investors becoming more cautious about risk exposure and short-term market direction.

Ethereum remains one of the most important assets in the cryptocurrency ecosystem. It supports decentralized finance, smart contracts, stablecoins, NFTs, and thousands of blockchain applications. However, even a leading cryptocurrency is not immune to sudden corrections when m
ETH-1.26%
BTC-0.67%
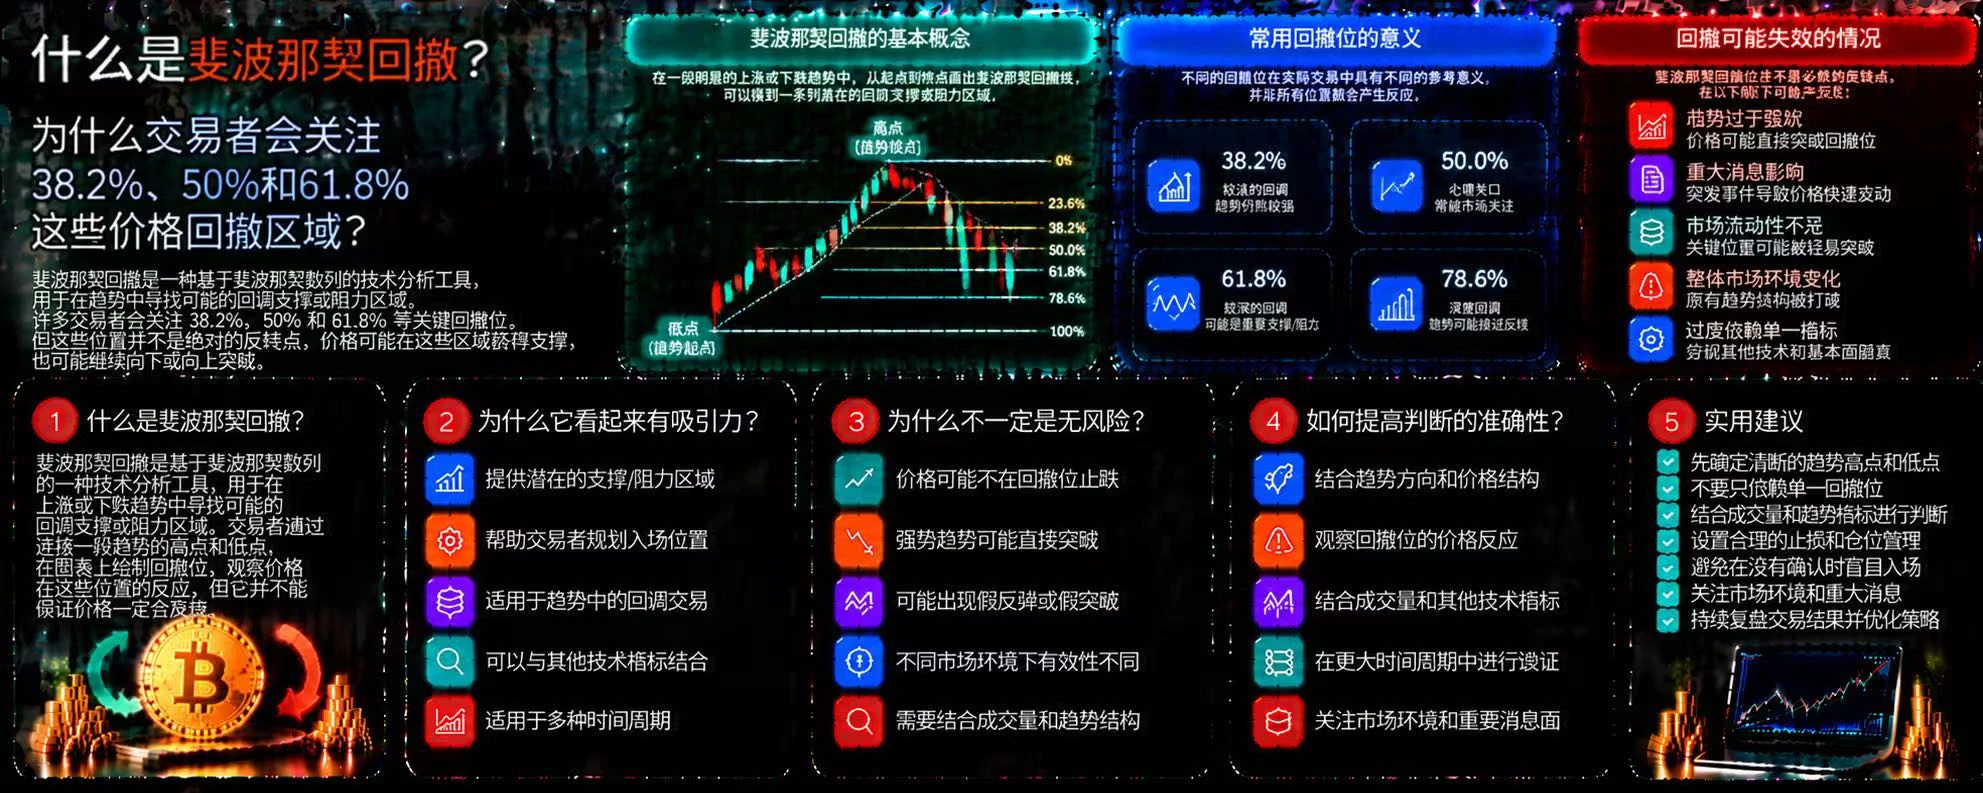
What Is Fibonacci Retracement? Why Do Traders Focus on the 38.2%, 50%, and 61.8% Price Retracement Levels?

In crypto trading, prices often pull back after rising and may also rebound after falling. Fibonacci retracement is a common technical analysis tool that traders use to identify potential support and resistance zones based on specific ratios. However, these levels are not guaranteed reversal points, nor do they guarantee profitable trades.

First, what is Fibonacci retracement?

It calculates different retracement levels between the start and end points of a clear price move, helping tra
post-image
#AsiaPacificStocksPlunge $SKHY $TSM $SAMSUNG $JPN225
Asia Pacific Stocks Plunge: AI Reset or a Wider Risk-Off Move?

Asia's latest selloff was more than an ordinary red trading session. South Korea's KOSPI fell more than 8% at one point on November 6, triggering a 20-minute circuit breaker. Japan's Nikkei 225 dropped around 6%, while Taiwan's benchmark index lost more than 8%.

The speed of the decline tells us how crowded the technology trade had become. But the bigger question is whether investors are simply reducing expensive AI exposure or beginning to question the wider outlook for Asian
SKHY-13.03%
TSM+0.39%
SAMSUNG-0.12%
JPN225+0.33%
  • 5
  • 1
What Is Trendline Trading? How Can You Identify a Valid Trendline, and Why Might the Same Trendline Be Broken Repeatedly?

In cryptocurrency trading, trendlines are an intuitive technical analysis tool. By connecting a series of price highs or lows, traders can observe the market’s overall direction and look for potential entry and exit opportunities. But trendlines are not unbreakable boundaries; no matter how neatly they are drawn, they cannot guarantee that prices will move as expected.

First, what is trendline trading?

Trendline trading involves connecting significant price highs or lows
post-image
$XAUUSD When trading gold, do you think technicals and news matter more, or is position sizing more important?
XAUUSD-1.01%
Rewards are being distributed! Open your mystery box now and win up to 100 USDT worth of tokens!
U.S. Crypto Regulation Advances on Two Fronts
live-cover
LIVE2,086
Why Are You More Likely to Make Mistakes After a Winning Streak?

There is a situation worth watching out for in cryptocurrency trading:

When you first start trading, you are cautious. Every time you open a position, you consider your stop-loss, position size, and risk.

But after several consecutive wins, you start to feel that you have figured out how the market works.

So you gradually increase your position size, widen your stop-loss, and even start skipping the trading conditions you had originally set.

Then, one market reversal quickly wipes out the profits you had accumulated.

Why do
post-image
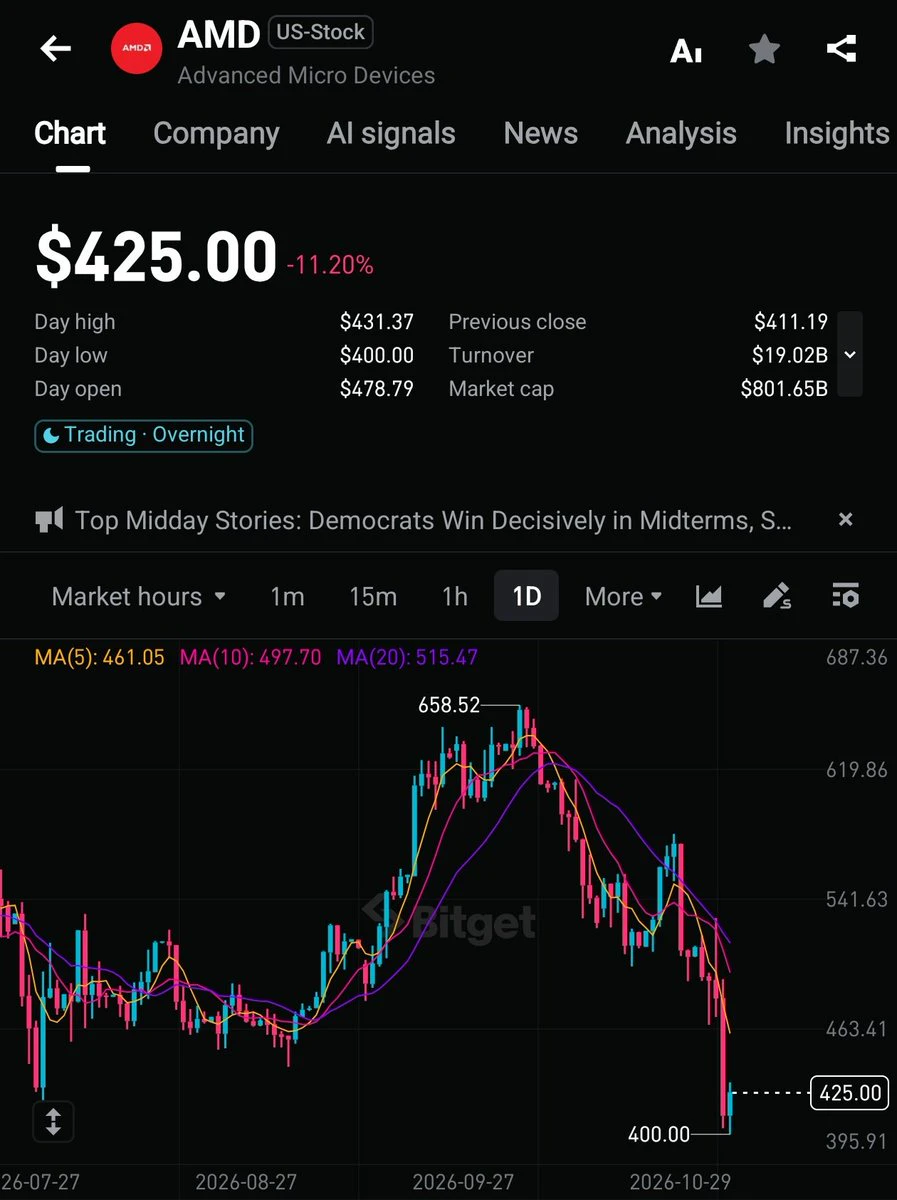
$AMD just got destroyed.
Record quarter.
Data Center nearly doubled.
Guidance crushed.
Lisa Su talking 80%+ growth next year.
Then Democrats swept Congress and the stock dumped 17% on AI regulation fears.
Politics > fundamentals. For now.
Still bullish or is the AI trade broken? 👀
post-image
AMD-17.64%
  • 4
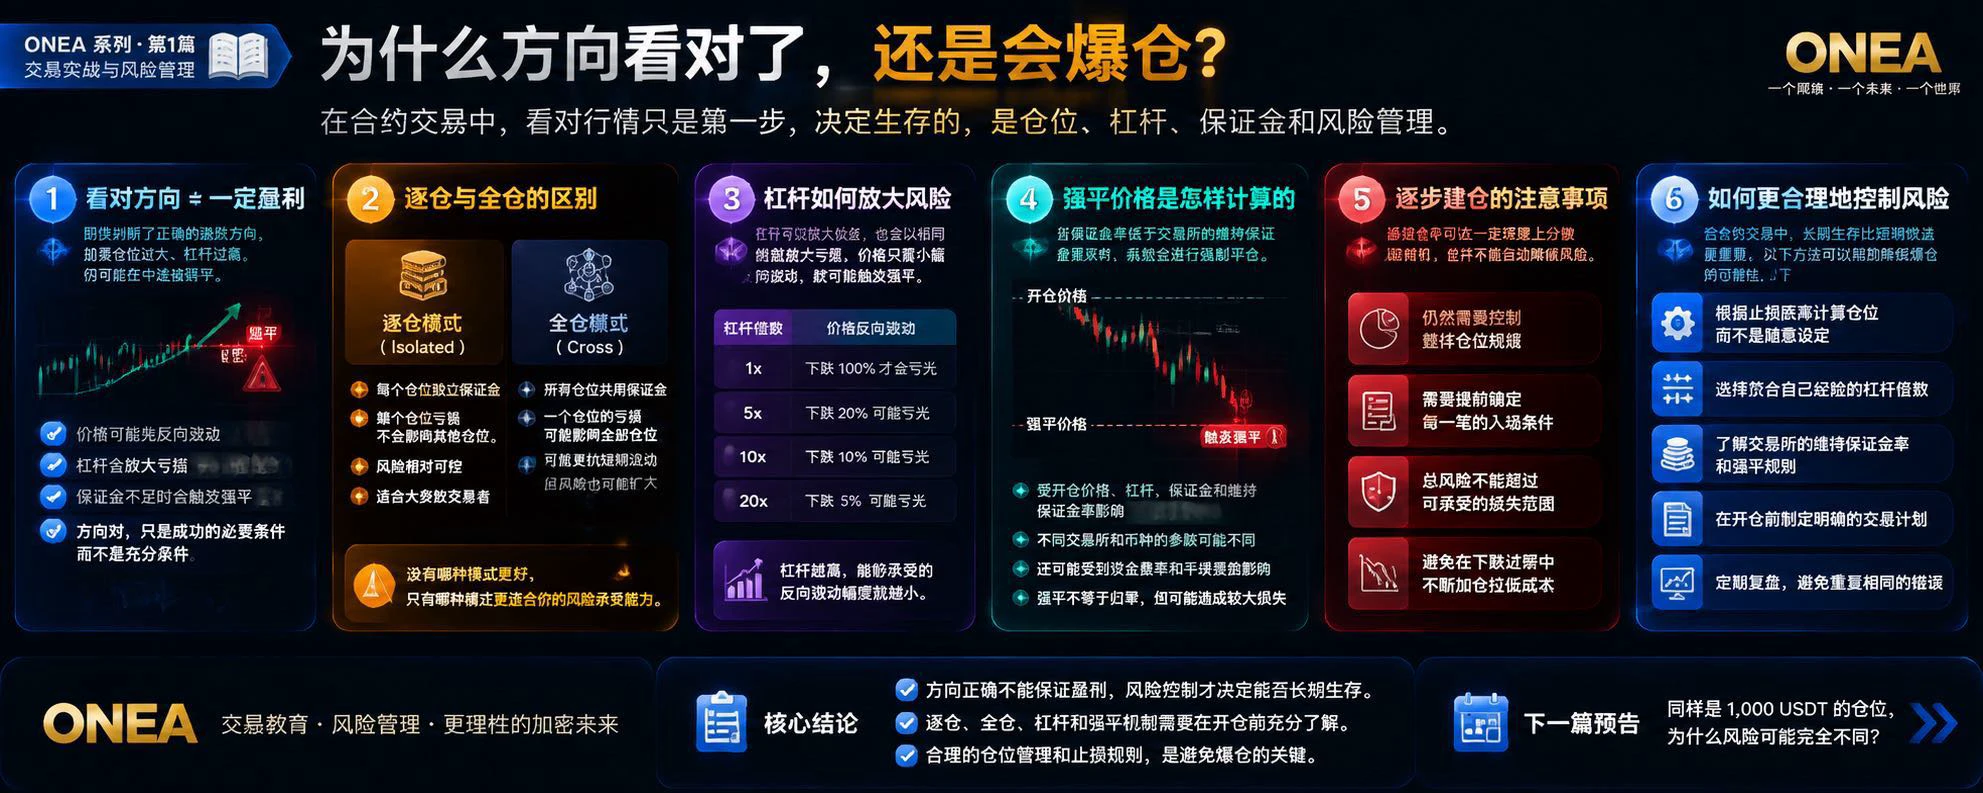
Why Can You Still Get Liquidated Even When You Get the Direction Right? Risk Management Is What Really Determines Whether You Survive in Trading

In the cryptocurrency market, you may have experienced this:

You predicted that BTC would rise, and the market did eventually go up.

But before the rise happened, your long position had already been liquidated.

You predicted that ETH would fall, and you ultimately got the direction right, but your position was too large and your leverage too high to withstand the interim move in the opposite direction.

Why can you still lose money even when you g
post-image
BTC-0.65%
ETH-1.23%
11.6 Analysis$BTC
Yesterday’s Bart pattern—everyone who followed along and traded must be thrilled, right? A rally with no reason is a bubble. This bear market will most likely bottom in November 2026. We’re currently at the end of the time window, not the beginning. More importantly, there’s the interest rate path: the market has never stopped betting on the Fed pivoting to rate cuts. Once dovish signals are confirmed, the historical pattern of liquidity flowing back into crypto assets still holds. In other words, the macro factors suppressing prices are precisely the fuel for a future rever
post-image
BTC-0.67%
ETH-1.26%
Load More

Join 40 M users in our growing community

⚡️ Join 40 M users in the crypto craze discussion

💬 Engage with your favorite top creators

👍 See what interests you

Trending Topics

USStocksFaceHistoricSelloff

1.63k Views3.55k Discussing

U.S. stocks suffered a sharp selloff on Thursday, with the Nasdaq closing down more than 5% and the Philadelphia Semiconductor Index falling over 12%. AI and chip stocks including $NVDA and $AMD were hit especially hard. Markets are reassessing AI valuations, data-center spending and future returns. Is this just short-term deleveraging, or the start of a deeper correction in the AI trade? Which sectors are you watching next?

GateLaunchesPoSECProofOfSecurity

12.56k Views577 Discussing

USNonfarmPayrolls

9.83k Views4.01k Discussing

View More