
Square
Following
Hot
News
Notifications
Profile
Share your thoughts
placeholder
Article
There are rumors that this gentleman, who lived almost 200 years ago, could be responsible for Bitcoin’s crash.
His name was Bernhard Riemann.
Can anyone confirm?
post-image
BTC-0.67%
$VELVET Fully exited, buying the dip in Bitcoin and Ethereum
post-image
VELVET-3.58%
Trenches
FIONA
F
bade
b
FIONA
B34n...pump
Market Cap
$.
Change
.
24h Vol
$.
Holders
.
PIEVERSE
P
bade
b
PIEVERSE
0x0e...25a9
Market Cap
$.
Change
.
24h Vol
$.
Holders
.
mihao
m
bade
b
mihao
4Cxj...pump
Market Cap
$.
Change
.
24h Vol
$.
Holders
.
PROS
P
bade
b
PROS
0x8b...9832
Market Cap
$.
Change
.
24h Vol
$.
Holders
.
CLAUDIA
C
bade
b
CLAUDIA
2j5S...W2ZM
Market Cap
$.
Change
.
24h Vol
$.
Holders
.
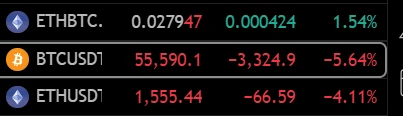
Another weekend where BTC fell more than ETH
If I remember correctly, last weekend was the same
It was the same during the June bottoming: BTC broke support 【ETH didn't】
Same today: BTC has already broken support 【even dropping below $2,000】
ETH still hasn't broken below its June low
So strange, so strange
post-image
BTC-0.67%
ETH-1.26%
  • 1
5555555~ I’m crying very quietly😭
post-image
  • 2
  • 2
$SOXL This latest downturn has probably buried a lot of dip-buying money😇 Prices were still around $100 in late October; now they’re down to about $32, a drop of nearly 70% in just over three weeks. Last night brought an even sharper single-day plunge, with nearly the entire semiconductor sector crashing. Core stocks like NVDA, MU, and AMD all faced intense selling. The most frightening thing about SOXL is its 3x daily leverage mechanism: leverage resets every day, meaning long-term returns depend on the entire price path. During a sustained downturn or sharp volatility, the compounding effe
post-image
SOXL-1.16%
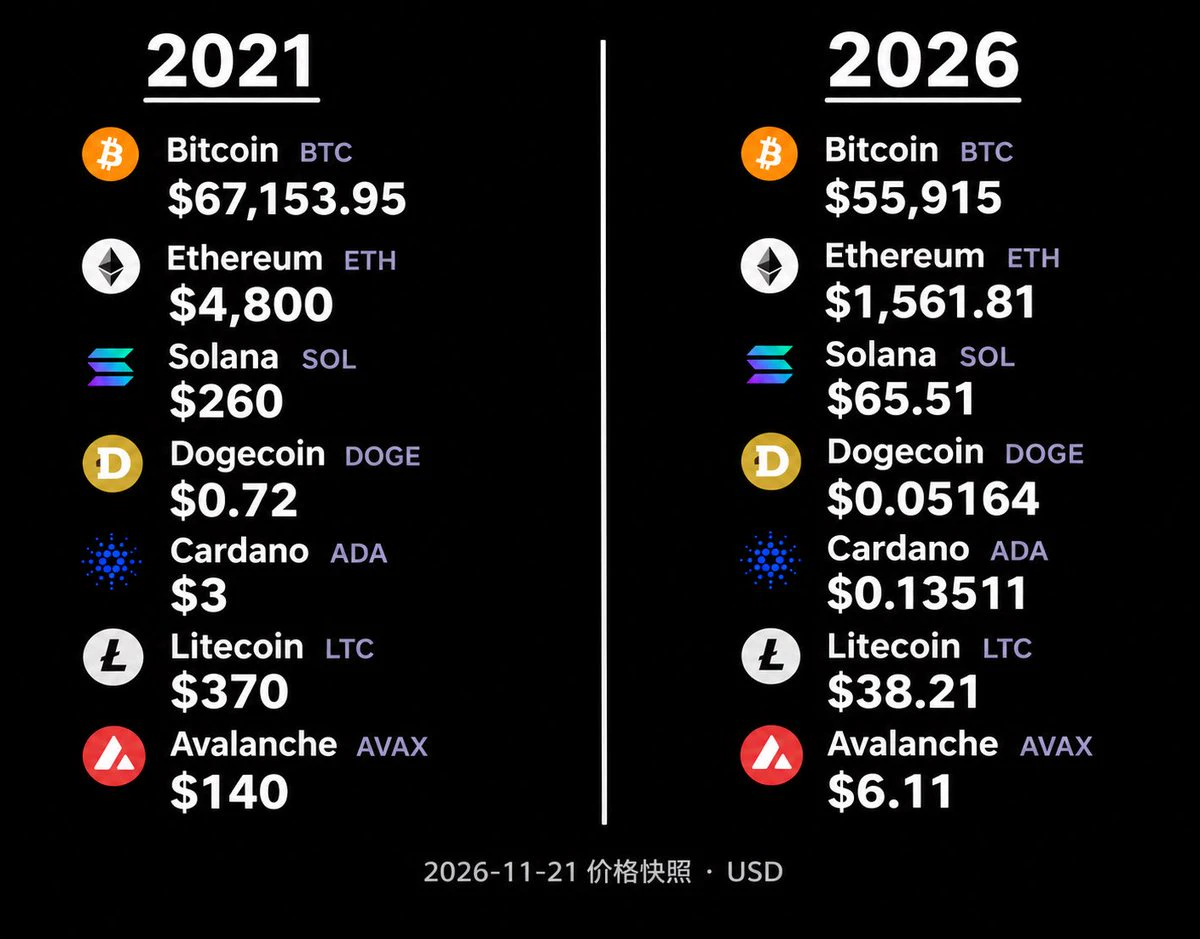
Five years have passed, and $BTC is back at its price from five years ago. Many altcoins have even fallen by more than 90%.
Over these five years, we experienced bull markets, bear markets, surges, and crashes.
Some people saw their investments grow tenfold, only to lose it all and end up back where they started.
Some endured the entire bear market, only to exit just as the bull market was beginning.
Others did nothing and held on for five whole years, yet their accounts are still in the red.
The most ironic thing is that even though we experienced so many rallies, we may never have actually
post-image
BTC-0.67%
  • 1
Market update
live-cover
LIVE2,302
BCH+1.05%
$ETH Is the big counteroffensive starting? It's just an oversold bounce; it still has further to fall, so keep shorting
post-image
ETH-1.26%
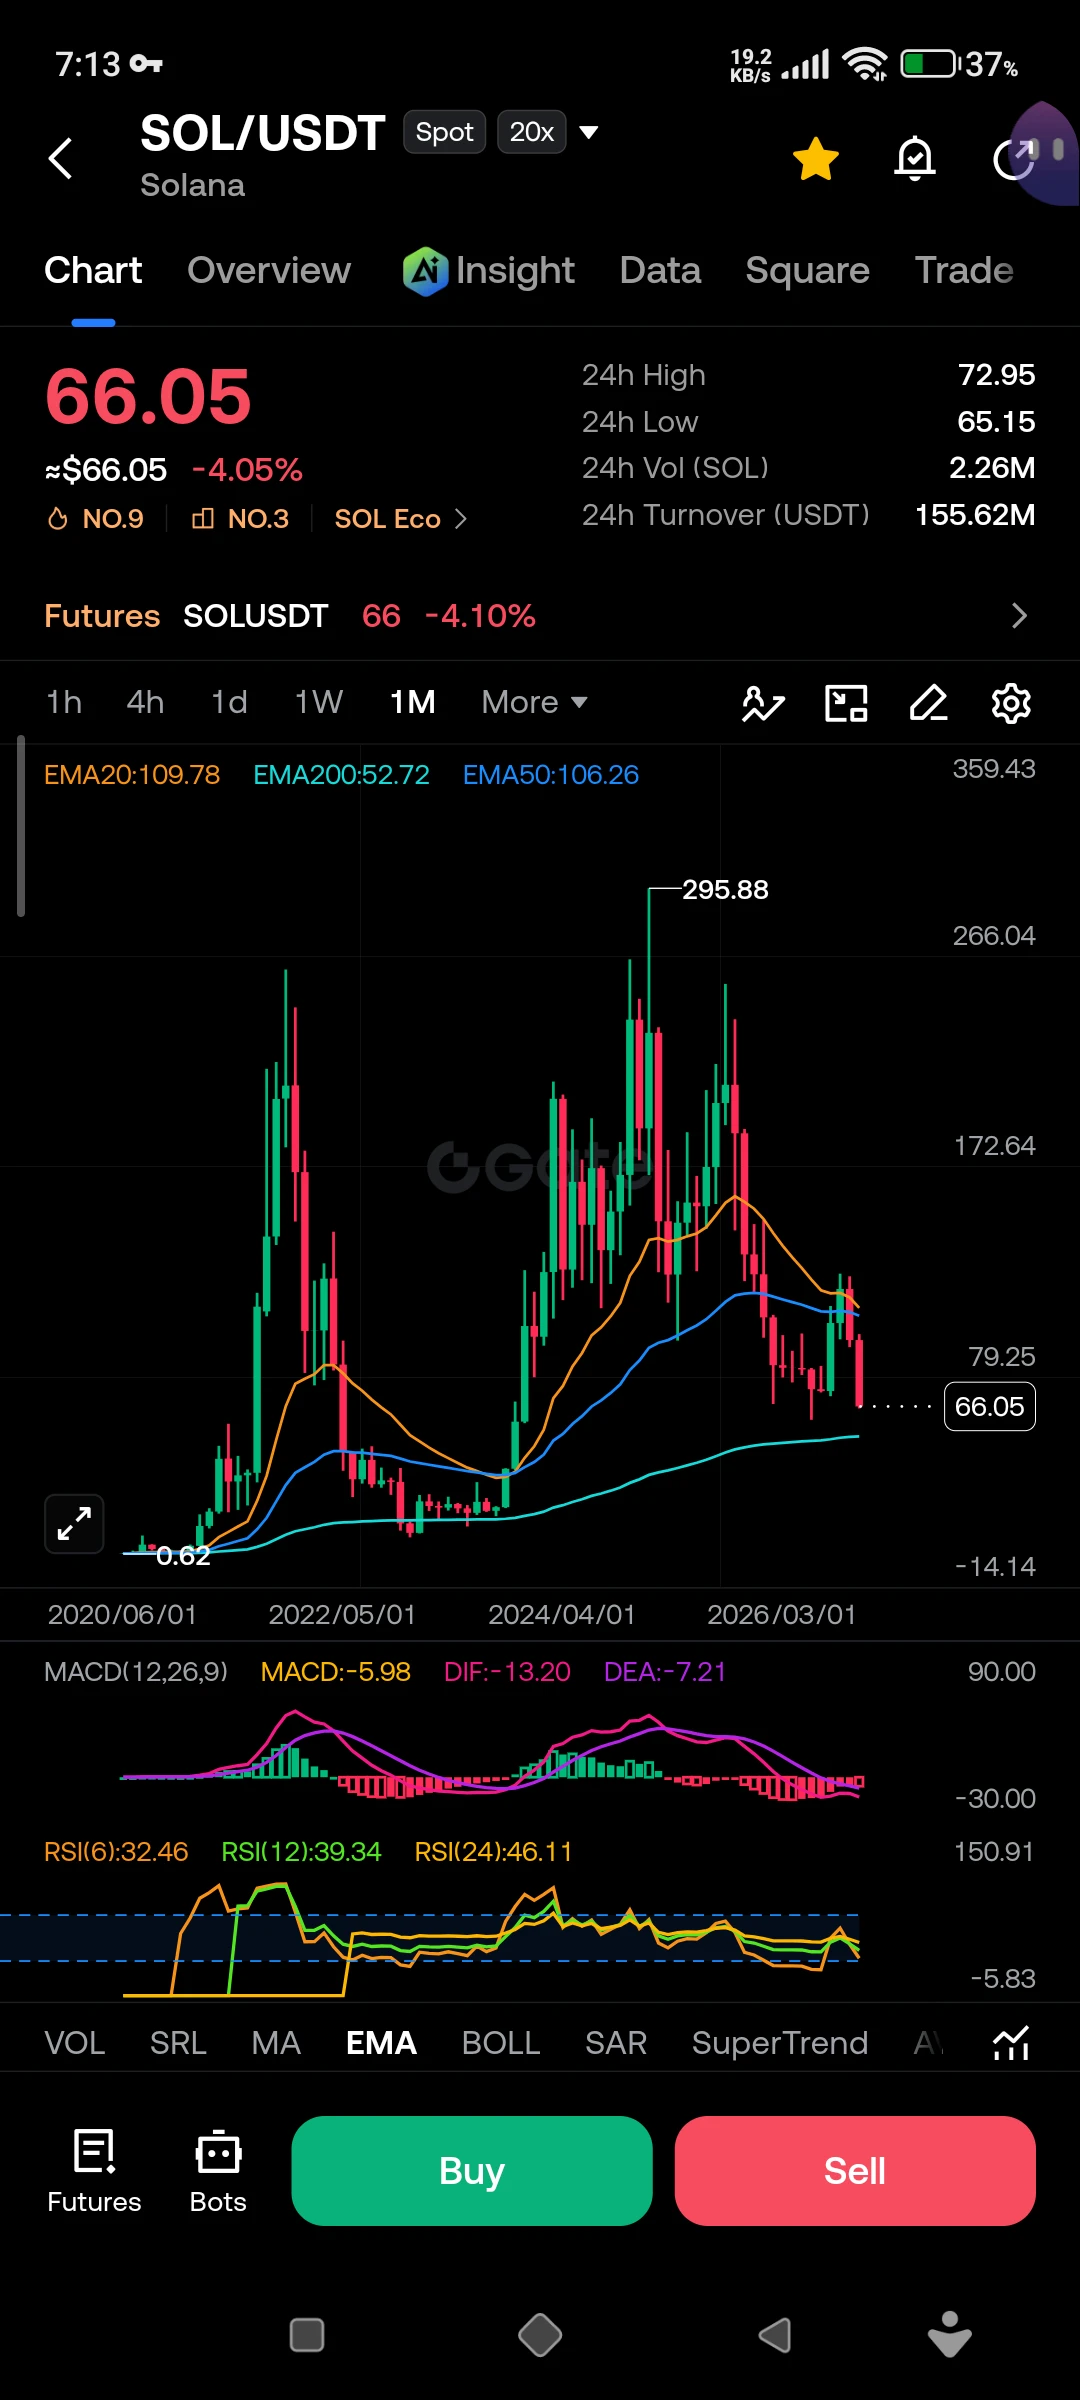
Does anyone else feel that the upward momentum here is nearly exhausted? $EVAA failed to break through its recent high, and buyers quickly went quiet. It looks like we should catch our breath before seeing what happens next. I think all we can do now is wait patiently. Take profit: 5.85Stop loss: 6.5881Other coins: $BLESS : Current price 0.015298 - 24-hour change: +19.70%$SOL : Current price 65.84 - 24-hour change: -9.34%
post-image
EVAA-0.49%
BLESS-2.00%
SOL-0.77%
This price is crazy—I lost 120U because of it
post-image
#USNOVJoblessClaimsBeatExpectations 🇺🇸 US November Jobless Claims Beat Expectations: What Does It Mean for the Economy and Crypto Market?

The latest US unemployment data is attracting attention from investors as new jobless claims remain relatively low, highlighting continued resilience in the American labor market. However, the latest figures also came in slightly above economists' expectations, creating another important signal for financial markets and Federal Reserve policy.

📊 1. Latest US Jobless Claims Data

According to the US Department of Labor, initial jobless claims for the wee
post-image
BTC-0.67%
USIDX-0.09%
  • 2
I just checked the price from when I first got into crypto as a college freshman 😂—after five years of ups and downs, it's back where it started.
ETH | Short 🔴 | Bearish | 15m 24h: -10.40% | Volume: 15937.3M USDT Short rationale: Price below EMA200; EMA20/50/200 in bearish alignment; RSI14 at 33.1; MACD histogram is negative; ADX14 at 45.7; volume is 0.50 times the 20-candle average; trend pullback/continuation. Entry: 1561.45 Stop-loss: 1609.98 TP1: 1500.79 | TP2: 1464.4 | TP3: 1415.87 Entry price is for reference only; do not chase the price. This strategy is invalidated if the stop-loss price is hit. Technical analysis strategy only, not investment advice. $ETH
post-image
ETH-1.23%
$AKE The risk-off period is over. I’ve closed out everything. Bye
post-image
AKE+6.07%
$CL Crude oil plunged from above $100 at the end of October to around $82. I caught it at the panic low, and now it’s back above $83, with floating profits of more than 130 points. I got the direction right and nailed the entry—this is one of my best directional trades lately. But I don’t want to talk about direction. I want to talk about costs.

With a 100x leveraged position, funding fees scale up by the same multiple, so I’m paying every settlement period. And crude oil is priced half on supply and demand, half on the news—overnight gaps are commonplace.

More subtly, my entry at $82 is jus
post-image
CL-1.83%
BTC FUTURE MARKET PREDICTION
live-cover
LIVE1,757
BTC-0.67%
$SOL bought more SOL.

Still risky at this stage, but I'm accumulating and putting it into my Smart Rebalance bot until the market picks up again.

patience pays off.

$NVDA ‌$SOL
post-image
SOL-0.77%
NVDA-13.84%
  • 1
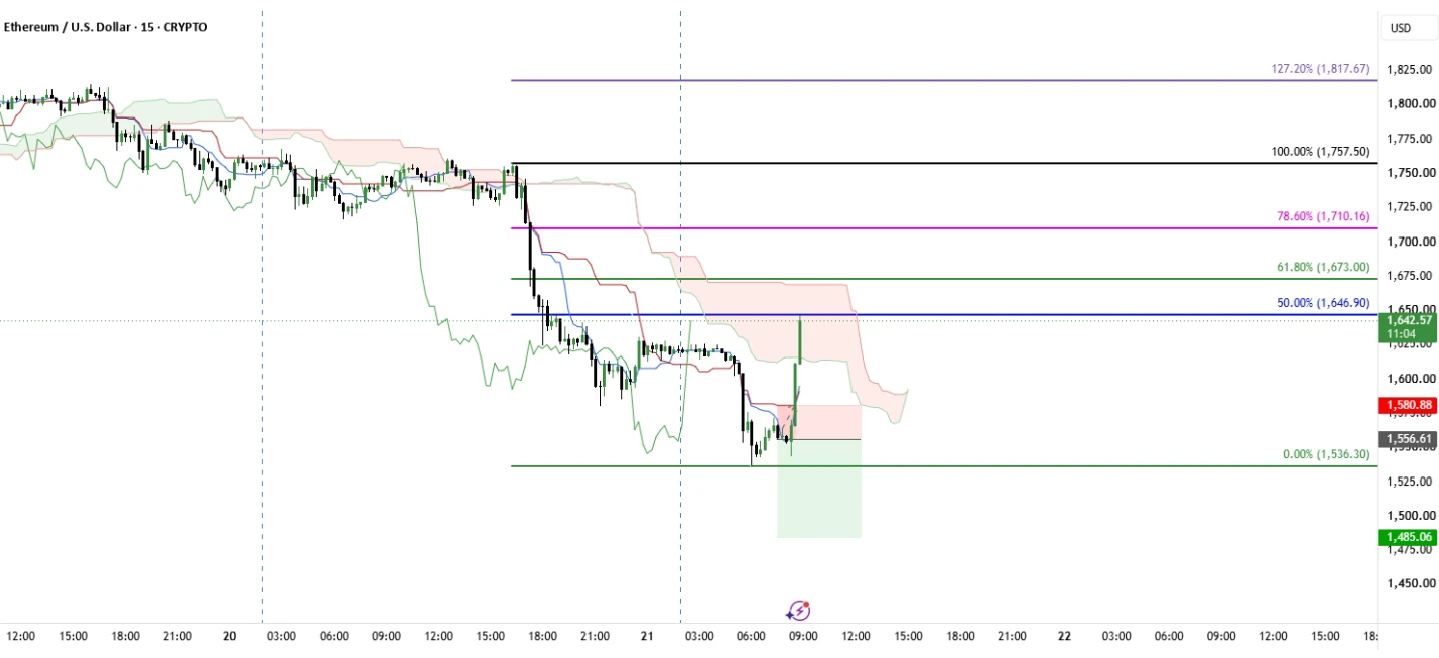
ETHUSD | Bullish Counter-Trade Setup

ETH is attempting a short-term recovery after an extended bearish move. Following the previous stop-loss hit, price has produced a sharp bullish impulse on the 15-minute chart. However, the overall market structure remains bearish, making this a counter-trend trade rather than a confirmed reversal.

Market Structure

ETH previously declined from the $1,800–$1,825 region toward the $1,536.30 low before buyers stepped in and triggered a sharp rebound. The latest bullish candle pushed price toward $1,642.57, approaching the 50% Fibonacci retracement level at
post-image
ETH-1.26%
I’ve been completely out of crypto for a year and a half, and I just bought in with 10% to test the waters.
That’s how this stuff works: people who don’t know what they’re doing always think it’ll go up after falling too much and go down after rising too much. I’ve waited a year and a half—I’m only interested in picking up bloodied chips. I reckon the bottom will be around Christmas; there’s probably another month of declines. Those who know me know I’ve been saying this for a year: BTC at 48,888, ETH at 1,300. It had already climbed so high, but I kept waiting, and everyone thought I was craz
post-image
BTC-0.67%
ETH-1.26%
How many bros are like this$BTC ‌
post-image
BTC-0.65%
  • 4
  • 1
Load More

Join 40 M users in our growing community

⚡️ Join 40 M users in the crypto craze discussion

💬 Engage with your favorite top creators

👍 See what interests you

Trending Topics

BTCBreaksBelow60K

2.1M Views29.1K Discussing

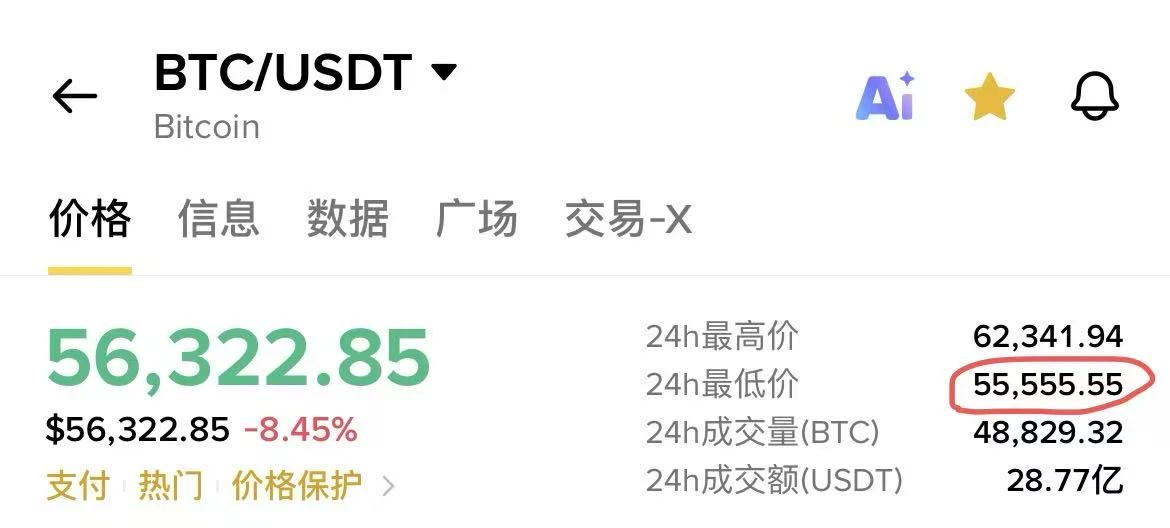
BTC fell below $60,000 on November 20 for the first time since July, alongside a tech stock selloff and broader pressure on risk assets. Will $60K become resistance, or can BTC quickly reclaim it? What price or volume signals would convince you that selling pressure is easing?

GateDirectIPOPhase3ANTAllocates92100Shares

735.3K Views4.8K Discussing

NvidiaDropsNearly14Percent

308.8K Views7.5K Discussing

View More