Share your thoughts
placeholder
Article
JUST IN: No fact pattern available from the provided link. Please paste the key alert or summarize the alert you want transformed.
post-image
This trend doesn’t even require me to think—the account is out there dancing on its own.

During the repeated intraday fluctuations, $BTR surged to 0.17647. It looked like a breakout on the surface, but the volume didn’t follow, so there was simply no one buying up there. I opened a short position directly at that level, waiting for the false breakout to reverse on its own.

I took another look before the close, and 0.04843 had already returned to my expected range, putting +1428.51% in my pocket. I held the short without letting go, trusting this resistance level. I didn’t make a rash move
post-image
BTR-6.37%
BNB+6.20%
DOGE+6.53%
The short position from a few days ago was somewhat painful to hold. First, a wick spike swept upward, causing a small loss. Fortunately, the position was not large, so I did not stop out immediately. I only felt relieved after the price fell back below my entry cost. My reasoning for calling the high at the time was that a lot of trapped positions had accumulated around that level, while the bulls had made several attempts to break through without any obvious volume support. Personally, I felt the momentum for further upside was limited. The market did indeed pull back afterward, and the floa
post-image
LAB+0.84%
SNDK+1.95%
A few days ago, I checked $AKE ’s chart before going to bed. After a series of small bullish candles formed, I chose not to add to my position, but moved up the take-profit level for my long position first. I entered around 0.0129703, and the current price is 0.0183729, giving an unrealized gain of +1022.45%.
Since the area above was a previous high-volume trading zone, I did not close everything at once. Instead, I first closed 70% of the position and moved the take-profit level for the remaining 30% above the entry price, letting it run a little longer.
The difficulty at this level is that t
post-image
AKE+18.45%
ZEC+5.75%
SNDK+1.95%
After closing 70% of the position, the hardest part is not continuing to hold, but not immediately opening another trade. Before entering this $LTC long, the market had been ranging for quite some time. I gave up trying to guess the direction in advance and only followed after the price genuinely broke out of the range. The entry was not particularly early, but the structure was clear, making it easier to hold with confidence.

There was one pullback while holding the trade, which happened to test the protective level I had set. I was already prepared to be stopped out, but the price recovere
post-image
LTC+6.16%
ADA+5.32%
XRP+1.26%
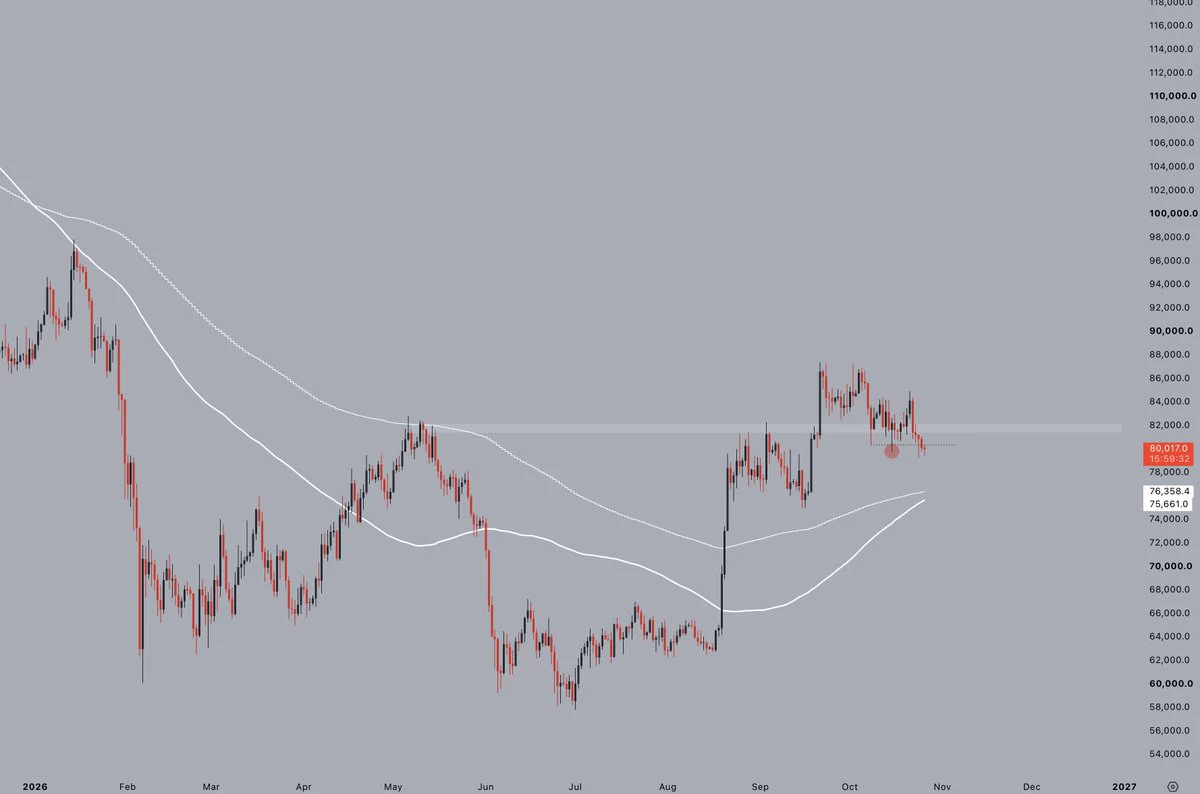
Bull-Bear Divide Deepens Around $82K! B.TOP Founder Sells All His BTC
live-cover
LIVE10
Wait
What’s this
Who let the ___ out
@spark888 @惜风 @brocoliwang
I originally just wanted to mooch a breakfast, but the market ended up making dumplings out of me for half a year. I opened the charts this morning, and before my eyes were even fully open, I saw the price bubbling up on its own. A few days ago, while watching the market in the early hours, $TAC had been moving sideways at the bottom. Everyone was waiting and watching. I stared at the order book for a while and saw funds entering slowly but steadily, with small orders constantly providing support at the bottom. In situations like this, I don't hesitate—I reached in and bought some around 0.002
post-image
TAC-2.93%
ZEC+5.75%
LAB+0.84%
Why the quiet RSI at 47 might be the loudest SHORT signal on $SNDK /USDT tonight.

$SNDK /USDT - SHORT

Trade Plan:
Entry: 1759.03 – 1763.69
SL: 1790.42
TP1: 1739.57
TP2: 1725.04
TP3: 1703.24

Why this setup?
The 4H timeframe is flashing a 77% confidence SHORT while the 1D trend sits in a range—not a breakout. Price is hovering at 1761.36, with immediate downside targets at 1739.57 (TP1) and 1725.04 (TP2).
- The 15m RSI at 47.54 shows no oversold bounce fuel, meaning sellers still control the micro-momentum.
- ATR of 9.31 on the 1H confirms enough volatility to travel 22 points to TP1 w
SNDK+1.95%
btc update
live-cover
LIVE673
Everyone’s still watching $LAB /USDT—but the 4H chart just flashed a signal most traders will ignore until it’s too late.

$LAB /USDT - SHORT

Trade Plan:
Entry: 0.07503 – 0.07549
SL: 0.07746
TP1: 0.07361
TP2: 0.07251
TP3: 0.07087

Why this setup?
Why now? The 1D trend is bearish, and the 4H MTF confirms SHORT with 95% confidence. Price is hovering at 0.07526, just below invalidation at 0.07431. RSI on 15m shows 61.25—a dead-cat bounce losing steam. ATR (0.000915) says volatility is contracting, but that’s the calm before the dump. Targets: TP1 at 0.07361, TP2 at 0.07251, TP3 at 0.07087. Th
LAB+0.84%
[$牛来 Signal] Long + 4H bullish continuation
$牛来 current price 0.12198, 4H MACD histogram 0.0053 showing bullish expansion, 1H MACD histogram -0.0004 with the negative value narrowing. 1H rebounded from 0.11173, and the price touched the 4H Bollinger upper band at 0.1215. Order book depth imbalance is -14.11%, Bid/Ask 0.75, with sell-side depth prevailing.
🎯Direction: Long
⚡Entry/Limit order: 0.1216141 - 0.1219800
🛑Stop-loss: 0.1207602
🚀Target 1: 0.1238097
🚀Target 2: 0.1247246
🛡️Trade management:
- Execution strategy: After reaching Target 1, reduce the position by 50% and move the stop-lo
post-image
牛来+43.77%
BTC+0.31%
ETH+1.61%
SOL+1.64%
$ESPORTS , hurry up and go to zero—delist it.
post-image
ESPORTS-1.66%
Everyone’s staring at SOL’s 103 handle—but the real trap is hiding in the 4-hour timeframe.

$SOL /USDT - SHORT

Trade Plan:
Entry: 103.20 – 103.54
SL: 105.02
TP1: 102.14
TP2: 101.31
TP3: 100.08

Why this setup?
Why now? The 1D is range-bound, but the 4h bias just flipped SHORT with 55% conviction. RSI on the 15m sits at 52—no momentum rescue. ATR (1h) is thin at 0.68, meaning price can slide quietly toward TP1 (102.14) and TP2 (101.31) without loud volume. Entry zone is tight: 103.20–103.54. If we lose 102.50, the setup invalidates fast—so this is a scalper’s window, not a swing.

Debate:
SOL+1.64%
Very nice, productive day for $NEAR. Very good movement with over 2 billion market cap overall. The trading volume is up over 109 percent in the last 24 hours. So more and more traders are trading NEAR protocol
The AI agent element has been good. You can get AI options and interference by staking NEAR Protocol. Plus, big-time companies and institutions are adding more NEAR Protocol.
The movement is real here. The chart is saying that if the support can hold the current price of $2.20, it can begin to test the $2.30 price level or even higher. I call that a big win.
post-image
Everyone’s watching $MU /USDT for a breakout—but the 4H chart just whispered a secret the crowd missed.

$MU /USDT - SHORT

Trade Plan:
Entry: 1015.38 – 1017.00
SL: 1026.36
TP1: 1008.56
TP2: 1003.48
TP3: 995.86

Why this setup?
- RSI (15m) at 47.92—no momentum spike, just sideways exhaustion.
- ATR (1H) at 3.25 shows shrinking volatility, priming for a sharp squeeze lower.
- 1D trend is *range*—so we’re not chasing; we’re fading the top of the box at 1016.19.
- TP1 at 1008.56 is 0.75% away; TP2 at 1003.48 is the real magnet if 1015 support cracks.

Debate:
Is 1016 the fake ceiling be
MU+0.73%
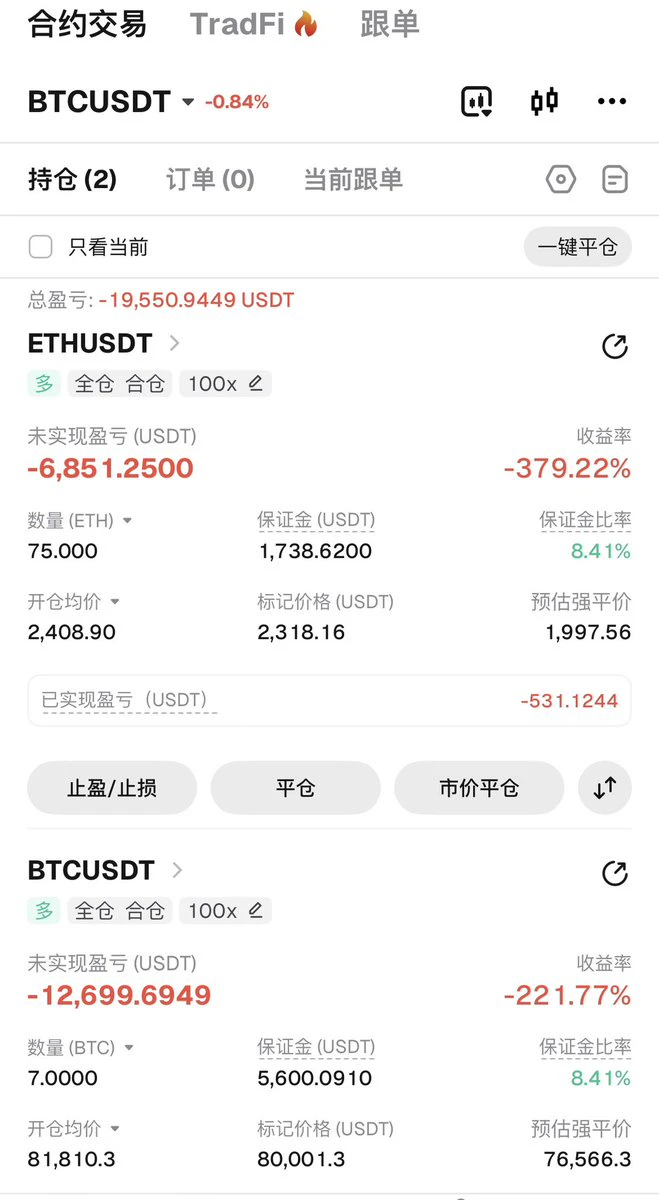
Called for market support and got buried!!!
post-image
WLD's 4h chart is whispering a short—but 55% confidence means the market is laughing at certainty.

$WLD /USDT - SHORT

Trade Plan:
Entry: 0.3960 – 0.3982
SL: 0.4076
TP1: 0.3892
TP2: 0.3839
TP3: 0.3760

Why this setup?
Why now? The 1D trend is *range*, not breakout—so mean-reversion rules. RSI on 15m sits at 51.01, dead neutral, giving price room to drop without overbought friction. Entry ref at 0.3971, with TP1 at 0.3892 (a clean 2% sweep) and TP2 at 0.3839—that's where the range's lower lip likely bites. ATR on 1h (0.004387) is tight, so the move should be slow, not violent—perfect for a
WLD+3.61%
$DOGE funds have entered, sending Dogecoin higher. Are they all betting on a rocket launching with a single Dogecoin aboard?
post-image
DOGE+6.51%
#BTCReclaims80K BTC Reclaims $80K, Market Confidence Returns
Bitcoin reclaiming the $80,000 level is more than just another move on the price chart. It represents an important psychological milestone for the market, because round-number levels often become powerful areas where traders decide whether momentum is strong enough to continue or whether another correction could begin.
The recovery above $80K shows that buyers are willing to step back into the market after periods of uncertainty. When Bitcoin successfully moves back above a major psychological level, market sentiment can change quick
BTC+0.31%
Load More

Join 40 M users in our growing community

⚡️ Join 40 M users in the crypto craze discussion

💬 Engage with your favorite top creators

👍 See what interests you

View More