Square
Following
Hot
News
Notifications
Profile
Share your thoughts
placeholder
Article
crypto market update 🥰
live-cover
LIVE14
$XRP On the 4-hour chart, bears are still firmly in control, with the price stuck near 1.16 while the 4-hour EMA50 has slipped to 1.24; trading below the moving average indicates that sellers are still setting the pace. My plan is to open a short in the 4-hour resistance zone, with an entry range of 1.161–1.163. As long as 1.16 is not decisively broken, I’m looking at three successive targets below: 1.157, 1.153, and 1.148. I’ll set the stop-loss at 1.171; if the price breaks above 1.17, this bearish thesis is invalidated, and I’ll exit without hesitation. Based on the risk calculation, the s
post-image
XRP-1.15%
Trenches
ZIG
Z
bade
b
ZIG
0x8c...1145
Market Cap
$.
Change
.
24h Vol
$.
Holders
.
BTC
B
bade
b
BTC
C5xp...pump
Market Cap
$.
Change
.
24h Vol
$.
Holders
.
STONK
S
bade
b
STONK
6GmA...UNgx
Market Cap
$.
Change
.
24h Vol
$.
Holders
.
José
J
bade
b
José
87CQ...1UJT
Market Cap
$.
Change
.
24h Vol
$.
Holders
.
IDOL
I
bade
b
IDOL
0x3b...ab07
Market Cap
$.
Change
.
24h Vol
$.
Holders
.
Crypto is all about contrarian thinking. Once everyone has exited, it can really take off. I’m still buying the dip
post-image
The most dangerous moment in the market is when you believe the economy is performing exceptionally well. History shows that, at times, the market’s greatest enemy is precisely this kind of "good news."

On Friday, U.S. non-farm payroll data came in at 165,000—nearly triple the 60,000 figure economists had anticipated. Furthermore, data for the previous two months was revised upward by a total of 84,000, and the unemployment rate dipped to 4.1%. Headlines proclaim that the economy is soaring. But is that truly the case? And, more importantly, what does this robust picture mean for cryptocurren
post-image
NVDA+2.80%
MU+4.71%
AMD+11.55%
NAS100+1.90%
US500+0.69%
  • 3
State Street, which manages more than $6.3 trillion, has grown its tokenized liquidity fund SWEEP 79.26% in the past 30 days to $284.13M.
More than $75.07M of it now sits on Stellar, where the fund held nothing 30 days ago.
@StateStreet @StellarOrg
XLM-0.64%
Wow. 😍An upset? Man City actually lost to an obscure team? There was no action in the market over the weekend, so I tried a prediction. I actually got it right 😂 hahaha. Doubled my money. Faster than crypto 😂
St-Irenaeus was the first to show how apostolic succession had been institutionalized in the line of bishops in every church and that his list of Popes, complied around 170AD is the earliest witness we have to the immediate successors of St-Peter.
@grok Am I right?
post-image
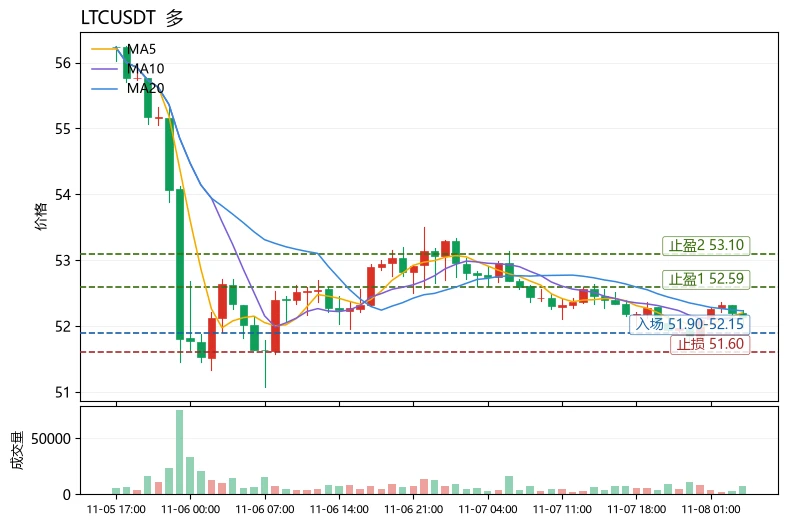
$LTC Current price: 52.14. The first resistance above is the Bollinger upper band at 52.59, and support below is the Bollinger lower band at 51.87. These two levels are where bulls and bears are currently locked in a short-term battle. Why give the price levels before explaining the logic? Because the first step in reading a chart is always to establish your bearings, not to predict.

Using LTC as an example, here's a reusable way to assess trend health: moving averages show direction, MACD shows momentum, and RSI shows positioning. A healthy trend requires all three to align. Currently, MA5=5
post-image
LTC-0.09%
PEPE+0.97%
Michael Saylor Explains the Financial Thinking Behind Strategy’s $STRC

Michael Saylor is connecting four centuries of financial evolution to Strategy’s digital credit product, Stretch ($STRC).

His argument is that each stage introduced something new to financial markets:

* Common stock separated ownership from investment.
* Preferred stock introduced priority claims and defined returns.
* Tax rules created ways to structure capital returns.
* Bitcoin introduced a new type of corporate reserve asset.

STRC brings these ideas together.

Bitcoin supports Strategy’s balance sheet, preferred sto
post-image
STRC+0.34%
BTC-0.67%
$STONK Watching the order book this time made it pretty obvious to me: three wallets sold off almost back-to-back within the same time window, dumping nearly $300,000 worth of tokens in a few minutes. The market cap fell from around $70 million to $60 million, a short-term drop of about 14%. A quick look at the on-chain records shows three sell orders of roughly $110,000, $100,000, and a little over $80,000, placed less than five minutes apart. The selling pace looks a lot like the same group of funds reducing their positions all at once. As someone who just got in, I’m baffled: are several wh
post-image
STONK+11.55%
BTC-0.67%
ETH-1.26%
SEPL
This is what we call a proper uptrend.
The only level I am looking at for short-term capital appreciation is the 800p zone.
The target still remains 1,000p per share
#NFA
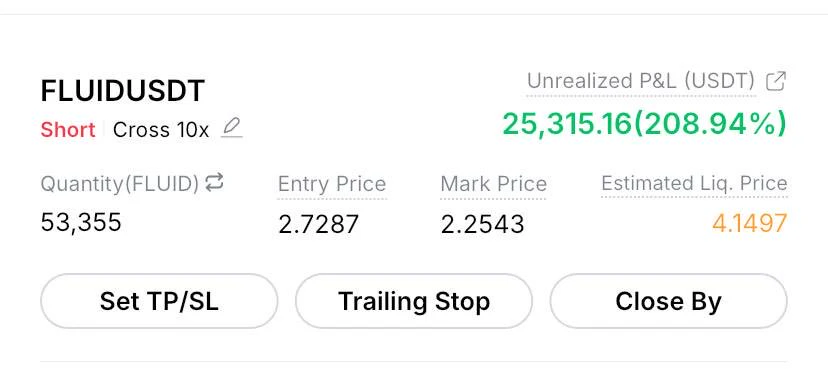
$FLUID approaching target now
Join our telegram channel for live trades
post-image
FLUID-1.92%
BTC ETH MARKET PREDICTION
live-cover
LIVE66
$SIGN ‌ just showed some serious volatility. Is a reversal finally brewing?

SIGN is trading near $0.00937 after briefly dipping to $0.00828 and bouncing sharply.

That long lower wick suggests buyers stepped in, but the daily trend remains bearish below the Supertrend at $0.01133.

Key levels I'm watching:

Support: $0.0090
Major support: $0.00828
Immediate resistance: $0.0106
Breakout zone: $0.0111–$0.01133

A sustained move above $0.01133 could signal a stronger recovery. Losing $0.00828 would put sellers back in control.

Interesting reaction from the lows, but bulls still have work to d
SIGN-2.90%
AMD+11.55%
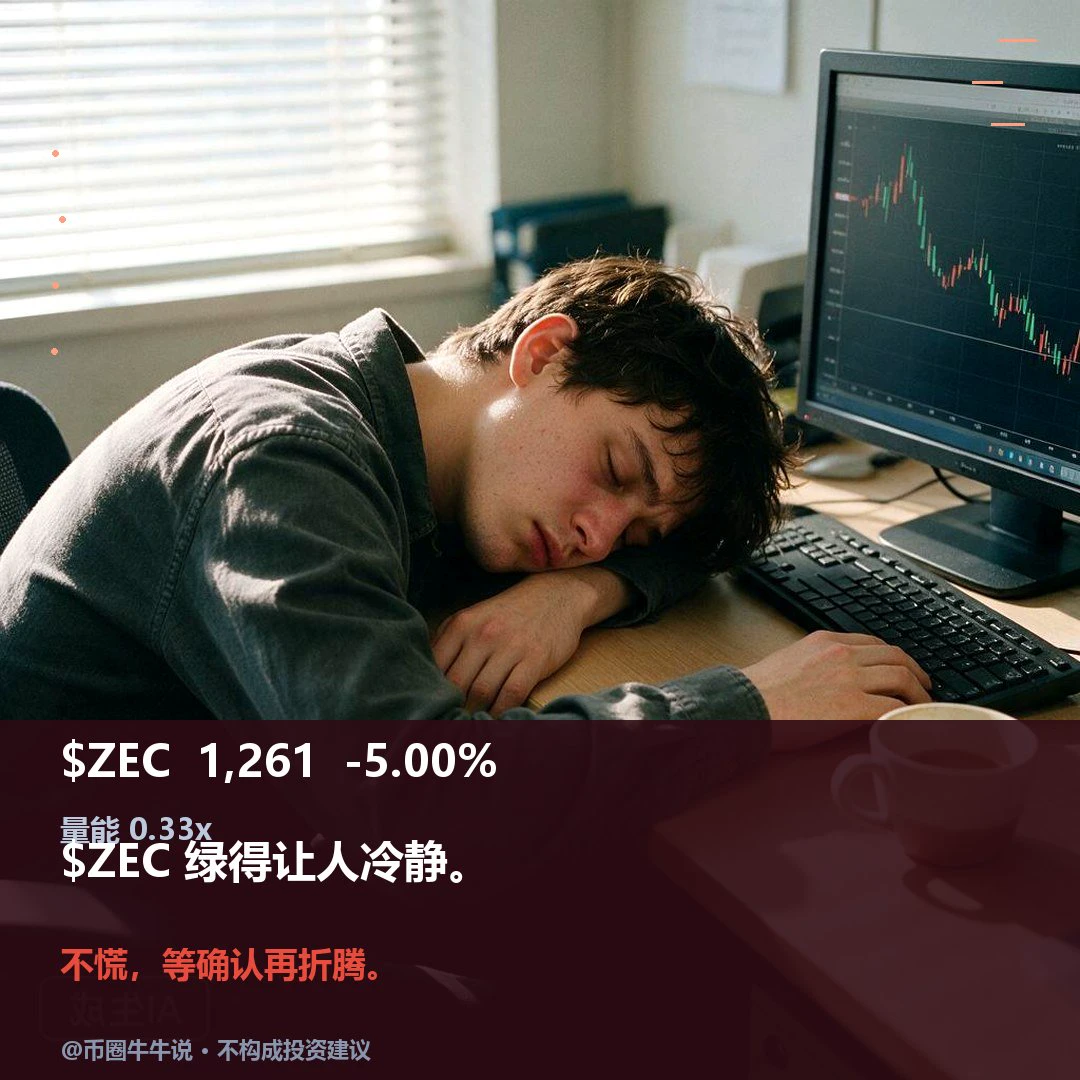
$ZEC Currently at 1260.59, 24H -5.00% (range: 1250.67–1364.08). 1H is weak, with an RSI of 23.48; price is below the EMA20 at 1288.01, and the volume ratio is 0.33. 4H is weak, with an RSI of 54.41; price is below the EMA20 at 1284.31, with support at 1159.00 and resistance at 1387.89. A sustained move above the 1364.08 resistance could indicate continuation; a break below the 1250.67 support would weaken the structure. On review, confirm whether price holds above 1364.08 and reclaims 1250.67; volume is only 0.33x. A hold without volume or failure to reclaim after a breakdown invalidates the s
post-image
ZEC+1.16%
$BTC 1st Short-Term Target Hit! 💥🎯
post-image
BTC-0.67%
$BTC
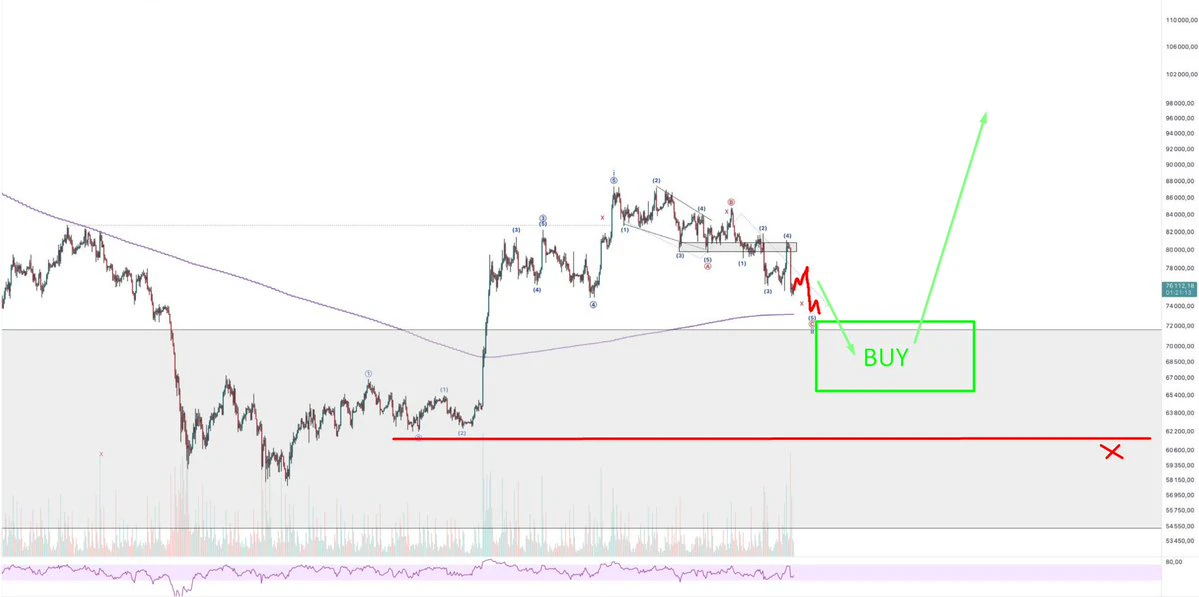
My mid-term setup for #BTC: still waiting for one more dip down into the target zone before looking for long entries.
Bullish setup is invalidated on a clean close below 62k
post-image
BTC-0.67%
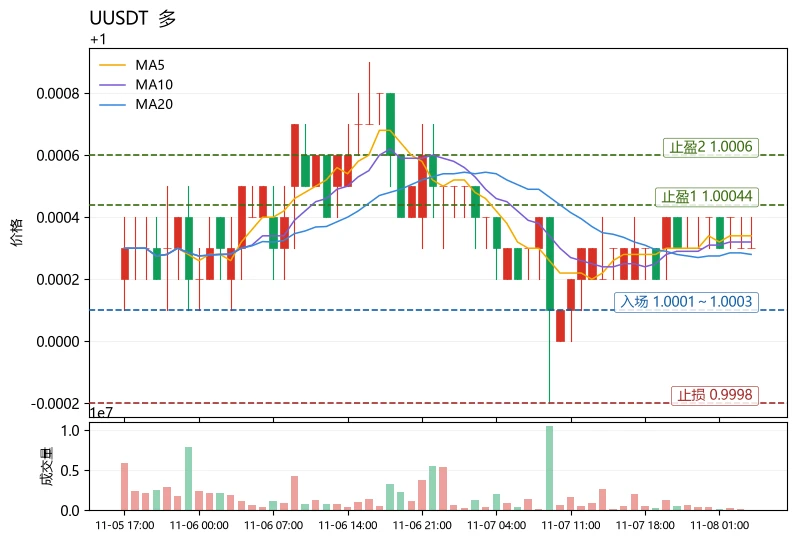
$U The market is currently in extreme fear territory (index 25), but the price is almost pinned at 1.0003. MA5 has edged above MA20, the MACD histogram has turned positive, RSI is neutral at 48.9, and the 30-candle range is only 0.07%, a typical low-volatility sideways structure. When broader market sentiment is subdued, capital tends to cluster in stable assets; $U ’s resilience and tight consolidation make it a natural destination for this rotation. While BTC’s direction remains unclear, it is more likely to follow passively than lead a decline. The bias is bullish, but only buy dips near th
post-image
MET-0.33%
SUI-1.05%
Load More

Join 40 M users in our growing community

⚡️ Join 40 M users in the crypto craze discussion

💬 Engage with your favorite top creators

👍 See what interests you

Trending Topics

USAIStocksHitHard

21.24k Views3.67k Discussing

U.S. stocks sold off sharply on Thursday, November 5 (UTC). The Nasdaq closed down around 5.5%, entering correction territory, while the Philadelphia Semiconductor Index plunged roughly 12%, with chip stocks including $NVDA and $AMD posting steep losses. Beyond profit-taking, investors are growing concerned about the pace of AI data center construction, capital spending, and future returns on investment. The key question now is whether the AI sector’s lofty growth expectations need to be repriced. Where do you think the next opportunities will emerge: chip stocks, tech giants, or other sectors?

USNonfarmPayrolls

34.98k Views4.34k Discussing

StakeOnLaunchpoolToShare450KVLX

10.25k Views828 Discussing

View More