Square
Following
Hot
News
Profile
Share your thoughts
placeholder
Article
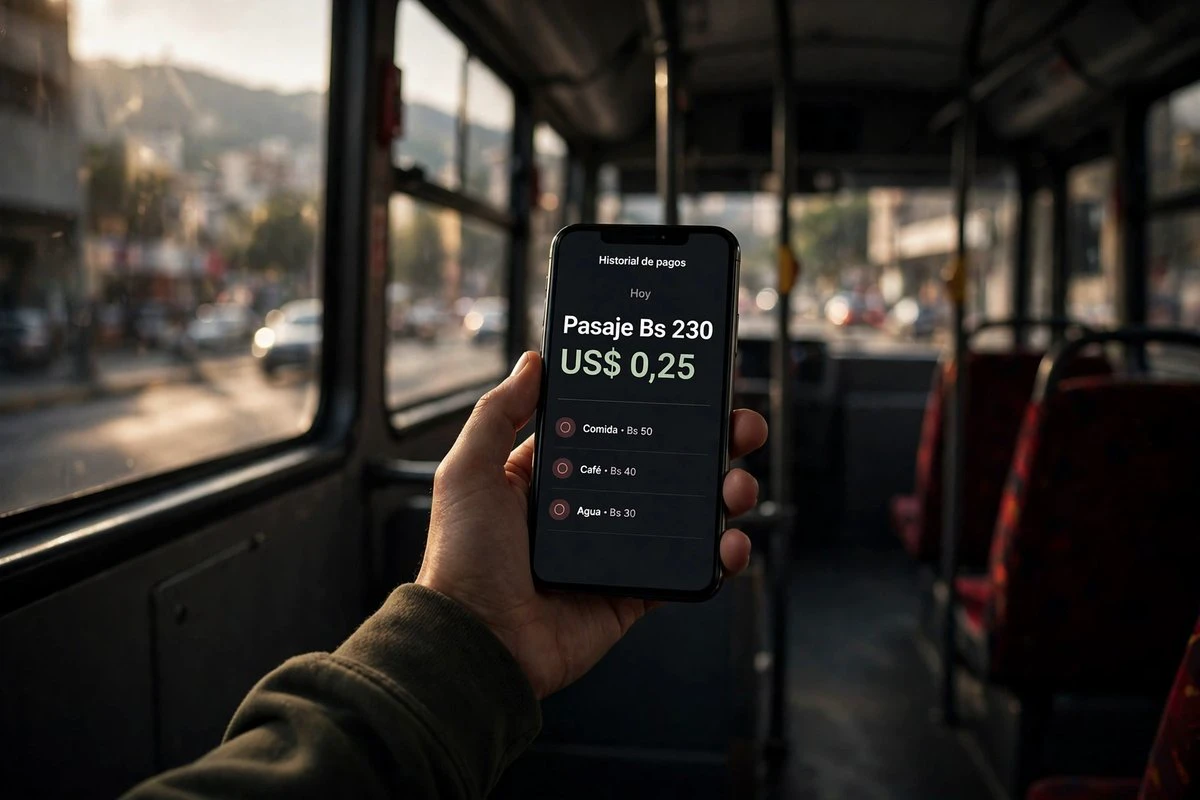
🚌 The urban transit fare starts November at Bs. 230: about US$0.25 at the official rate. It seems like a minor adjustment—Bs. 10 more than October’s Bs. 220—but it says much more than it appears to: the transport sector didn’t set a price in bolivars with bolivars in mind, but rather a price in dollars that is then converted into local currency.
It’s the same exercise millions of Venezuelans do every day when they check how much one USDT is worth on the P2P market before deciding whether to buy, sell, or simply wait.
The arrangement came out of an agreement between the government and transpor
post-image
$ARIA Longs are back... still room to rise$ARIA The 1-hour chart shows strong bullish momentum. Price has decisively broken above the previous consolidation range, signaling renewed buying pressure. Buyers are gradually taking control, and the next move could be higher. Long entry: $0.0875–$0.0885 Take profit: $0.0915 Stop loss: $0.0860 Buy and trade $ARIA
post-image
ARIA+22.03%
Trenches
ZIG
Z
bade
b
ZIG
0x8c...1145
Market Cap
$.
Change
.
24h Vol
$.
Holders
.
KIM
K
bade
b
KIM
8pjf...pump
Market Cap
$.
Change
.
24h Vol
$.
Holders
.
Anakin
A
bade
b
Anakin
Exxz...pump
Market Cap
$.
Change
.
24h Vol
$.
Holders
.
IDOL
I
bade
b
IDOL
0x3b...ab07
Market Cap
$.
Change
.
24h Vol
$.
Holders
.
BTC
B
bade
b
BTC
C5xp...pump
Market Cap
$.
Change
.
24h Vol
$.
Holders
.
#BTC大跌 #ShareWeekly
Bitcoin at $77,768: Is the Market Preparing for a Recovery or Another Major Correction?
Bitcoin is currently trading around $77,768, following a sharp decline that arrived earlier than many traders expected. The sudden bearish move has changed the short-term market outlook and brought important support and resistance levels into focus.
After spending much of October developing a bearish right-shoulder structure, Bitcoin finally experienced the downside movement that many technical analysts had been anticipating. The decline accelerated as negative market sentiment and a re
BTC-0.67%
  • 1
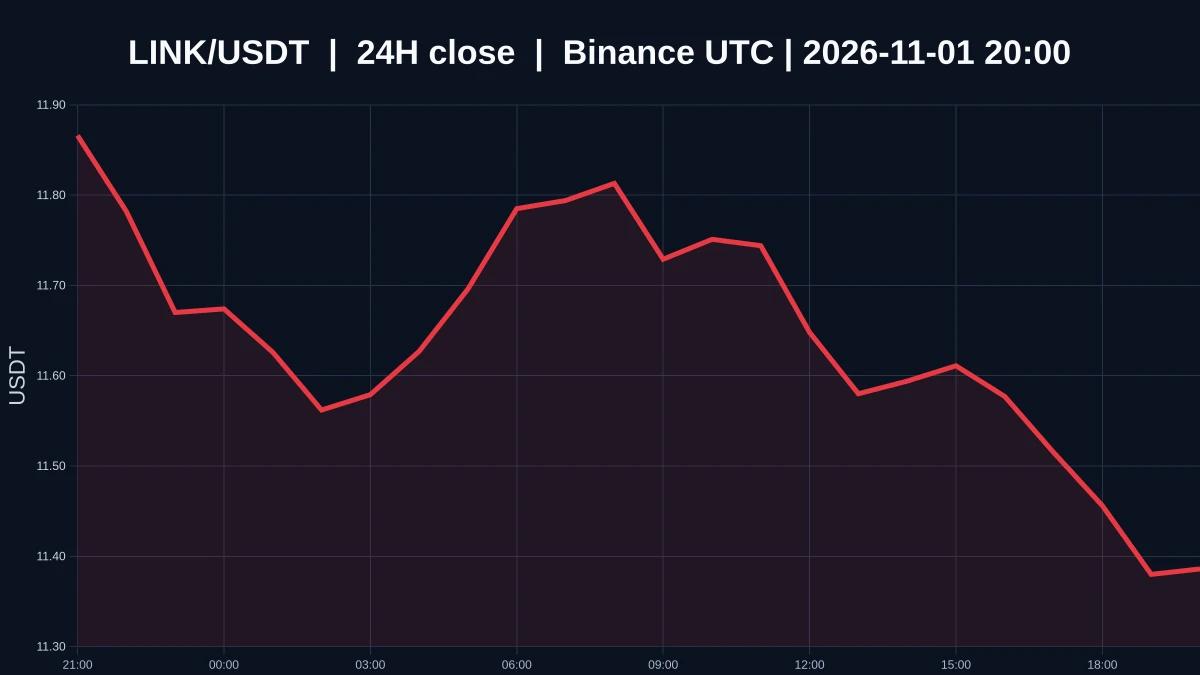
LINKUSDT Short-Term Weakness: Key Levels to Watch Amid Low Volume
$LINK The current price is 11.401, down 4.29% over the past 24 hours, with an intraday high of 11.963 and a low of 11.369. On shorter timeframes, the 1-hour trend is weak, and the 4-hour trend is also weak. The two timeframes are aligned, with no clear signs of a bull-bear divergence. However, this consistent weakness means downside momentum remains in place, with no clear bottoming structure. Within a multi-timeframe analysis framework, the short- and medium-term directions have yet to diverge. This consistency generally sugges
post-image
[New Streamer] Market Prediction
live-cover
LIVE1,755
  • 1
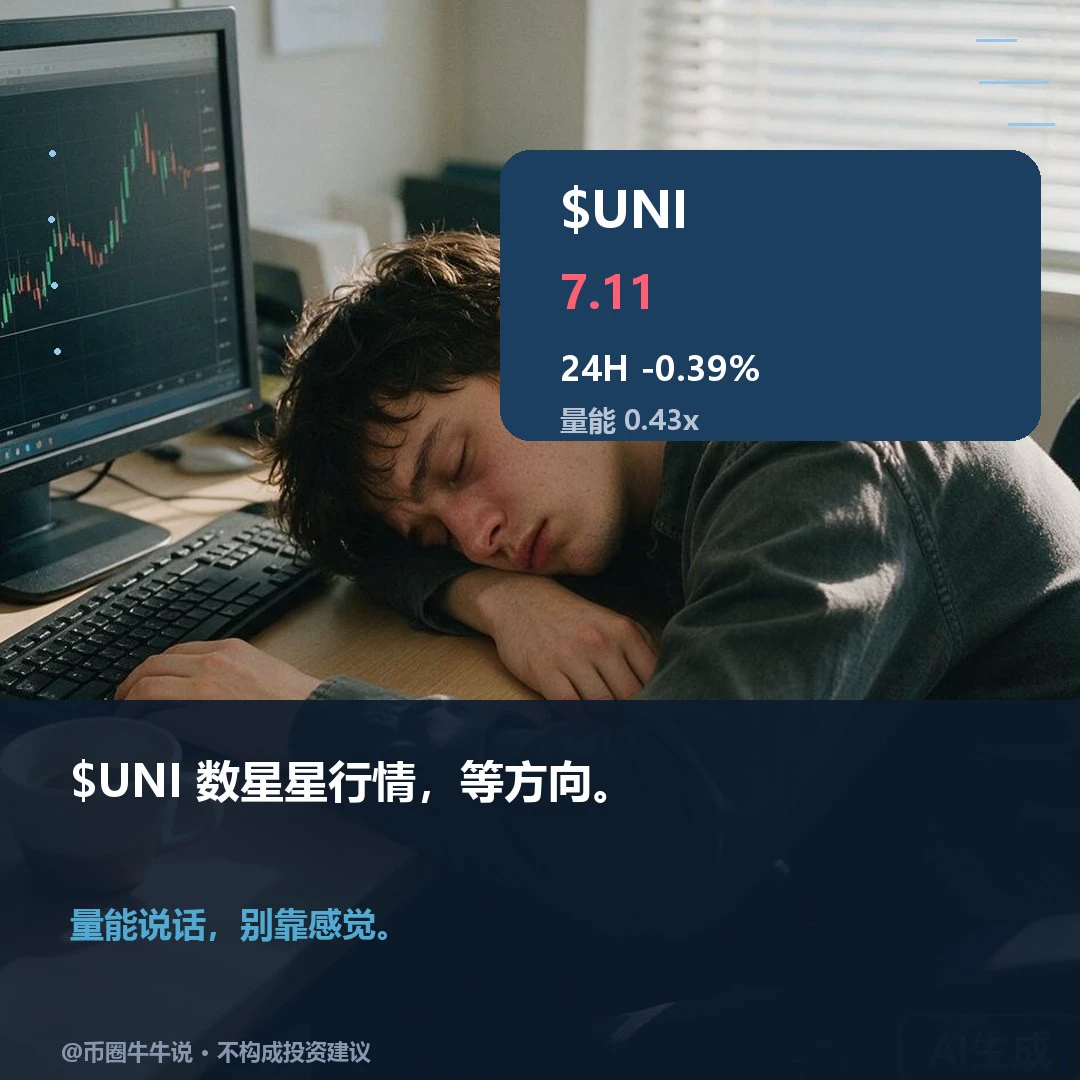
Divergence: $UNI is currently at 7.114, leaning weak on the one-hour timeframe and strong on the four-hour timeframe. The two timeframes haven't aligned yet. The hourly RSI is only 42.95, far below the four-hour RSI of 60.51. This kind of conflict suggests the direction is unconfirmed, not a trend reversal. Volume is just over 40% of average, indicating insufficient participation; neither side has the strength to change the situation. If the one-hour weakness can't even hold the intraday low of 7.021, what evidence of strength is left on the four-hour timeframe? When timeframes conflict like t
post-image
UNI+3.05%
#Gate广场万圣节 Boom—fourth time 😎✋
$ON
Count how many times we've gone in 😁✋...$Q
‍$BTC
post-image
ON+4.77%
BTC-0.67%
Quick Long Plan $LYN
Entry: 0.0185 Take profit: 0.019-0.02 Stop loss: 0.017 Why go long? There is currently buying volume, and momentum is quite strong, indicating that buyers are firmly in control. The short-selling pressure above is stronger than the long pressure below. The upward angle is close to 75 degrees or higher, proving that buying pressure is strong.
post-image
LYN-0.44%
Guys, $AKE this trade had a solid thesis: longs were overcrowded on funding rates, stop-loss walls sat below liquidation levels, and the technicals showed high-level stagnation. The chatroom signals converged on a short, and holding 25x through the main leg down brought 833% returns.
Once it broke down, longs were liquidated in a cascade, with no buying support as it plunged from 0.0135 to 0.0089. The key was staying disciplined when the signals converged, not blind guessing. I took profit on half and moved the stop on the rest to breakeven. At the lows, watch for a rebound and don’t chase sh
AKE+6.39%
ETH-1.23%
BTC-0.65%
  • 1
Detected a Korean actress automatically sending a chaebol.
post-image
The probability of the Fed raising rates by 25 basis points in December is 70.7 percentage
live-cover
LIVE3,179
Are you ready to start the waterfall? $ETH
post-image
ETH-1.23%
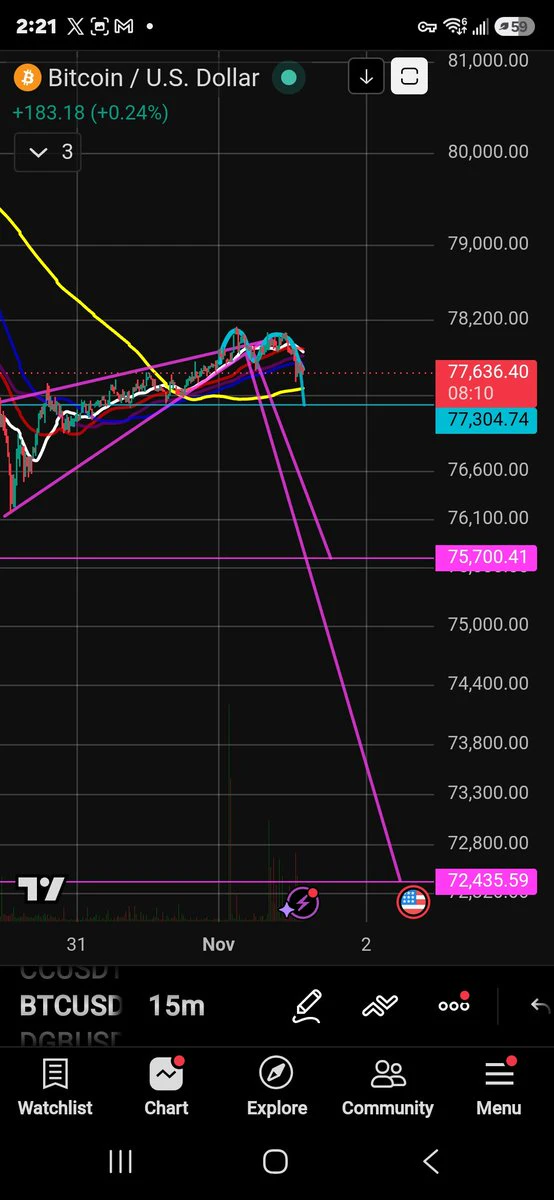
$BTC Breaking Downwards 👀
The pink bearflag that I was posting about yesterday is breaking downwards.
We can see the blue M pattern AKA double top is being bearishly retested right now.
The target is just below the 15 minute 200MA at $77,304.
Pink Bearflag Targets 🎯
1) $75,700
2) $72,345
If the 15min 200MA is broken to the downside these targets become a lot more probable.
NFA, DYOR ⚠️
#Crypto #Trading #BTC
post-image
BTC-0.67%
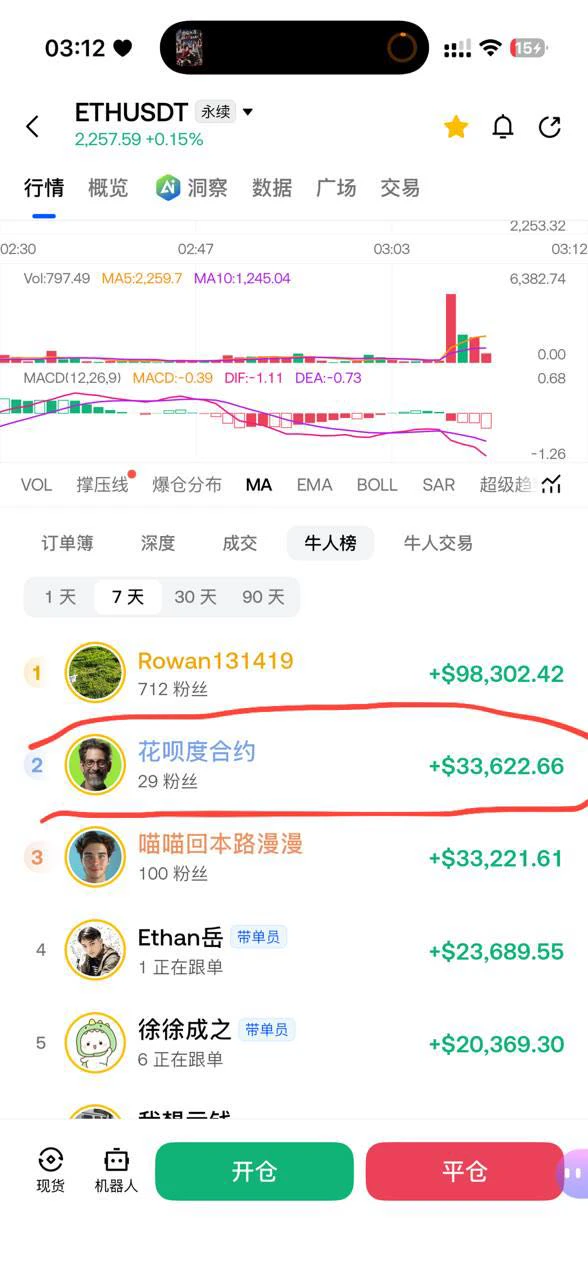
Target profit this month: 100,000 #10u战神 Copy trading is now open; feel free to follow if you're interested
post-image
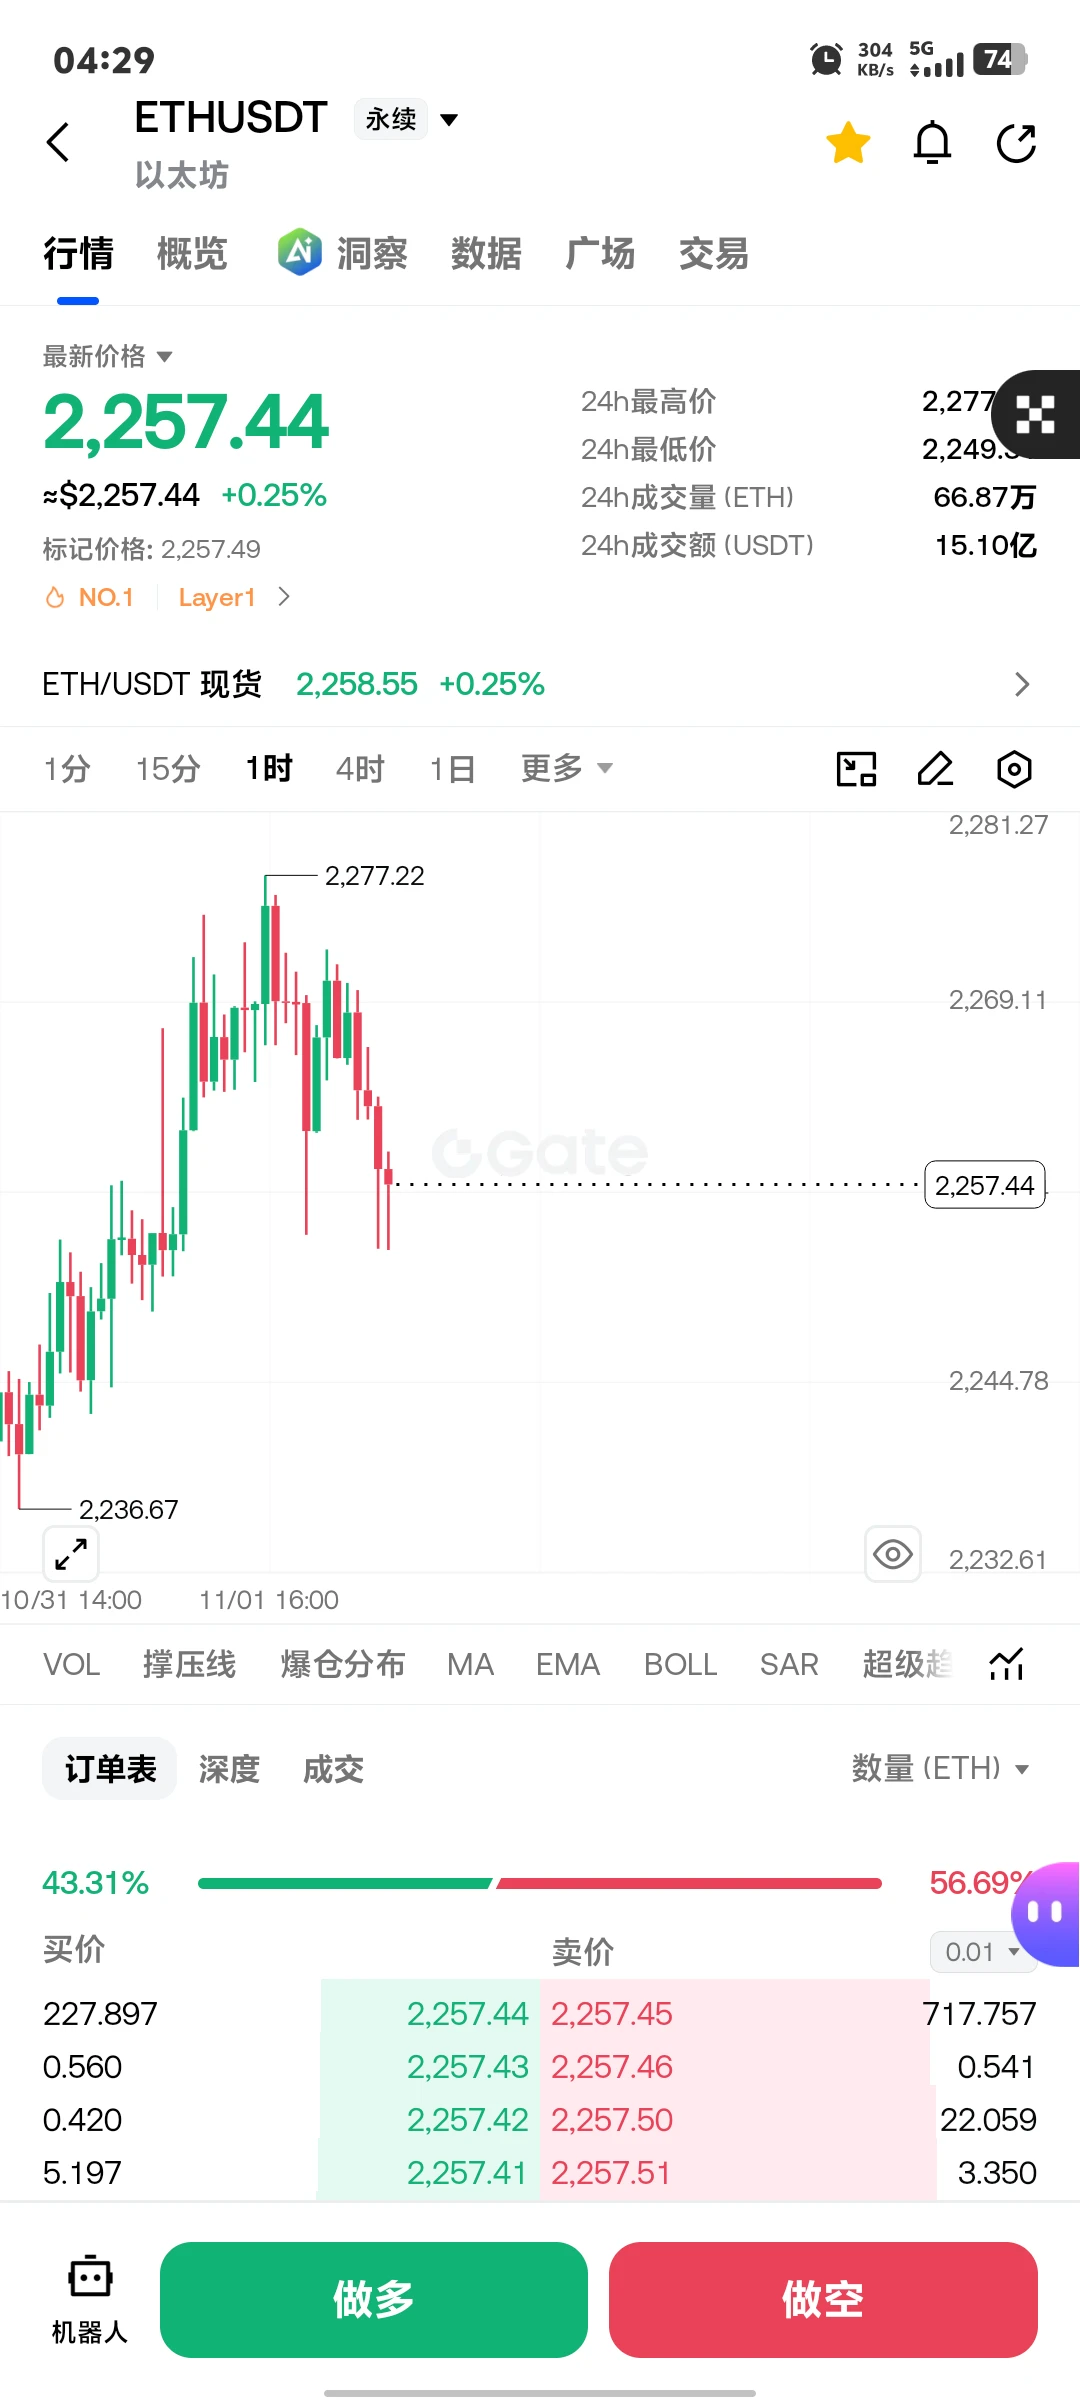
Someone opened a short position worth $45,200,000 using 20x leverage$ETH . Liquidation price: $3,188
post-image
ETH-1.23%
$TRUMP ‌ is starting to show some life after the recent selloff, and buyers are making their presence felt.
Price has bounced from $1.467 to around $1.69, putting in a solid recovery candle. The response from buyers is encouraging, but the daily trend still needs confirmation with Supertrend sitting at $1.901.
Levels I’m keeping on the radar:
Support: $1.60, then $1.467
Resistance: $1.777, followed by $1.90
Reclaiming $1.777 would give this bounce more strength, while a move above $1.90 could bring a much better shift in market structure.
The recovery deserves attention. Now it’s all about w
TRUMP-0.95%
SNDK-13.60%
  • 4
  • 2
Had a great Halloween with the fam 🎃
post-image
$PONS ‌ is trading close to its lows, but could this quiet phase be setting up a recovery?
The chart shows a prolonged decline from $0.7781, with price now hovering around $0.2367 after recently testing $0.2160.
There is some stabilization, but the bigger trend remains bearish with the daily Supertrend still sitting well above price at $0.3509.
Key levels to watch:
Support: $0.2263 to $0.2160
Resistance: $0.2484
Major resistance: $0.3509
A break above $0.2484 would be the first positive sign. Reclaiming $0.3509 would make the recovery structure much more convincing.
PONS needs to show buyers
PONS+4.32%
INTC-28.49%
  • 3
  • 2
#BTC大跌
The October monthly candle closed in the red: a drop from ~$83,556 to ~$77,424 (-7.3%). This marks the weakest October since at least 2016, setting a cautious tone for November, which is historically unpredictable (closing green 5 out of 10 years, and red the other 5).
📊 Technical Overview by Timeframe
· Monthly (1M): The price is at the lower Bollinger Band (LB ~$51,917) but remains above it. MACD is in negative territory, and the histogram is shrinking — selling pressure is weakening, but there is no reversal yet.
· Weekly (1W): The price is between the middle and lower bands (MB ~$
BTC-0.67%
  • 10
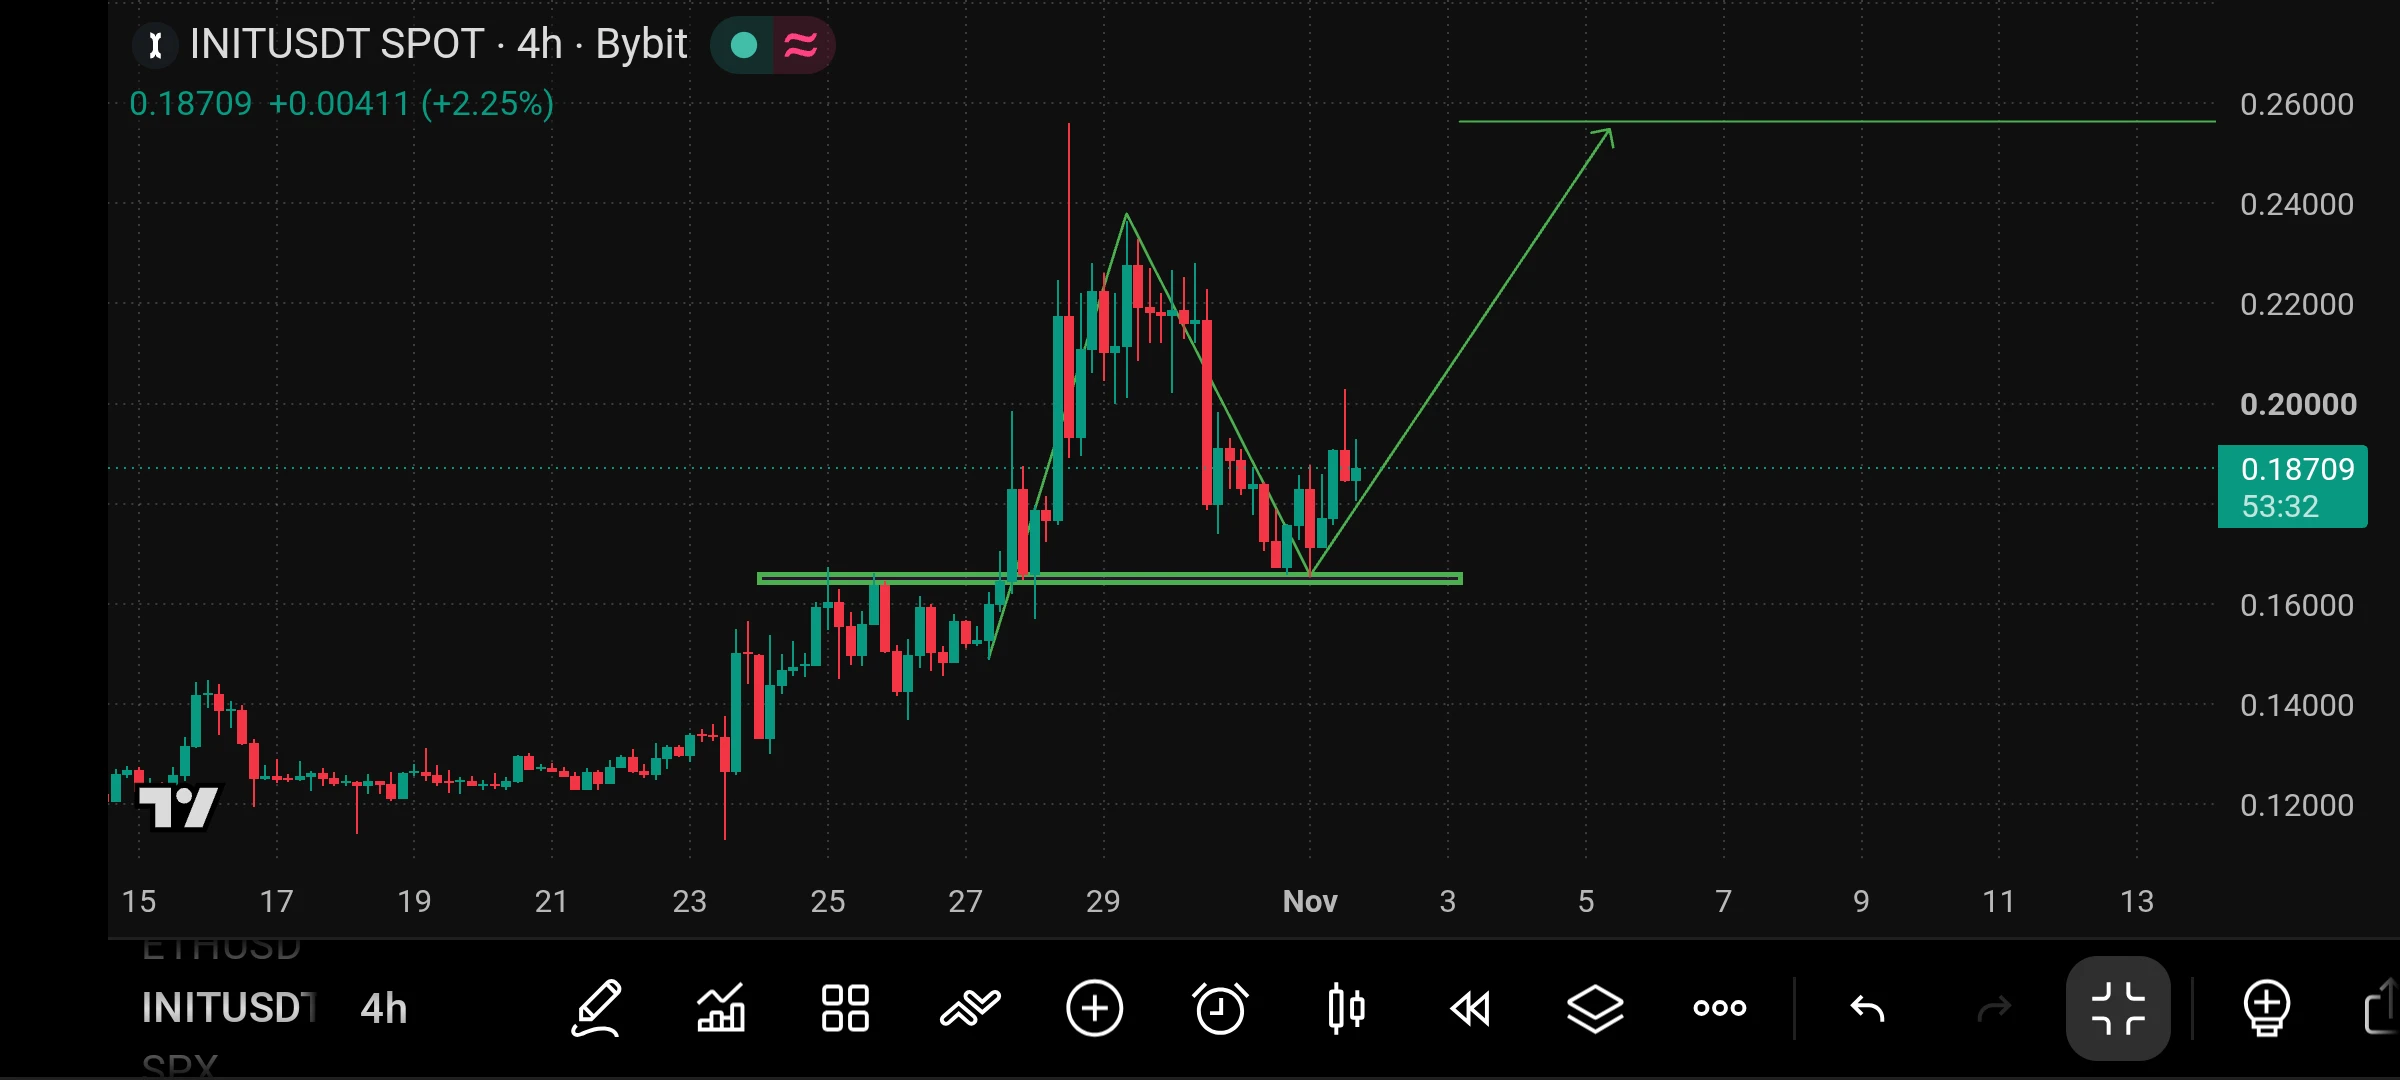
$INIT Showing Signs of Recovery!
$INIT is trading around $0.187 on the 4H chart after bouncing from the important $0.164 to $0.166 support zone.
What caught my attention is how buyers stepped in again after the recent pullback.
In my view, as long as this support holds, INIT has a chance to build momentum toward $0.20 and $0.22.
A stronger breakout could eventually open the door toward $0.26.
However, losing $0.164 would weaken this bullish setup.
I'm watching how price reacts around $0.20 before expecting a bigger move.
Are you bullish on $INIT?
#INIT #Crypto #trading!
post-image
INIT-2.53%
  • 6
  • 2
Load More

Join 40 M users in our growing community

⚡️ Join 40 M users in the crypto craze discussion

💬 Engage with your favorite top creators

👍 See what interests you

Trending Topics

BTC大跌

515.45k Views39.92k Discussing

$BTC briefly fell below $77,000 and remains under pressure around the $77K zone, with its 24-hour decline still above 4%. With risk appetite weakening and Fed uncertainty rising, where is the next key support after losing $80K?

IntelBeatsEarningsButStockPlunges

48.6k Views1.09k Discussing

StrategySTRCNears100ParValue

57k Views4.22k Discussing

View More