Share your thoughts
placeholder
Article
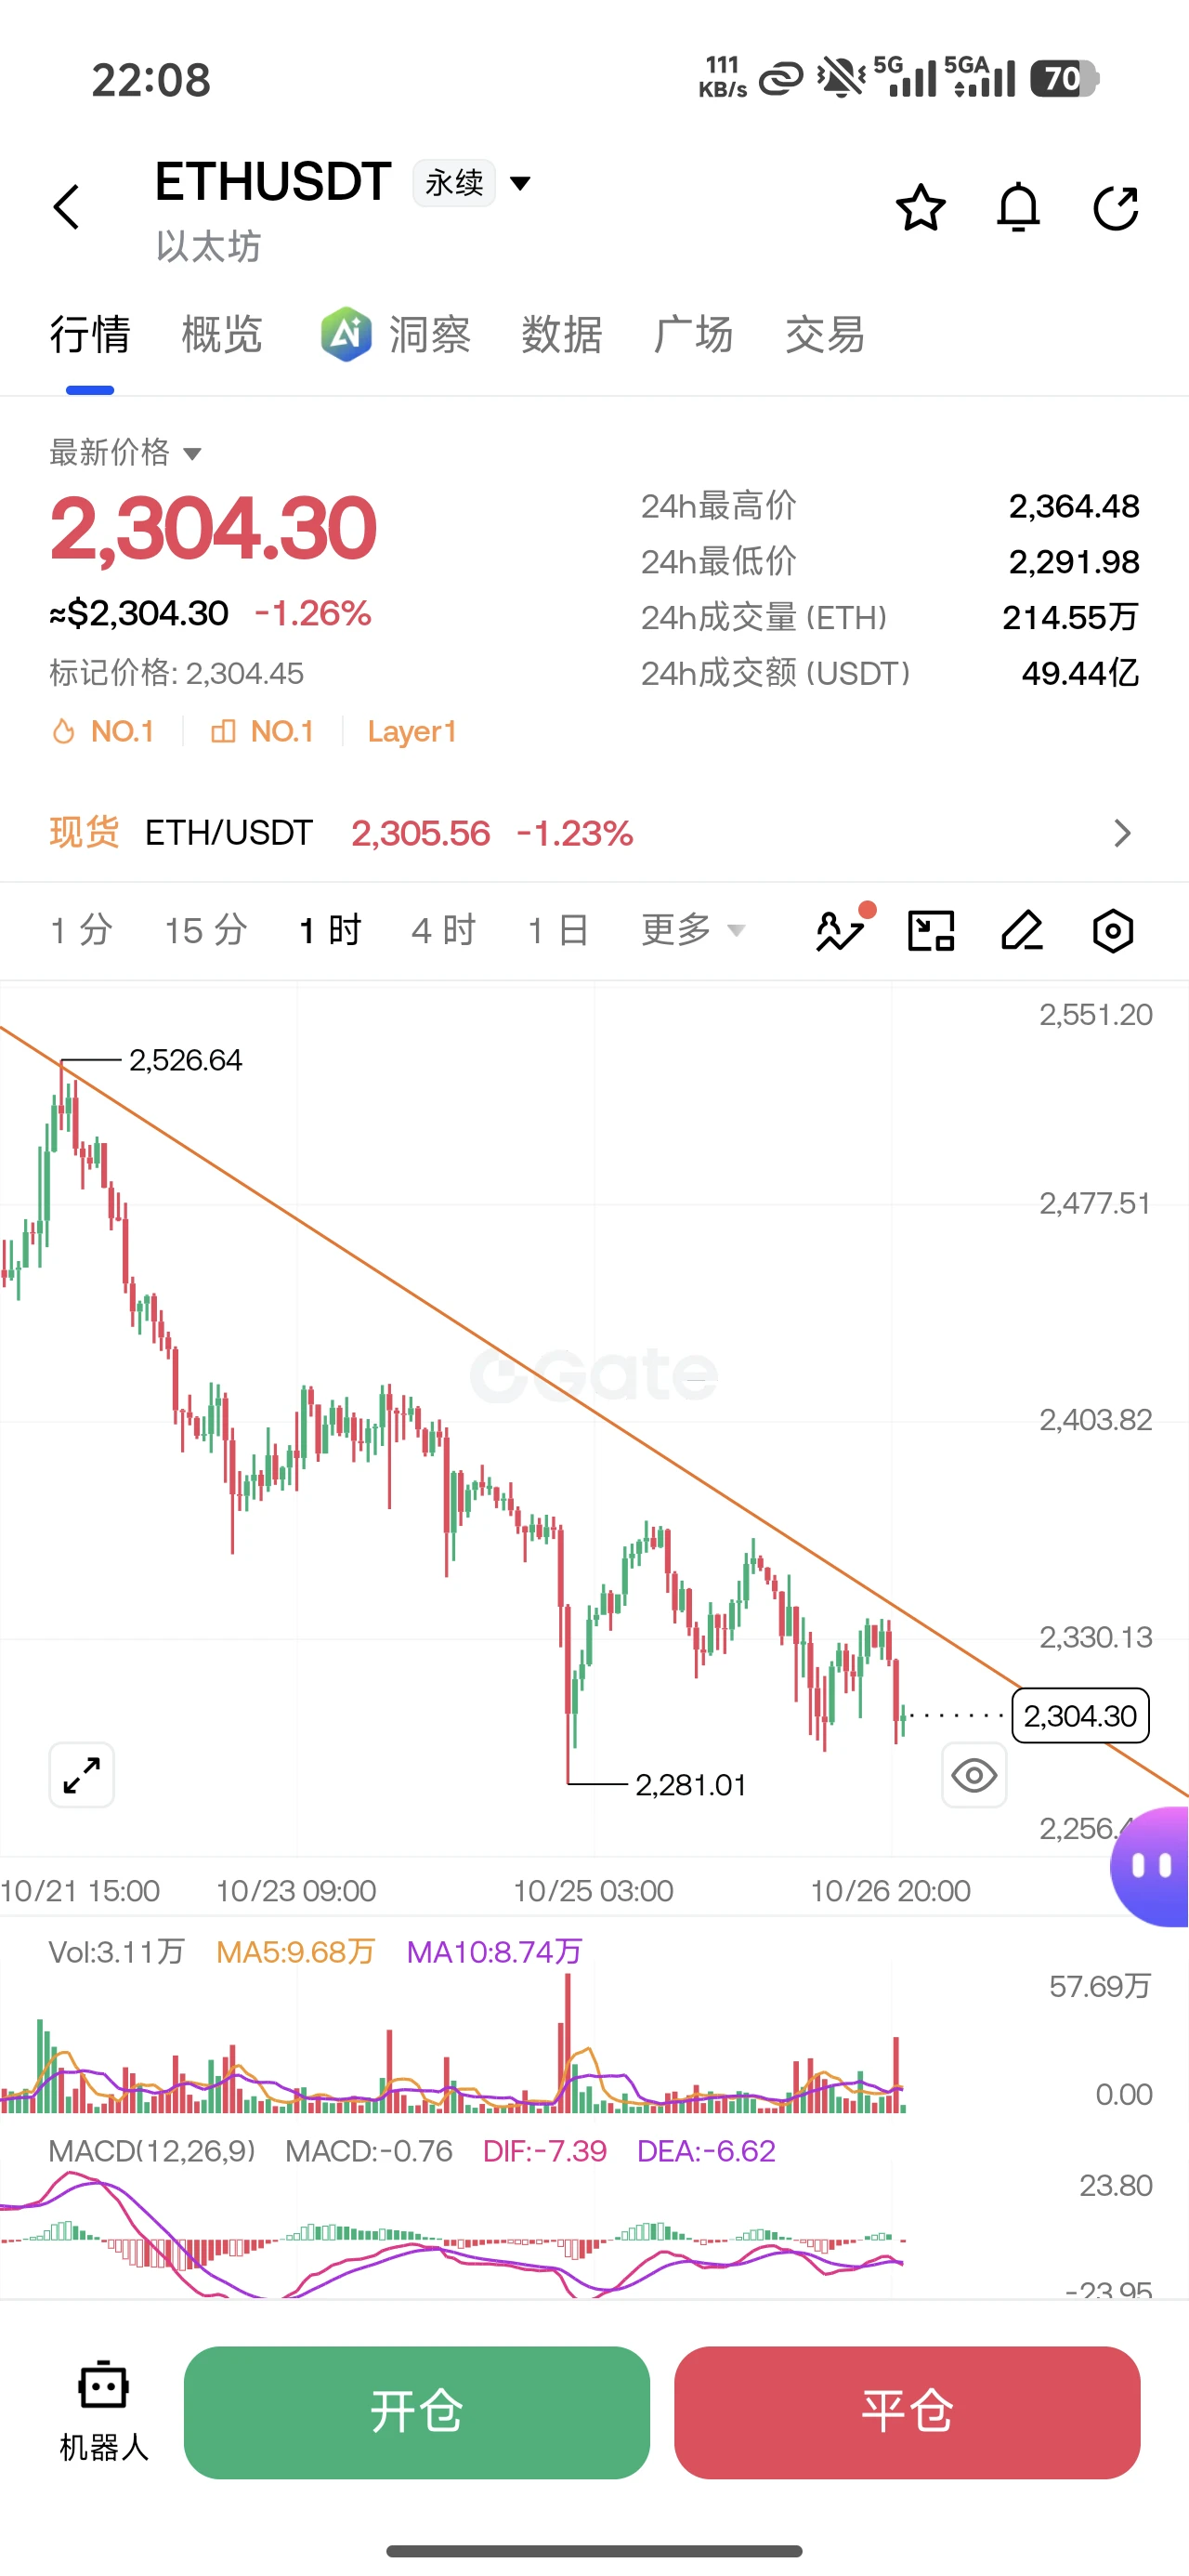
As liquidity returns, ETH’s volatility has also begun to increase. Before major macro events materialize, it may be unable to break through as quickly as it did last week.
The extreme support below is not the weekend low of 2460, but rather around 2430, the midpoint of the entire range. Above the midpoint, the bias remains bullish;
Alternatively, the short term can be viewed as a range between 2430 and 2550. Since the horizontal support below is relatively far away, it is preferable to wait for a pullback opportunity around the upper boundary at 2550/2570.
post-image
ETH+0.18%
Morning short at 4355, dropped to 4317, reaching the target of 4328. Continue watching for a move down to 4290.
The market moved upward as expected, and profits were locked in.
No hindsight calls—the levels were provided in advance, and the trend is gradually playing out.​​​$XAUT #黄金
JiangYiGuanJin
9、9/14 Morning Market Analysis and Trading Strategy:
Gold prices opened slightly lower in the morning and moved sideways within a narrow range. The one-hour moving averages show a bearish pressure pattern: the 5-day moving average is 4347.62, the 10-day moving average is 4362.81, and the 20-day moving average is 4349.77. Prices are trading below all the moving averages, with clear resistance on rebounds, and are in a weak consolidation phase following the pullback.
The short-term resistance above is 4348-4350 (20-day moving average + intraday pressure), with stronger resistance at 4362 (10-day moving average). The first support below is 4328, while the key defensive support is the previous low at 4290. Once it breaks below, further downside will open up.
Recommendation
Short the 4355-4375 resistance zone, targeting 4328 first; if it breaks down, continue to target 4290, #黄金 $XAUT .
repost-content-media
XAUT-0.57%
Nobody is talking about this quiet setup forming right now

$XLM /USDT - SHORT

Trade Plan:
Entry: 0.18258 – 0.18336
SL: 0.18671
TP1: 0.18016
TP2: 0.17829
TP3: 0.17549

Why this setup?
Why now? The daily trend is range bound while the 1h price sits at 0.18297, exactly at the entry reference for a short bias. The 15m RSI reading of 67.75 signals weakening momentum without yet being overbought, giving the short side room to work. The 1h ATR of 0.001559 defines realistic volatility, making the entry zone between 0.18258 and 0.18336 a precise place to position for a move toward TP1 at 0.18016 a
XLM+2.81%
CRYPTO Market Talk
live-cover
LIVE1,884
$ARK Up 28% in one day with a trading volume of 158 million, this kind of volume in the 18th month after the first three halvings has always been a hallmark of the start of the main uptrend. Currently at 0.2026, with a 24-hour low of 0.1295 and a swing of over 60%, this is a typical volume surge after a shakeout.
Historical comparison: After ARK rose 30% in a single day in February 2021, it retested the 20-day moving average within a week before doubling; a similar pattern occurred in December 2017, when it continued rising after a 15% pullback. I haven't seen any signs of whale selling in the
ARK+2.96%
Everyone is sleeping on LSK while the 1h price quietly reclaims a key level.

$LSK /USDT - LONG

Trade Plan:
Entry: 0.8274 – 0.9032
SL: 0.5015
TP1: 1.1382
TP2: 1.3201
TP3: 1.5929

Why this setup?
Why now? The daily trend is bullish, the 1h ATR of 0.151584 confirms enough momentum to drive a move, and the 15m RSI at 52.5 shows the market is neither overbought nor oversold. The entry zone between 0.8274 and 0.9032 aligns with the current 1h price of 0.8653, giving a precise trigger for a long. TP1 at 1.1382 and TP2 at 1.3201 define a realistic two-stage target path that rewards patience. The
LSK+9.25%
  • 2
  • 1
#GateTop4MainstreamCEX
I keep seeing people focus on the “No. 4” part of Gate’s August ranking.
Personally, I’m more interested in what happened before Gate got there — and whether the numbers are strong enough to push it toward No. 3 next.
The August data shared by BlockBeats shows Gate doing roughly $40B in spot volume and $285B in derivatives volume. That is not a small number, especially when you consider how competitive the CEX market has become.
But volume by itself doesn’t convince me.
What I want to see is whether the activity is being supported by actual capital flows, users, liquidi
post-image
  • 5
  • 1
#Gate24HFuturesOpenInterestTops$11.479B Gate’s Futures Open Interest Crosses $11.479B: A Strong Signal of Trust, Liquidity and Market Participation
Gate continues to prove that serious traders are paying attention. The latest futures market data shows Gate’s open interest around $11.479 billion, placing the exchange among the world’s leading centralized exchanges by derivatives activity. For me, this is much more than a headline number. It is a market signal: capital is being deployed, positions are staying active, and traders are increasingly comfortable using Gate as a venue for sophisticate
Smiles never disappear; they only move elsewhere.
Why everyone watching $CL /USDT right now is about to get proven wrong

$CL /USDT - SHORT

Trade Plan:
Entry: 98.62 – 98.92
SL: 100.24
TP1: 97.67
TP2: 96.93
TP3: 95.83

Why this setup?
Why now? The 1h price is sitting at 98.77 inside a tight range, and the 15m RSI at 56.58 shows momentum has not yet committed to either side, which means the next move will be sharp. The 1h ATR of 0.612057 tells us each candle is small enough that a breakout will be explosive, not gradual. With the daily trend tagged as range, the system expects the price to snap back toward 97.67 for TP1 and then 96.93 for T
CL+2.68%
Everyone is about to learn what the 1h ATR just revealed about $XAUT /USDT.

$XAUT /USDT - SHORT

Trade Plan:
Entry: 4332.1 – 4336.5
SL: 4355.4
TP1: 4318.5
TP2: 4307.9
TP3: 4292.1

Why this setup?
Why now? The daily trend is bearish, and the 1h price is sitting exactly at the 4334.3 entry reference, which is also the 1h ATR of 8.800522 in play. The 15m RSI at 42.28 shows the momentum is still leaning bearish, not yet oversold enough to reverse. The entry zone between 4332.1 and 4336.5 gives a tight range to catch the move, with TP1 at 4318.5 and TP2 at 4307.9 offering two clear targets befo
XAUT-0.56%
Insiders are quietly loading up on SYMBOL while the daily trend screams bearish.

$LAB /USDT - LONG

Trade Plan:
Entry: 0.05254 – 0.05408
SL: 0.04373
TP1: 0.06050
TP2: 0.06529
TP3: 0.07247

Why this setup?
Why now? The 4h structure is building momentum against a bearish 1D trend, and the 15m RSI at 38.04 signals room to run before overbought. The 1h ATR of 0.003071 defines a tight volatility envelope, making the entry zone between 0.05254 and 0.05408 a precise risk-controlled opportunity. The first target at 0.06050 rewards a quick move, while TP2 at 0.06529 extends the upside if momentum h
LAB-20.98%
Market update
live-cover
LIVE1,879
#GateFuturesOpenInterestTop3
📊 Gate Futures Activity Keeps Rising
Gate’s latest update shows its 24H Futures Open Interest has surpassed $11.479B, placing Gate among the top 3 CEX globally by futures open interest.
For me, this is less about calling the market bullish or bearish, and more about seeing where trading activity and capital are concentrated.
⚡ I’m Still More Comfortable Watching Than Trading
I haven’t really started trading futures yet.
I’m more comfortable with spot, market structure, and looking for areas where price may be building a reversal.
Still, futures data can give anot
CP-6.69%
BTC+0.60%
ETH strategy and zec strategy$ETH
ETH+0.17%
NVIDIA is sitting near a key decision area after pulling back from its recent highs.
$NVDA
What stands out is the reaction around $215–$218. If buyers can defend this zone, the stock could regain momentum and retest $225–$230 resistance.
But if this support breaks with strong volume, the current structure would weaken and the market could start looking toward the $207–$210 area.
For me, the important point is not predicting the next candle. It is watching whether buyers or sellers gain control at these levels.
Let the price action confirm the direction
#RobinhoodChainRevenueFallsFor5Consecuti
NVDA-1.29%
  • 4
After last week’s CPI-driven pump, it still fell back down in the end. The idea of shorting the rebound at $BTC was correct.
And now we’ve reached a truly difficult week—the Fed’s interest rate decision.
The market has already priced in quite a bit of a 25 bp rate hike in September, so I think what really matters is not whether they hike, but whether they will continue to sound hawkish this time.
We’ll see what Powell says after the hike and whether the dot plot continues to lean hawkish. Once the hike is delivered, if no more hawkish signals are released afterward, we could instead see a wav
post-image
BTC+0.60%
This week is bound to be anything but calm.
First, remember several key events this week:
On September 14, Iran and the Gulf states will hold negotiations in Oman, with the Strait of Hormuz as the key focus. If they reach an agreement, oil prices and inflation expectations could cool; if talks collapse, oil prices will rise and risk assets will come under pressure.
The Fed’s FOMC meeting will take place on September 15–16.
This time, the market is focused on one question: Will the Fed raise rates or keep them unchanged?
The answer itself is important, but what will truly affect market conditio
post-image
ETH+0.17%
BTC+0.62%
#HBMShortageBoostsAIChipPrices 🔥 HBM Shortage Boosts AI Chip Prices
The artificial intelligence boom is creating a new pressure point across the semiconductor industry: High Bandwidth Memory (HBM). As demand for AI accelerators continues to rise, limited HBM supply is becoming an increasingly important factor in the cost and availability of advanced AI chips.
HBM is critical for modern AI infrastructure because it provides extremely high memory bandwidth while supporting the massive data-processing requirements of GPUs and other AI accelerators. Training and running sophisticated AI models re
HBM-0.50%
  • 2
9.14 Long/Short Ratio Analysis: Whales Tactically Reduce Positions, Retail Traders Rush In, Range-Bound Structure
1. The market funding rate is 0.0037%, within the normal range.
2. The retail long/short ratio is 0.5126. The curve has risen, showing that retail traders are actively buying and turning bullish. However, the 0.5126 reading is only slightly above the 0.5 threshold, indicating that retail traders are entering tentatively with very small positions.
3. The whale long/short ratio is 2.32, up 0.09 from yesterday. The curve has reached a new high, indicating that whales remain firmly bul
ETH+0.17%
Load More

Join 40 M users in our growing community

⚡️ Join 40 M users in the crypto craze discussion

💬 Engage with your favorite top creators

👍 See what interests you

Trending Topics

AnthropicPicksNasdaqForIPO

71.84k Views2.62k Discussing

The related rumor has heated up valuation discussions around unlisted AI companies and also linked SpaceX's secondary-market performance with primary-market sentiment. However, it remains an unconfirmed market rumor for now.

Gate 24H Futures Open Interest Tops $11.479B

4.04k Views118 Discussing

Korea Stocks Plunge 3.14% at Open

44.41k Views4.77k Discussing

View More