Square
Following
Hot
News
Notifications
Profile
Share your thoughts
placeholder
Article
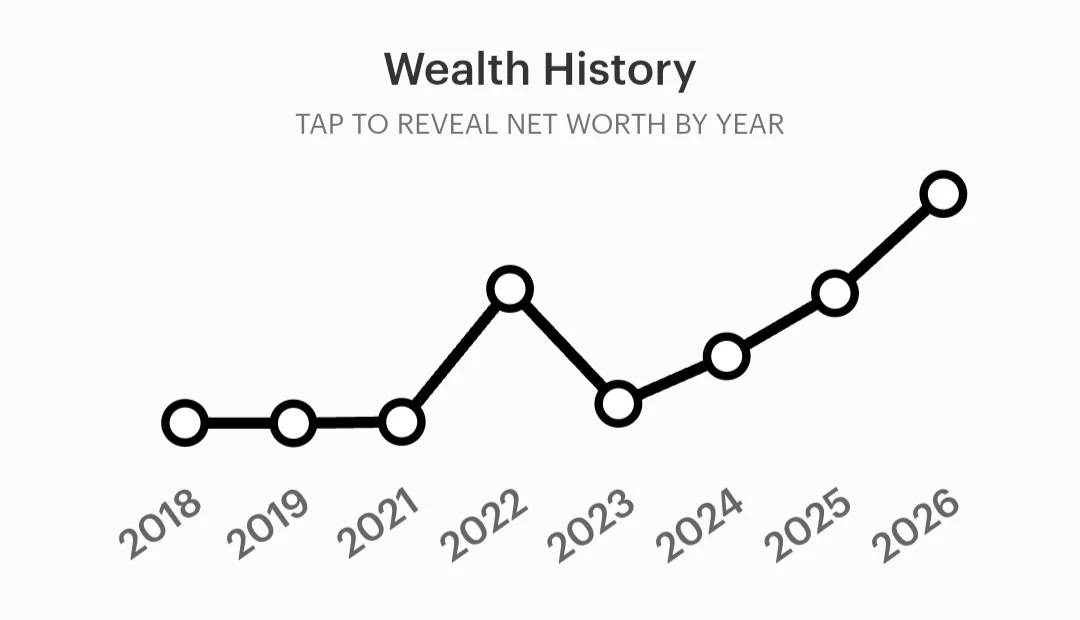
Crypto 'bros' wrecked while CZ's wealth history looks like this?!
Both him and psycho-Trump should be sent to where they truly belong if you want any kind of bullrun at all.
post-image
BTC crashed to 62k on Sunday, a four-month low. About $2 billion was liquidated in 24 hours, with long positions accounting for the vast majority, and the Fear and Greed Index fell to 10. Everywhere you look, people are saying, “It’s over.” But here’s a contrarian take: this is a flush-out, not the end. First, what’s being wiped out is leverage, not conviction. With $2 billion liquidated and longs making up 90%, it shows that “people gambling with borrowed money” are getting crushed, not long-term holders. Clearing out leverage is a prerequisite for a rebound. Second, history doesn’t lie. The
post-image
NVDAB
NVDABNVDAB
Pump.Fun
MC:$3.5KHolders:1
4.36%
HYPE+0.24%
Trenches
mihao
m
bade
b
mihao
4Cxj...pump
Market Cap
$.
Change
.
24h Vol
$.
Holders
.
bill
b
bade
b
bill
85Rh...pump
Market Cap
$.
Change
.
24h Vol
$.
Holders
.
rockstar
r
bade
b
rockstar
9HFU...pump
Market Cap
$.
Change
.
24h Vol
$.
Holders
.
PIEVERSE
P
bade
b
PIEVERSE
0x0e...25a9
Market Cap
$.
Change
.
24h Vol
$.
Holders
.
Socks
S
bade
b
Socks
FS1p...pump
Market Cap
$.
Change
.
24h Vol
$.
Holders
.
???????????
post-image
??
making back the $6b
▓▓▓▓░░░░░░░░░░░░░░░░░░░░░ 1%
post-image
Don’t Be Fooled by a Fake Bounce: The Macro Pressure on BTC Hasn’t Eased

After the initial jobless claims data came out, BTC did react a little on the charts, ticking up briefly. But look at the details and you’ll see that the bulls are very weak: the price remains firmly below $74,000 and can’t even test the gap left by yesterday’s CPI-driven plunge.

Why? Because major players aren’t stupid. 200,000 initial jobless claims can’t possibly offset the massive macro headwind from yesterday’s 0.3% core CPI.

Macro capital now has complete control over BTC’s pricing. The 10-year Treasury yield is
BTC-0.65%
  • 1
Good morning, everyone else’s wives.
post-image
PIEVERSE | Long 🟢 | Bullish | 15-minute 24-hour: +5.11% | Volume: 57.4M USDT. Long rationale: Price above EMA200; EMA20/50/200 in bullish alignment; RSI14 at 62.3; MACD histogram positive; ADX14 at 32.1; volume at 0.66x the 20-candle average; trend pullback/continuation. Entry: 1.8885 Stop-loss: 1.75878 Take-profit 1: 2.05065 | Take-profit 2: 2.14793 | Take-profit 3: 2.27765 Entry price is for reference only; do not chase the price. The strategy is invalidated if the stop-loss level is hit. Technical analysis only; not investment advice. $PIEVERSE
post-image
PIEVERSE+0.58%
$ZEC Observation: A vote opening does not mean an upgrade is finalized; don't mistake the timeline for consensus
November 16 is only the start date for the holder vote, not the date the development fund is revamped, and certainly not the scheduled date for NU 7.1.
According to the timeline released by five coordinating organizations on the Zcash community forum on November 5, the voting window for holders and community groups runs from November 16 to November 30 at 23:59 UTC. The scope of this vote is limited to the share of the development fund allocated to the grant-making organization ZCG;
post-image
ZEC+1.16%
#晒出我的持仓收益 I've got you now, Da Ge, NVIDIA$NVDA haha😃
post-image
NVDA-1.92%
  • 1
ETF outflows hit $700 million, but the real problem isn't that “institutions are fleeing”

Ethereum spot ETFs saw cumulative net outflows of about $764 million in November, with net redemptions nearing $400 million over the past week. BlackRock's ETHA accounted for the overwhelming majority of outflows on multiple trading days, with $129.8 million flowing out on November 11 and $138 million on November 2.

Seeing these figures, it's easy to conclude that “institutions are abandoning ETH.” But stopping there misses a more important structural fact: Ethereum spot buying is losing a source of mar
ETH-1.23%
  • 1
💎 I'M HUNTING FOR THE NEXT 10,000X GEM! 🚀
No big names. No obvious picks. I want the hidden gem before it goes viral! 👀🔥
👇 DROP ONE $TICKER YOU BELIEVE HAS MASSIVE UPSIDE!
Let's see who finds the next moonshot! 🌕
#Memecoins #Crypto #10000x
post-image
The divergence between ZEC and XMR is the key thing to understand about this privacy coin rally

On the same day ZEC fell below 1,000, Monero (XMR) was down 10.41% over the past seven days, while ZEC was down 25.22%. Same sector, same macro shock, but the declines differed by 2.4 times.

This gap is no accident.

In a report on November 10, Gate Research Institute highlighted a key point: the driver behind ZEC’s revaluation this cycle “is not growth in privacy usage,” but rather its positioning as a monetary asset, improved compliance and institutional access, and Naval’s attention as a cataly
ZEC+1.29%
Watching $KITE try to keep rising is like watching someone climb a hill until they’re out of breath. Buyers are still around, but the tank seems almost empty. Maybe it’s time to catch a breath.
Take profit: 0.13642Stop loss: 0.15222
Quick market check:
$VVV : Current price 20.294 - 24-hour change: +20.41%
$BTC : Current price 65,138.2 - 24-hour change: +2.39%
post-image
KITE-0.15%
VVV+0.37%
BTC-0.67%
A whale adds to long positons whenever ZEC falls
live-cover
LIVE1,394
SOXL USDT MARKET UPDATE PREDICTION
live-cover
LIVE1,330
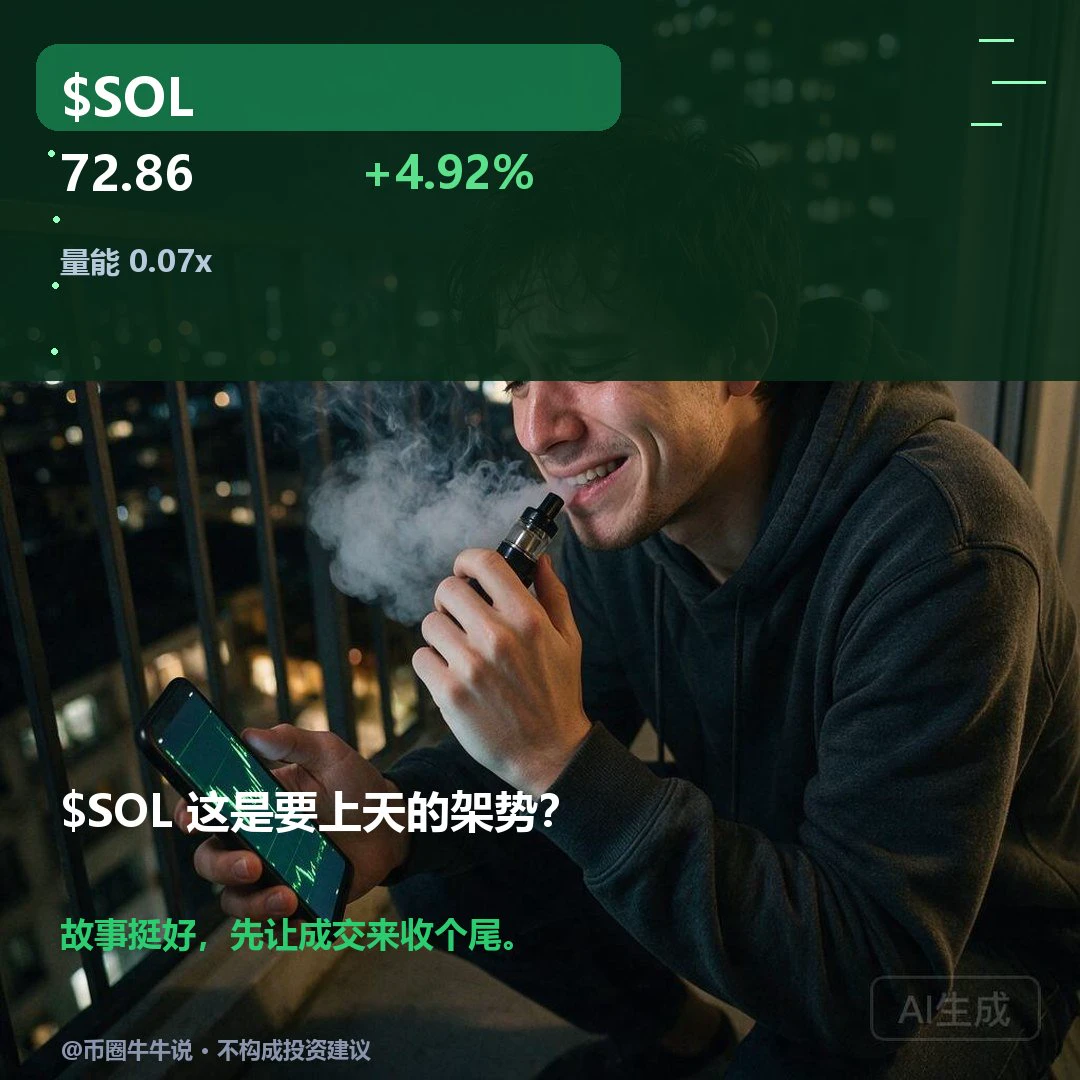
$SOL is currently trading at 72.86, up 4.925% over 24H (range: 67.41–73.28). The 1H trend is relatively strong, with an RSI of 61, while the 4H trend is relatively weak, with an RSI of 31. The structures across the two timeframes are clearly divergent, so a short-term rebound should not be treated as a trend reversal. The upside move can continue only if price holds above the 73.28 resistance; on the downside, a break below the 67.41 support could weaken the short-term structure. In the follow-up review, focus on whether price holds above 73.28 and whether it recovers after losing 67.41. If th
post-image
SOL-0.77%
Stablecoins are down $17 billion, and this is the real reason ETH has “no buyers”

After ETH fell below $2,000, many people asked the same question: Why has it fallen so smoothly, without even a decent rebound?

The answer isn’t in the candlestick chart, but in stablecoin supply data. Glassnode data shows that total stablecoin supply fell by $17 billion over the past month, its largest decline since 2022. USDT’s market cap has fallen by $6.6 billion in the past 60 days, shrinking faster than over the same period after the FTX event. Total stablecoin market cap fell below $300 billion to a 14-m
ETH-1.23%
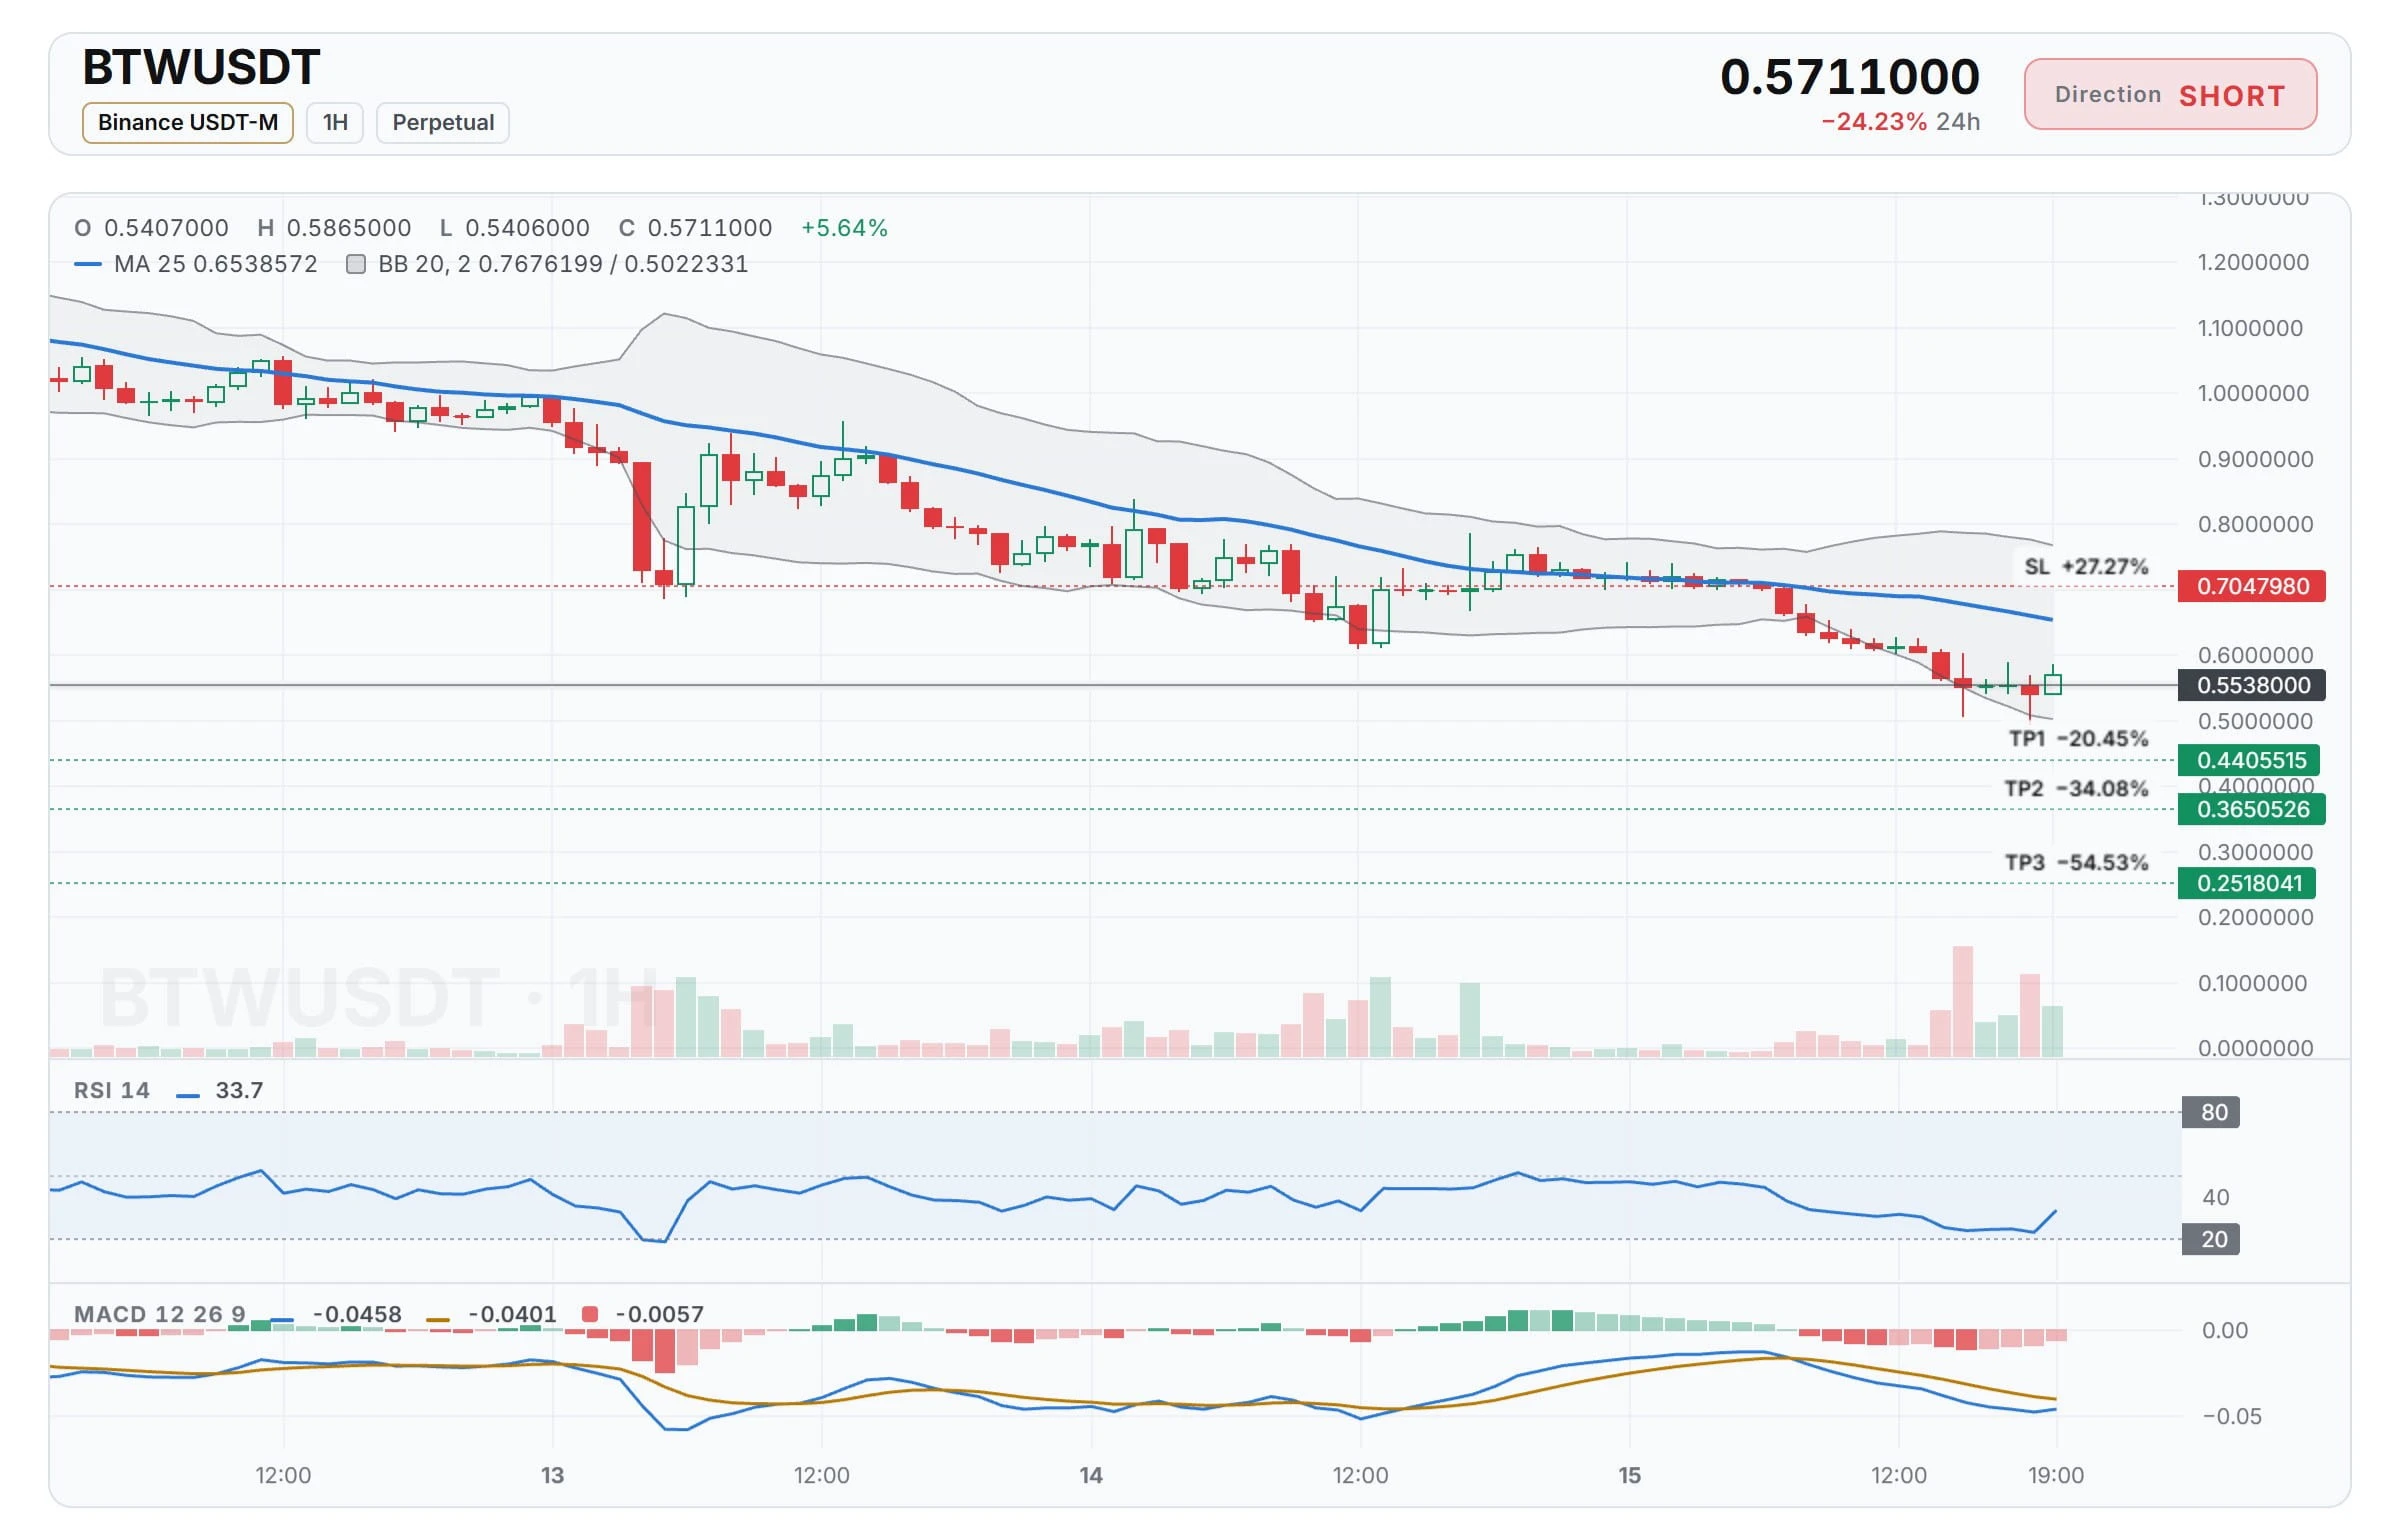
$BTW /USDT SHORT SETUP EXTENDED DOWNTREND

$BTW /USDT

Direction: SHORT

Entry: 0.5538000
Stop Loss: 0.7047980

Targets:
TP1: 0.4405515
TP2: 0.3650526
TP3: 0.2518041

$BTW ‌
post-image
BTW-7.75%
Load More

Join 40 M users in our growing community

⚡️ Join 40 M users in the crypto craze discussion

💬 Engage with your favorite top creators

👍 See what interests you

Trending Topics

GateIPOAccessAnthropic

373.2K Views2.8K Discussing

Gate IPO Access Phase 3 features Anthropic (ANT), with USDT subscription interest starting from 100 USDT. Successful allocations will be delivered as real shares to Gate Stock Accounts. Indicative price: $70–$78/share Subscription: Nov 12–17 (UTC+8) Allocation is not guaranteed. Please manage risk accordingly.

Dr.HanOxfordUnionSpeech

153.4K Views519 Discussing

USOctoberPPIBelowExpectations

491.2K Views1.6K Discussing

View More