Share your thoughts
placeholder
Article
Everyone is about to regret ignoring SYMBOL right now.

$HYPE /USDT - LONG

Trade Plan:
Entry: 82.075 – 82.615
SL: 79.756
TP1: 84.287
TP2: 85.581
TP3: 87.523

Why this setup?
Why now? The daily trend is bullish, and the 1h price is sitting at 82.345, which is also the entry reference level. The 15m RSI at 63.45 shows room to run before overbought territory, while the 1h ATR of 1.078708 tells us the next move could be substantial. If we enter at 82.345, the first target is 84.287, with a deeper objective at 85.581, and the trade is invalidated if we break below 79.136.

Debate:
Are we clean
HYPE+4.64%
THE MOST EXPENSIVE FISHING TRIP EVER 📷 SPOT TRADER
post-image
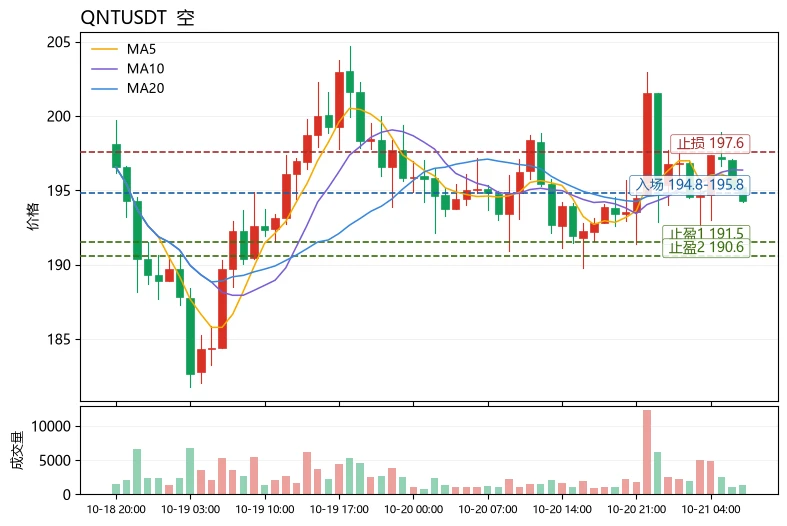
For this $AEON short trade, I’m not watching the key level itself, but the pullback after the false breakout of the previous high. The price pushed above the range’s upper boundary but failed to close back above it, a typical bull trap. It then fell back into the range, confirming the bearish structure.

Technically, the previous high is a clear key level. After the false breakout above the range’s upper boundary, the bulls failed to hold it, and volume did not continue to expand. The rebound was met with resistance at the midpoint, indicating that positions were changing hands and sellers we
post-image
AEON+2.76%
BTC+1.52%
LAB+9.30%
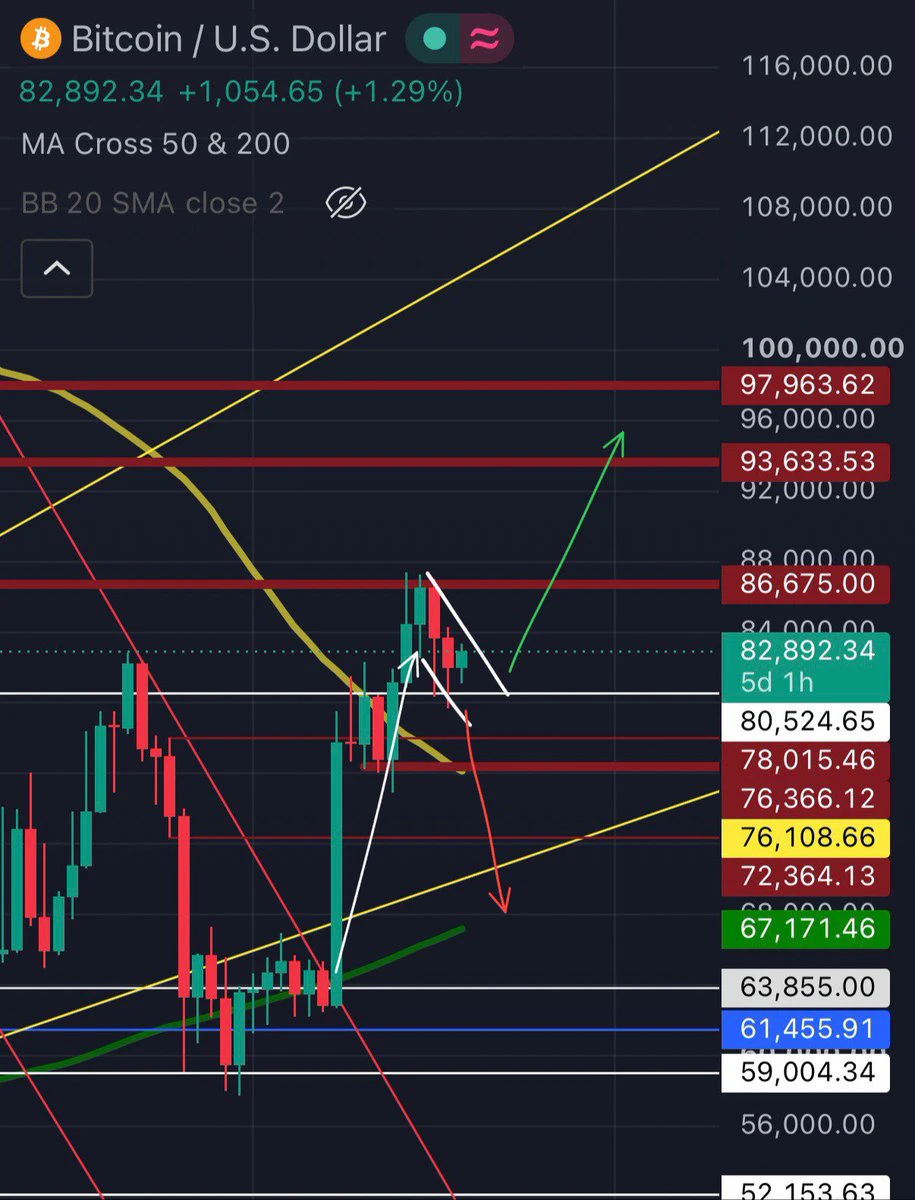
$BTC
consolidating hard after failing to hold the breakout.
Spiked from 62,538 to 82,278, now back at 76,394 (+0.83%) with SuperTrend flipping red.
Macro remains the key driver: CPI, Fed policy and ETF flows are keeping pressure on the market. Bulls need to reclaim 78K to 80K, while losing 76.5K could open 72K to 74K.
post-image
BTC+1.52%
  • 5
  • 2
Last chance to watch this free class.
The 3 strategies for generating higher returns than the market 👇
I’m back again!
The U.S. Dollar Index failed to break above 100.4, retraced to the 50% level on the one-hour timeframe at its lowest point, and then continued to rebound. Therefore, as long as it cannot rise above 100.4, the low of its next pullback should be lower than that of this pullback. In other words, as long as it fails to hold above 100.4, the U.S. Dollar Index will move sideways to the downside.
Conversely, gold’s pullback levels will become increasingly higher each time. As long as it fails to hold firmly above 100.4, gold will move in a sideways-to-upward pattern.$XAUUSD Personal
XAUUSD+2.31%
  • 10
Bitcoin and Ethereum Market Analysis📊
Friday, Saturday, Monday
BTC+1.02%
ETH+2.83%
  • 1
$TRX Tron Preparing For Breakout To The Upside
Potential retest of ATH possible at $0.44 and then new ATH is possible.
NFA, DYOR ⚠️
#Crypto #Trading #TRON #TRX
post-image
TRX-0.59%
#GT
Here is my GT Token spot trading chart;
based on current data, GT is trading around $9.31. In recent days, the price has shown reactions within the $8.90–$9.50 range, and on September 5th, it reached an intraday high of $9.62.
GT/USDT spot trading plan
Zone Level Plan
🟢 Main buy $8.90–$9.05 Staged buying zone
🟢 Strong buy $8.65–$8.90 For deeper pullbacks
🟢 Final support $8.35–$8.50 High-risk second/third tier
🟡 Pivot $9.30–$9.40 Indecision/equilibrium zone
🔴 Resistance 1 $9.45–$9.50 Initial profit/supply zone
🔴 Resistance 2 $9.60–$9.65 Strong resistance; previous peak area
🔴 Resist
GT+3.09%
  • 3
Bro, I think you’re a real pro, and I want to follow you to make money too. With the way you lead trades, stacking positions and weathering 50–70-plus points, my 100-position size with 0.01 lots would have blown up long ago. I took a look at the P&L: $XAUUSD
XAUUSD+2.31%
$FLOCK STILL LOOKS STRONG ... BUT $0.090 IS THE KEY
FLOCK is once again showing strong momentum, pushing back toward $0.080 after a solid rebound. However, resistance at $0.090 remains strong and is still the main key level that needs to be broken. A clean breakout above $0.090 could open the door to the next bullish move, targeting $0.10+. Until then, expect volatility around resistance. Trade on $FLOCK .
post-image
FLOCK+8.52%
$BULLA Signal】Long + 4H MA support, 1H momentum awaiting recovery
$BULLA 4H price 0.0978 hovering above EMA20 0.0925, 1H MACD green bars expanding to -0.0025, 1H Bollinger lower band 0.0927.
🎯 Direction: Long
⚡ Entry/pending order: 0.0974867 - 0.0977800
🛑 Stop loss: 0.0968022
🚀 Target 1: 0.0992467
🚀 Target 2: 0.0999801
🛡️Trade management:
- Execution strategy: Reduce the position by 50% after reaching Target 1, and move the stop loss up to breakeven. If the price falls back to the entry level, exit automatically to protect the principal.
Deep-dive logic: The 4H MACD bullish histogram h
post-image
BULLA-14.01%
$UAI Signal】Short + 1H rebound exhaustion, moving-average resistance
$UAI RSI 1H 52.59, 4H 40.33; resistance from the 0.4126 Bollinger upper band, with the 1H MACD red bars contracting.
4H EMA20 0.4136 and EMA50 0.4817 remain overhead, while selling pressure is concentrated around 1H EMA50 at 0.3912. Order book bid/ask 1.36, depth imbalance 15.28%, with active fund support but weak upside breakout momentum. Funding rate 0.0050%, OI stable.
🎯Direction: Short
⚡Entry/Limit order: 0.388730 - 0.389900
🛑Stop loss: 0.393799
🚀Target 1: 0.384052
🚀Target 2: 0.381127
🛡️Trade management:
- Execution
post-image
UAI+10.41%
To be honest, I’m surprised this trade has survived until now; luck played a significant part. A few days ago in the early morning, $GRVT surged to a high, but volume failed to follow, and the overhead resistance was obvious. What I saw wasn’t strength—every upward push fell just short. So at the time, I only advised against chasing longs and suggested waiting for a pullback.
From 0.2933 all the way down to 0.1749, the short position delivered +794.84%. The timing was spot-on, and this profit felt great.
The market is waited out, and profits are held onto. Don’t let profits inflate your ego,
post-image
GRVT+4.86%
BTC+1.52%
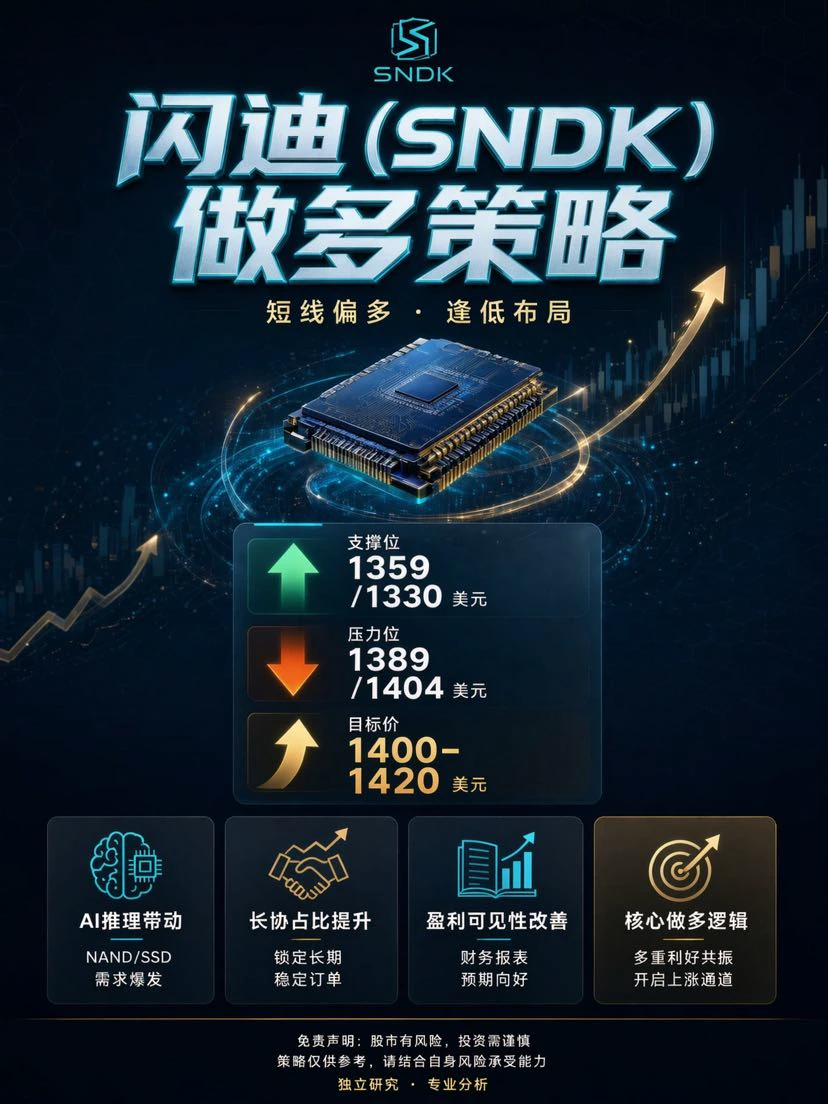
SNDK+3.89%
BREAKING: The SEC has approved a temporary exemption allowing limited trading of tokenized U.S. stocks on certain onchain venues.
Eligible platforms will be able to let users trade blockchain-based versions of U.S. stocks through automated market makers and liquidity pools.
post-image
【Mid-Autumn】🔹Less Than 24 Hours After the CLARITY Act Setback, a Crypto Tax Reform Bill Is Moving F
live-cover
LIVE2,118
One evening, Minh sent me a photo. It was an old piece of paper that read: “If the price falls to this level, you must sell no matter how optimistic you are.”
I asked, “How long have you kept it?”
“Five years.”
Five years later, he himself had to use that rule. At that time, he had a large profit. The market began to wobble, but he still said, “I still believe in the long term.”
I asked, “Then why did you write this rule five years ago?”
He fell silent, then smiled: “Because back then I had no money in the market. I had no position, so I was very rational.”
That’s right. Before entering a trad
BTC+1.52%
During today’s early session, there was some volatility due to the Federal Reserve’s meeting decision, but it was not very large—around 1,000 points. So why didn’t the price continue falling? A rate hike is clearly bearish, isn’t it? Because the large funds had already exited early to avoid risk. The main players took advantage of the news to liquidate both longs and shorts, which resulted in this kind of huge wick. The decline has currently stopped because large funds have been entering gradually. Since the uncertainty surrounding the Federal Reserve has been resolved, they now dare to enter.
post-image
BTC+1.52%
ETH+3.49%
Market update
live-cover
LIVE1,638
Liquidity isn't just cash. It is the ability to make a decision later.
When markets fall, not every investor has the same options: some are fully invested, while others have preserved room to act.
That is where the hidden value of liquidity appears.
An investor who is fully positioned may need to sell an existing position before taking advantage of a new opportunity.
Liquid capital creates another option:
Wait.
Evaluate.
Act if necessary.
That's why viewing the stablecoin market simply as “parked money” can be incomplete.
The total stablecoin market is now around $290.6 billion, highlighting h
post-image
xxx40xxx
Seeing a 10% APY doesn't necessarily mean you are actually earning 10%.
The headline yield and the return you ultimately keep are not always the same thing.
Fees, token prices, inflation, depeg risk and platform risk can all change the final result.
For example, if part of a high APY is paid in a platform token, a decline in that reward token can reduce the effective return.
A better framework is:
Nominal APY
– fees
– realized losses
– asset/depeg risk
= a more realistic return.
With the stablecoin market now worth roughly $290 billion, yield opportunities are naturally attracting more attention.
But a larger market also means more choices — and therefore more research.
So instead of asking:
“What's the APY?”
ask:
“Where does this APY come from, and what risk am I taking to earn it?”
💬 Which cost or risk do you think investors overlook most when calculating APY?
Risk Note: Yields can change, and past performance does not guarantee future results.
This content is not investment advice. Always perform your own research before making financial decisions.
$BTC $GT $ETH
#每周来晒 #牛熊未定闲钱该放哪 #WhereToParkStablecoinsWhileWaiting #GateSquareMidAutumnReunion #Gate广场中秋团圆局
BTC+1.52%
GT+3.09%
ETH+3.51%
Load More

Join 40 M users in our growing community

⚡️ Join 40 M users in the crypto craze discussion

💬 Engage with your favorite top creators

👍 See what interests you

Trending Topics

GateTopsStockPerpetualCoverage

36.02k Views1.77k Discussing

According to the latest DefiLlama report, Gate has listed 385 stock-related perpetual contracts, ranking first in coverage; average daily volume is about $1.15B and average open interest about $738M, both ranking third in the industry; liquidity depth for its five highest-volume contracts — SNDK, SKHYNIX, SPCX, SOXL, and MU — ranks first across the board. How do you view Gate leading in both coverage breadth and liquidity depth? [👉 Full Report](ttps://defillama.com/research/spotlight/deep-enough-trade-gate-case-tokens-stocks)

GateTrenchesExclusive0GasTrading

46.21k Views819 Discussing

FedHikes25bpsForFirstTimeIn3Years

30.77k Views8.16k Discussing

View More