Share your thoughts
placeholder
Article
On July 18: ¥483; the account balance is now ¥92,800. I withdrew 5k midway, completed 10,000 U, and grew it 200x. I’m really lucky. I couldn’t hold my SAND long position and even stopped out for more than $1,000. If I had held that SAND long position, the account balance would be over ¥100,000 now. What a pity....
SNDK+11.98%
  • 1
Violent whipsaw after nonfarm payrolls overnight, ETH surged and plunged—how should we respond now?💛
Last night, after the nonfarm payrolls data was released, the market went on a roller-coaster ride.
ETH quickly plunged from 2547 to a low of 2431, then rapidly recovered after the sharp drop. It is currently oscillating within the 2440‑2460 range.

The one-hour EMA has formed a death cross, and the short-term rebound continues to face resistance at 2465.
The liquidation heatmap clearly shows that heavy selling pressure has accumulated in the 2480‑2500 area above, making it a strong resistanc
post-image
ETH-2.61%
I’ll also launch a challenge: the challenge is on the SOL and RH chains, using LP to farm an A7. Why isn’t there BSC? It can’t be done on BSC. Nothing I can do—can’t do it even if I want to. Just watch it unfold. Going to bed.
@lpagent_io
SOL-2.19%
Pullbacks in a bull market can be just as damaging. BTC surged to 82282 before falling back to 79500, with the market directly entering a tug-of-war between bulls and bears.
The long-term moving averages are still trending upward, so the uptrend has not been directly declared over, but the short-term trend has clearly weakened. The MACD red bars on the 2-hour chart continue to contract, indicating fading bullish momentum; a large bearish candle on the 15-minute chart sent prices plunging, with all moving averages turning into resistance, making rebounds vulnerable to selling pressure. Those wh
post-image
BTC-1.93%
9.5 BTC Market Trend: Silk Road Analysis
Long: If the pullback holds above 79100‑79300, enter a small long position
First target: 79700‑79800; if it breaks through, look toward 80500
Defensive stop-loss: 78700
Short: If the rebound reaches 79800‑80000 but meets resistance and fails to rise further, enter a small short position
First target: 79400‑79200; if it breaks down, look toward 78800
Defensive stop-loss: above 80300
Range-bound shakeout market; avoid chasing rises or selling into declines
The current market is in a repetitive range-bound pattern, with opportunities for bo
post-image
BTC-1.93%
ETH-2.61%
#Eth
Ethereum price broke above the $2,500 resistance before facing another rejection, while fresh Ethereum news around 35 launches has renewed debate over whether $ETH can outperform Bitcoin this cycle. Traders are watching the $2,550 level, while new products across the network add to the market story
post-image
ETH-2.60%
BTC-1.91%
2026‑09‑05 ETH‑USDT Perpetual Contract Technical Analysis Strategy
Content is for technical analysis purposes only and does not constitute trading advice. Contract trading carries extremely high risk.
Key Levels
Resistance: 2510‑2540, 2570‑2600
Support: 2400‑2420, 2330‑2360
Market Overview
The medium- to long-term bullish structure on the daily chart remains intact. After the surge, the market has entered high-level consolidation, with the MACD red histogram contracting and upward momentum slowing. Price action remains highly correlated with BTC. The 4-hour chart is moving within a range, with
post-image
ETH-2.61%
2026‑09‑05 BTC‑USDT Perpetual Contract Technical Analysis
Market conditions are for technical analysis only and do not constitute trading advice; contracts carry high risk
Key Levels
Resistance
First resistance: 80700‑81200
Strong resistance: 82100‑82400 (recent high, heavy trapped-holder selling pressure zone)
Support
First support: 78400‑78800
Strong support: 75400‑75800 (daily Bollinger middle band, key defense line for the bulls)
Market Conditions
The overall bullish structure on the daily chart remains intact. The price met resistance after surging above 82200, then came under pressure an
post-image
BTC-1.93%
Everyone’s staring at the 15m RSI bounce on $H /USDT—but that’s the exact trap I’d avoid.

$H /USDT - SHORT

Trade Plan:
Entry: 0.08131 – 0.08203
SL: 0.08515
TP1: 0.07906
TP2: 0.07733
TP3: 0.07472

Why this setup?
- 1D trend is **bearish**, and the 4h MTF confirms a 95% short confidence—not a guess.
- The 15m RSI at 54.51 is a weak retrace, not a reversal; price is hugging the entry ref (0.08167) with tight ATR (0.001448).
- Why now? TP1 at 0.07906 is a 3.2% drop from entry—if we lose 0.07944 (invalid), the short thesis dies. But until then, gravity wins.

Debate:
Are you fading this 1
H+5.46%
Everyone’s long $CL /USDT—but the range top just whispered a secret most missed.

$CL /USDT - SHORT

Trade Plan:
Entry: 90.95 – 91.19
SL: 92.21
TP1: 90.21
TP2: 89.64
TP3: 88.79

Why this setup?
Why now? The 4h structure is stalling at 91.07 with a 55% short bias, yet the 1D trend refuses to commit—pure chop. RSI on 15m sits at 55.07, not oversold, giving shorts room to breathe. ATR 0.47 on 1h means volatility is tight, but TP1 at 90.21 is a clean 0.9% grab before the range’s lower lip. If price rejects 91.19, the path to 89.64 (TP2) opens like a trapdoor. This isn’t a trend trade—it’s a pre
CL-0.31%
new market update
live-cover
LIVE984
I was tempted again on the day U.S. stock options launched
On September 2, Gate officially launched U.S. stock options trading. The first phase covers 9 popular assets, including Nvidia, Tesla, Apple, and Meta.
To be honest, I had only read about options in books before and had never traded them. But Gate has made them into a USDT cash-settled product, so there is no need to open a U.S. stock account—you can trade directly in the app.
I haven't dared to buy any yet, but I'm already learning. Gate Academy has quite a few tutorials on options. Once I understand them, I might actually give them a
SNDK+11.88%
162,000! Nonfarm payrolls blew up, crushing market expectations
Guys, did you see last night's nonfarm payrolls data? It was absolutely explosive!
Data released by the U.S. Bureau of Labor Statistics on September 4 showed that nonfarm employment increased by 162,000 in August. What did the market expect? 55,000 to 56,000. The actual figure was nearly three times expectations, exceeding the forecasts of every economist surveyed by Bloomberg. Wells Fargo, the most optimistic major investment bank beforehand, forecast just 80,000—less than half the actual figure. With forecasts from major institu
NVDA+0.87%
BlackRock ETFs bought $117.4M in Bitcoin and $57.8M in Ethereum, while U.S. spot Bitcoin ETFs saw nearly $987M in weekly inflows.
BLK-0.37%
BTC-1.91%
ETH-2.60%
The only thing preventing me from coding is that I have no budget left
post-image
Crypto Prediction and Trading Insights
live-cover
LIVE1,586
These returns have me feeling nervous, worried the market will wake up tomorrow and blacklist me.
A few days ago, the last thing I checked before bed was the chart. $SNDK pulled back to around 1500.51 and stopped moving. It was bottoming out without breaking support, while funds were still quietly entering. I felt this level had potential, so I casually opened a long position.
The first thing I did after waking up was check my phone: 1771.62 had shot up, and +1282.92% was in the bag. After dragging on for so long, seeing it finally break out feels incredible.
Don’t rush to add to your positio
post-image
SNDK+11.98%
ETH-2.61%
ZEC+6.89%
$AKE is breaking out local consolidation range on 1h timeframe 👀
Expecting another massive 5x+ Bullish Rally 📈
Free Signals:
#Crypto #AKE #AKEUSDT #AKECoin #cryptocurrency
post-image
AKE+17.70%
The most useless form of AI quant trading: letting AI directly read the charts and make decisions. Everyone’s training data is more or less the same, so they make similar moves at the same moment, rendering the trading itself ineffective.
What works is encoding your own understanding into a program. Yesterday, we walked through this process: install AlphaFox CLI in Cursor, choose a strategy in natural language, backtest it, then deploy it.
The image shows the backtesting panel, with the equity curve, trade points, and RSI all displayed. The methodology and data are laid out openly, with no ret
post-image
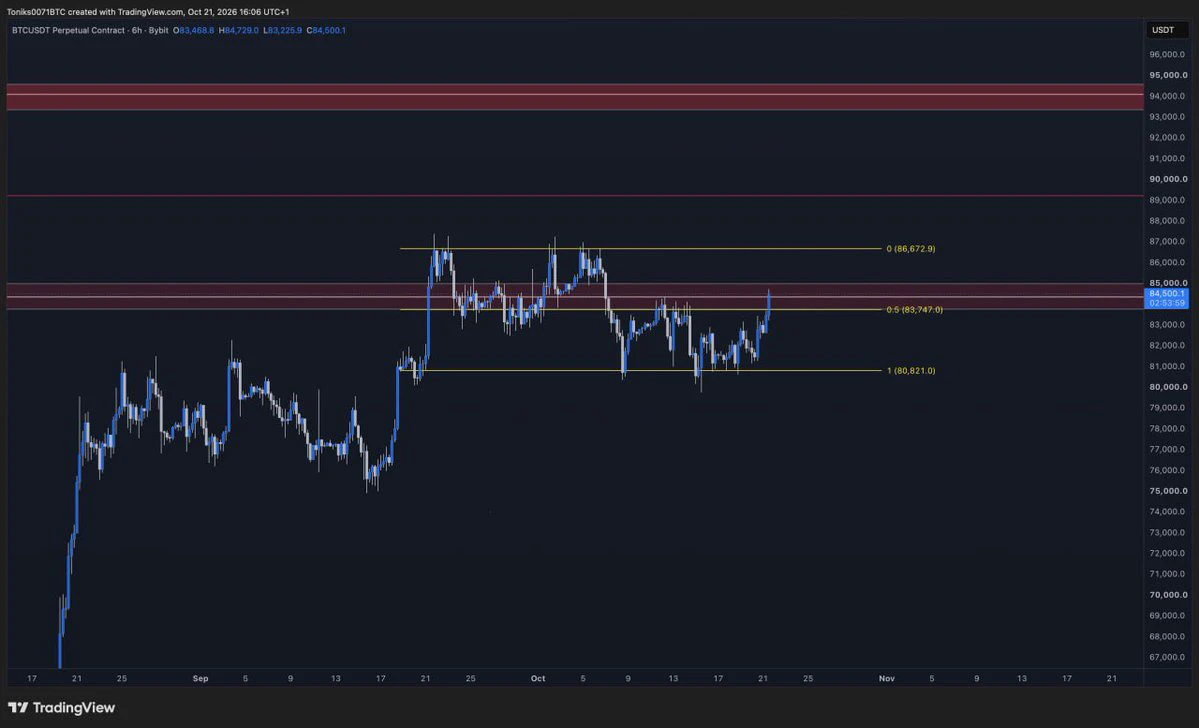
In 2026, the Bitcoin market is expected to remain range-bound, with a pullback to around 75,000 being the most likely scenario; a rally to 85,000 during the year enjoys strong consensus; breaking above 90,000 will be somewhat difficult and is considered a neutral-to-optimistic scenario.
post-image
BTC-1.91%
Load More

Join 40 M users in our growing community

⚡️ Join 40 M users in the crypto craze discussion

💬 Engage with your favorite top creators

👍 See what interests you

View More