Square
Following
Hot
News
Notifications
Profile
Share your thoughts
placeholder
Article
1h workout
A meal of pork intestine and chicken wing burgers
Canceled each other out 😭
post-image
Three trillion dollars evaporated in a single day. I stared at that number for ages, repeatedly trying to wrap my head around it: it’s roughly equivalent to a mid-sized economy’s GDP for an entire year, and close to several percentage points of the S&P 500’s total market cap. The Nasdaq 100 closed down 6.4%—based on the index level at the time, that’s a plunge of more than a thousand points. Almost none of the heavyweight tech stocks were spared. Names that usually prop up the index—Apple, Microsoft, Nvidia, Tesla—collectively became a drag. The VIX fear gauge surged at the same time, while Tr
post-image
SPYX+0.01%
AAPL-1.50%
MSFT-3.65%
NVDA-9.33%
TSLA-10.84%
  • 5
Trenches
BTC
B
bade
b
BTC
C5xp...pump
Market Cap
$.
Change
.
24h Vol
$.
Holders
.
ZIG
Z
bade
b
ZIG
0x8c...1145
Market Cap
$.
Change
.
24h Vol
$.
Holders
.
GM
G
bade
b
GM
0x13...7777
Market Cap
$.
Change
.
24h Vol
$.
Holders
.
STONK
S
bade
b
STONK
6GmA...UNgx
Market Cap
$.
Change
.
24h Vol
$.
Holders
.
DESSA
D
bade
b
DESSA
npz2...pump
Market Cap
$.
Change
.
24h Vol
$.
Holders
.
Keep track of market trends
live-cover
LIVE1,914
Why can prices still fall when large buy orders are sitting on the order book?

In cryptocurrency trading, many people watch the order book and try to judge market direction based on buy and sell orders. When a large number of buy orders appear on the screen, some traders believe support below is strong and that prices should not fall easily.

But reality is often not that simple. A large number of buy orders does not mean prices will definitely rise; a large number of sell orders does not mean prices will inevitably fall.

First, orders are not the same as actual trades.

The order book shows
post-image
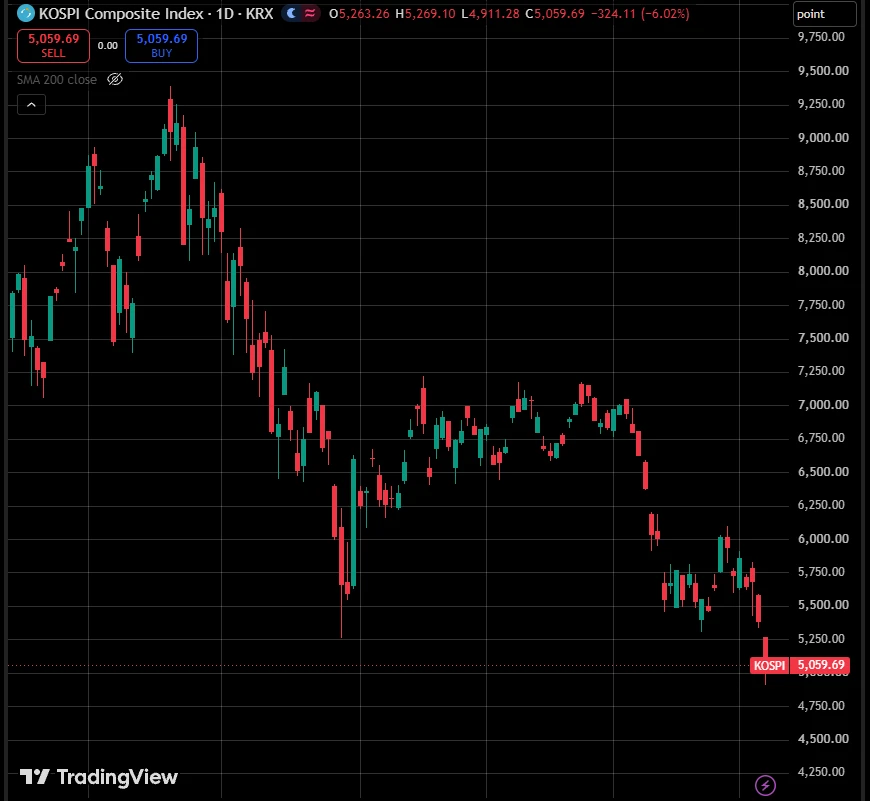
BREAKING: South Korea’s stock market is in FREEFALL.
The KOSPI crashed -8.8% minutes after the open, triggering a circuit breaker and breaking below 5,000.
That is ~-11% in 2 days and ~-46% from its June record.
Is this the first domino of the AI crash?
post-image
$BIRB The daily chart is starting to rally on increased volume. It previously reached 0.2, and volume is gradually picking up. Go long with the trend!
post-image
BIRB-16.68%
  • 1
11.6 Evening Market Brief

Evening market analysis/Weak oversold recovery ahead of the nonfarm payrolls report; bearish structure remains unchanged, waiting for the data to set the direction

The nonfarm payrolls report is in its final countdown, and after a series of sharp declines, the market has entered an oversold technical recovery phase

BTC and ETH have both rebounded slightly from their lows, but the overall bearish structure remains intact. Rebound volume is clearly insufficient and momentum is limited. The market will likely remain weak and range-bound until the data is released

BTC
BTC-0.65%
ETH-1.23%
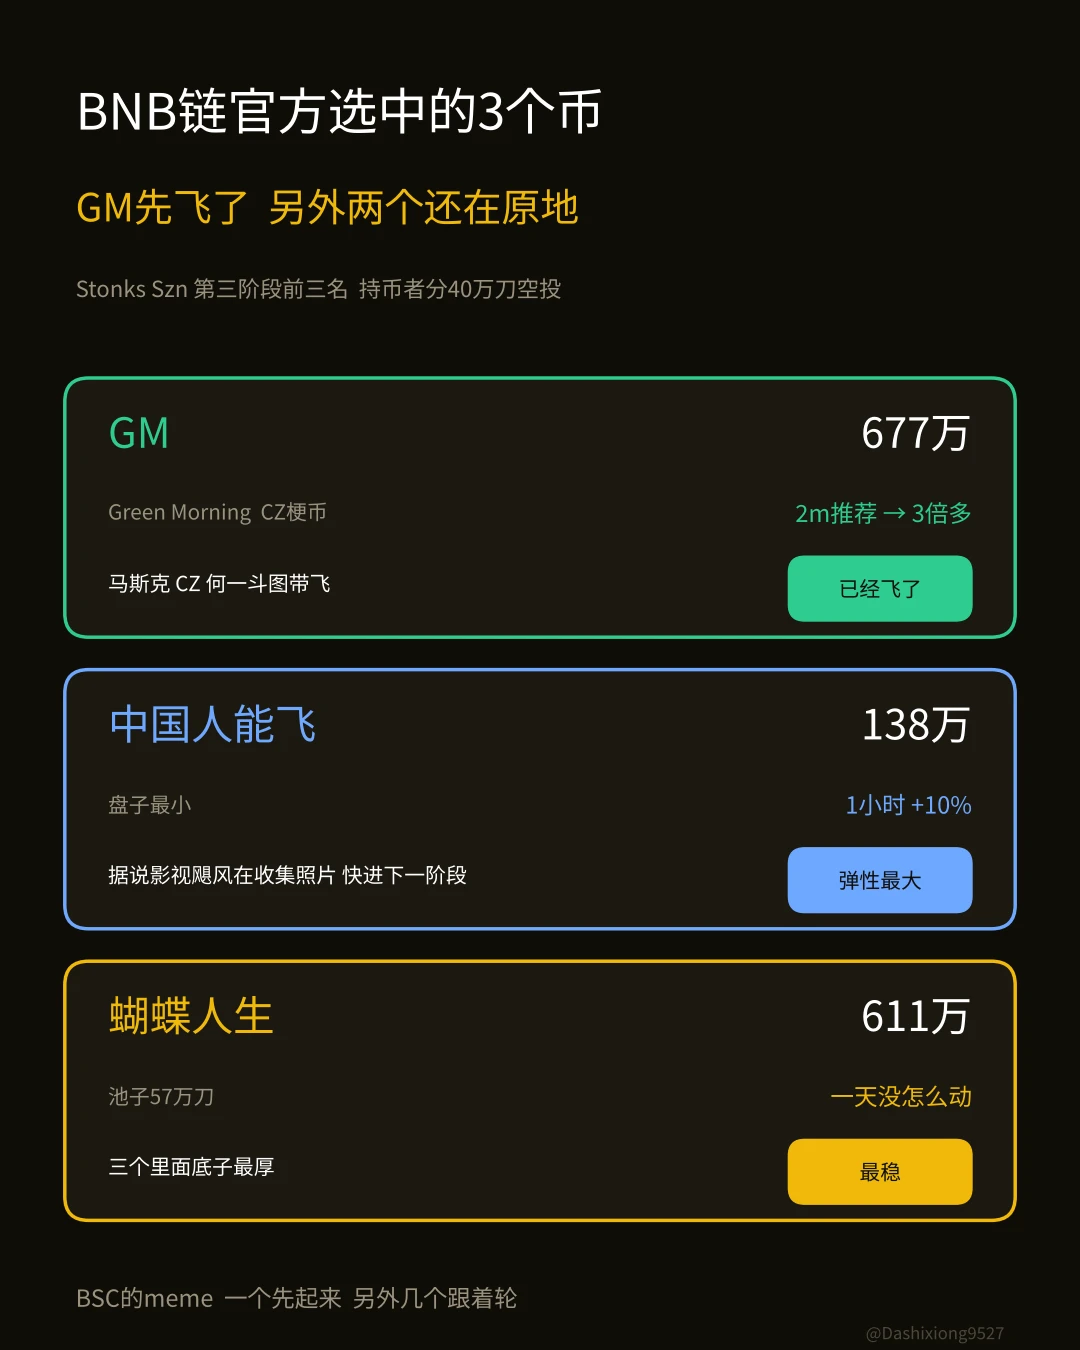
The BNB Chain official $4 million Stonks Szn campaign’s top three in the third stage were just three coins: GM, Chinese People Can Fly, and Butterfly Life. Holders of these three coins all received a $400,000 airdrop.
GM took off first today.
GM: Recommended by Dachao2m, it surged to 6.77 million today after Musk, CZ, and He Yi traded memes, more than tripling.
CA: 0x13920fe6467e9e3c852b8d365a036c995f0f7777
Chinese People Can Fly: It’s now at 1.38 million, up 10% in an hour. Film Hurricane is reportedly collecting photos of “Chinese people can fly,” and the final batch of names is about to be
post-image
BNB-0.76%
GMWAGMI+0.00%
Good morning, CT
Blessed Friday 🤍🏖️
post-image
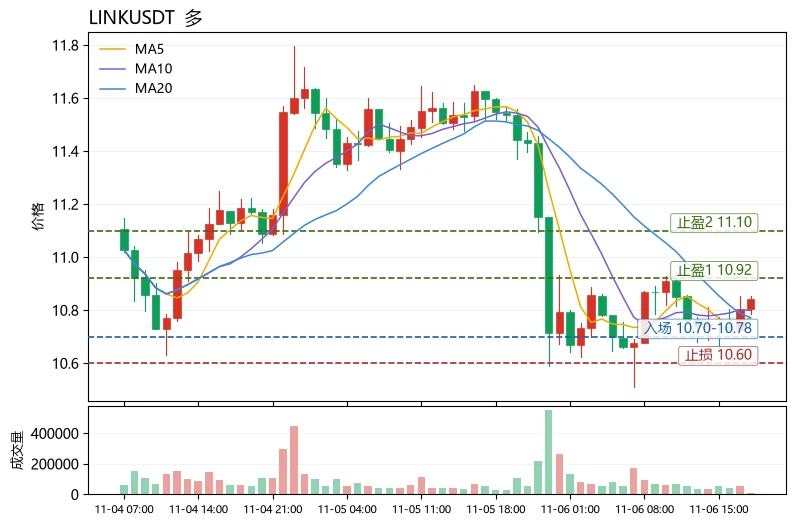
The most unusual detail in today's market action is not the decline, but the structure: $LINK fell 6.01% in 24 hours, yet its price remains near the almost overlapping MA5 (10.7716) and MA20 (10.7722), with just 0.0006 between the two moving averages. Despite the sharp drop, the price has not moved away from the mid-term moving averages, indicating a “price pullback, trend intact” compression rather than a trend breakdown. This pattern is a good way to explain a reusable chart-reading method: use the distance between moving averages to judge whether a trend is healthy. In a healthy pullback,
post-image
LINK-0.18%
UNI+3.05%
$BTC Long positions entered at 75388 can move their stop-loss to breakeven; in the 77000-78000 rebound range, short-term traders can reduce their positions and take profits.
post-image
BTC-0.65%
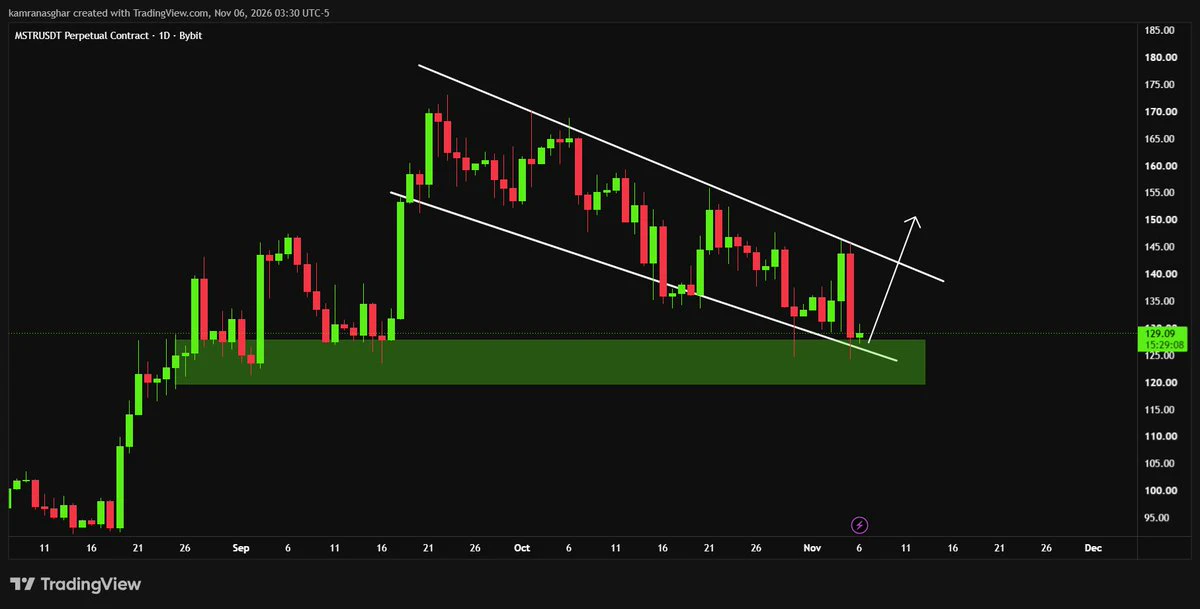
$MSTR holding strong at key demand block. Descending channel support retested for a planned reversal push toward $150.00
post-image
MSTR-9.18%
  • 4
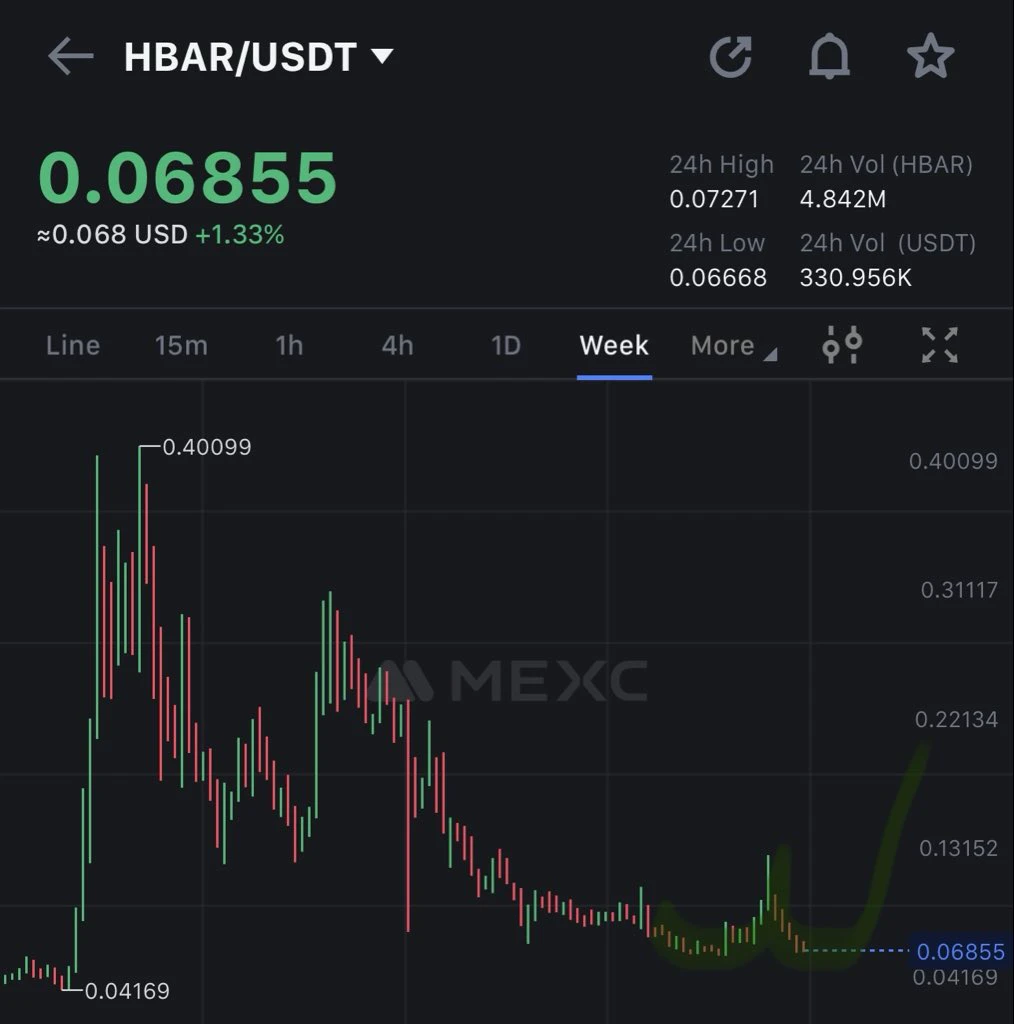
$HBAR might 2x-3x in the next 3-4 weeks.
post-image
HBAR-1.36%
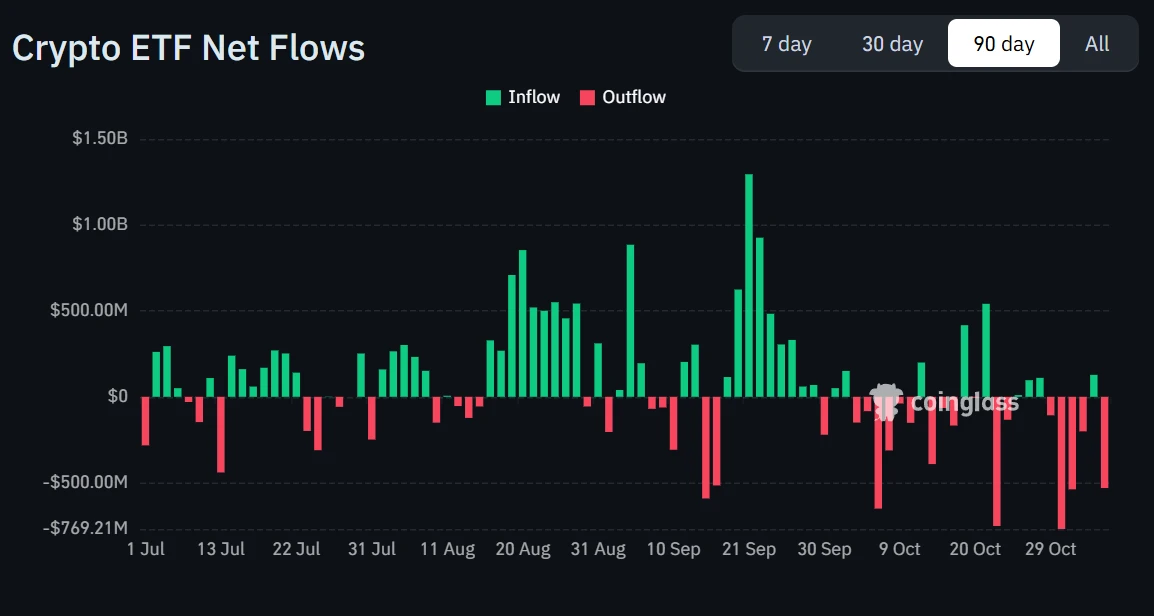
Here's something I think crypto investors have underestimated about Bitcoin ETFs.
We spent years celebrating institutional access as though it would permanently change how Bitcoin trades and in many ways, it has. But the same vehicle that allows institutions to accumulate billions in Bitcoin also makes it incredibly easy for them to reduce exposure when market conditions change.
They're not necessarily making a philosophical decision about whether Bitcoin is the future of money, sometimes they're simply adjusting portfolio risk. That distinction matters because wider institutional adoption do
post-image
BTC-5.05%
  • 2
  • 1
After the U.S. stock market plunge, are gold, utilities, and consumer stocks poised for a comeback? The next round of capital rotation may already be underway!

As tech stocks tumble from their highs, investors naturally look for new safe havens. In this market correction, interest in defensive assets has clearly picked up. Gold, utilities, consumer staples, and some companies with stable cash flows all deserve a place on the watchlist. The case for gold is mainly driven by safe-haven sentiment and changes in real interest rates; utilities benefit from relatively stable demand, but their valua
AMD-17.64%
  • 31
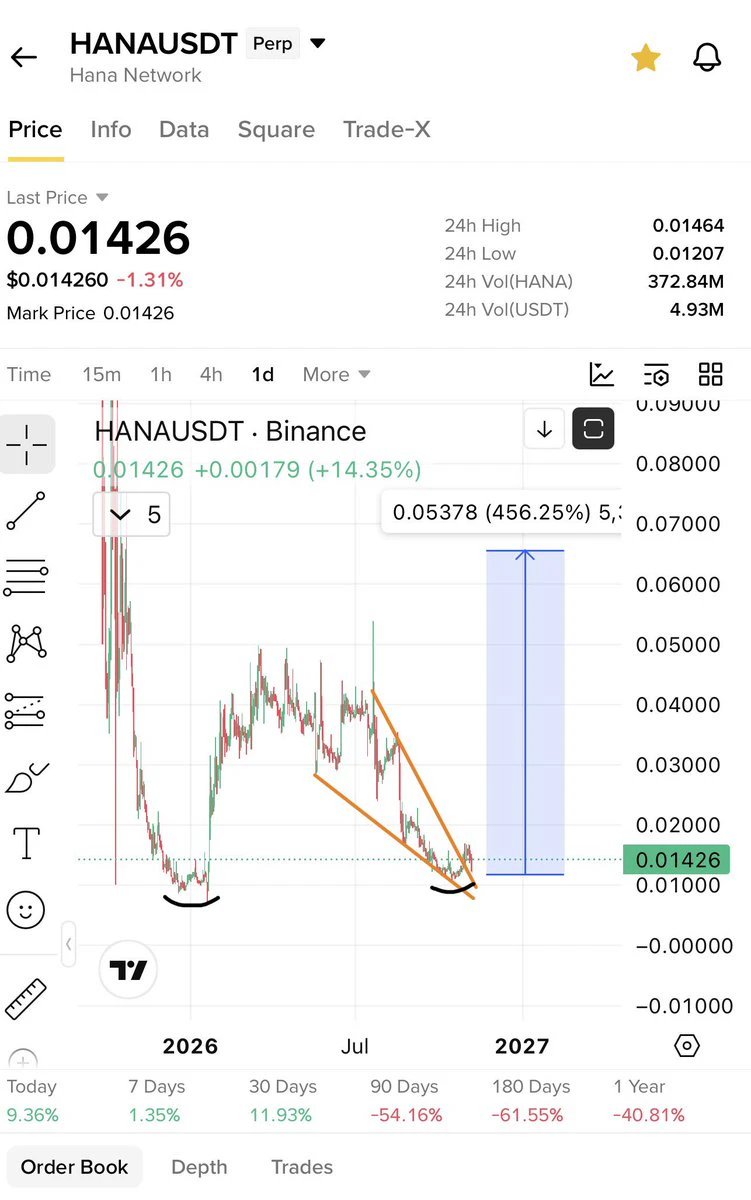
$Hana only up from here
post-image
HANA-3.22%
Layout: Bitcoin, Ethereum, Dogecoin
live-cover
LIVE1,492
  • 1
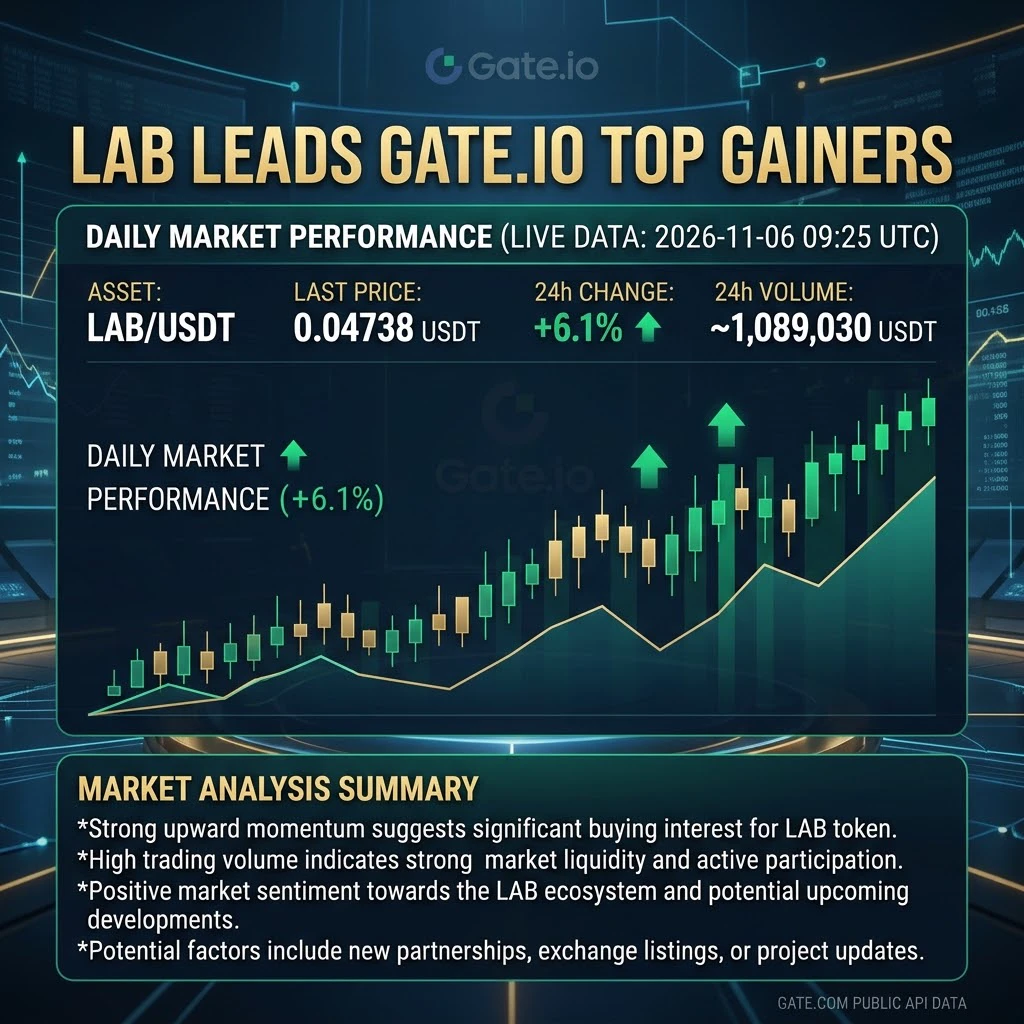
LAB RISES 6.1%: WHAT CHANGED, AND CAN THE MOMENTUM LAST?

THE FIRST MOVE: WHERE DID LAB STAND?

LAB attracted market attention on November 6, recording a 6.1% gain against USDT. At 09:25 UTC, LAB was trading at $0.04738, with approximately $1.089 million in 24-hour trading volume.

The move placed LAB among the day's leading gainers. However, a positive daily percentage does not automatically mean a lasting recovery. The important question is whether buyers can maintain interest beyond the initial price increase.

WHAT HAPPENED BEFORE THE RALLY?

LAB is connected to an integrated trading ecosy
post-image
LAB-4.47%
Why can tighter stop-losses sometimes lead to more consecutive losses?

In cryptocurrency trading, many people believe that tighter stop-losses mean lower risk. This idea has some merit, but if market volatility and trade structure are ignored, overly tight stop-losses may cause traders to exit frequently and miss moves that otherwise unfold as expected.

For example, suppose you buy Bitcoin near a certain price, planning to profit from a continuation of the trend. If your stop-loss is too close to your entry price, a normal price pullback may trigger it. Then, when the price rises again, you
post-image
BTC-0.67%
Load More

Join 40 M users in our growing community

⚡️ Join 40 M users in the crypto craze discussion

💬 Engage with your favorite top creators

👍 See what interests you

Trending Topics

USStocksFaceHistoricSelloff

6k Views3.68k Discussing

U.S. stocks suffered a sharp selloff on Thursday, with the Nasdaq closing down more than 5% and the Philadelphia Semiconductor Index falling over 12%. AI and chip stocks including $NVDA and $AMD were hit especially hard. Markets are reassessing AI valuations, data-center spending and future returns. Is this just short-term deleveraging, or the start of a deeper correction in the AI trade? Which sectors are you watching next?

GateLaunchesPoSECProofOfSecurity

16.18k Views596 Discussing

USNonfarmPayrolls

14.21k Views4.07k Discussing

View More