




Square
Following
Hot
News
Notifications
Profile
Share your thoughts
placeholder
Article
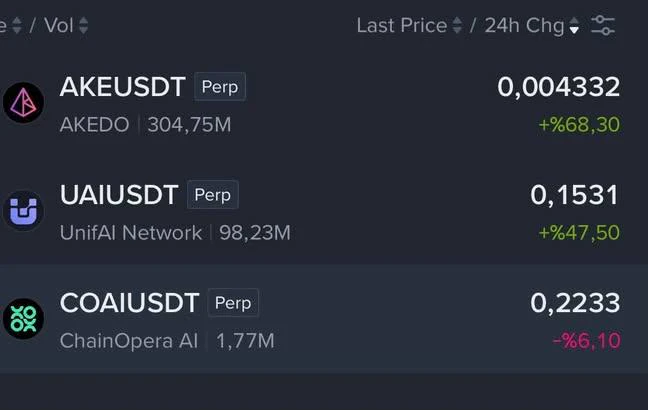
$COAI will pump like $AKE and $UAI ❤️💪🏻
#USStocksFaceHistoricSelloff
post-image
COAI-3.95%
AKE+6.07%
UAI-7.58%
#USNonfarmPayrolls #USNonfarmPayrolls

The US Nonfarm Payrolls report is one of the most important economic events for global financial markets. Investors, traders, and financial experts closely watch this report because it provides a clear picture of employment growth and the overall strength of the United States economy.

Nonfarm Payrolls measures the number of jobs added or lost in the United States during the previous month, excluding agricultural employment and certain other categories. This information helps investors understand whether businesses are expanding, hiring more workers, or b
BTC-0.67%
ETH-1.26%
  • 3
Trenches
ZIG
Z
bade
b
ZIG
0x8c...1145
Market Cap
$.
Change
.
24h Vol
$.
Holders
.
BTC
B
bade
b
BTC
C5xp...pump
Market Cap
$.
Change
.
24h Vol
$.
Holders
.
STONK
S
bade
b
STONK
6GmA...UNgx
Market Cap
$.
Change
.
24h Vol
$.
Holders
.
DESSA
D
bade
b
DESSA
npz2...pump
Market Cap
$.
Change
.
24h Vol
$.
Holders
CORLA
C
bade
b
CORLA
0xba...7777
Market Cap
$.
Change
.
24h Vol
$.
Holders
.
Why Aren’t Different Stablecoins Equivalent Even Though They’re All Pegged to $1?

In the Web3 world, stablecoins are often treated as simple tools.

When you need to trade, you use them to exchange for tokens; when you need to hedge, you convert your assets into them; when you need to make cross-border transfers, they may also be your first choice.

But there’s an easily overlooked issue:

Price stability does not mean equal risk; being redeemable for $1 does not mean you can always exit smoothly at $1.

To understand the differences between stablecoins, first look at what they rely on to mai
What Is the Break-Even Win Rate? How High Must a Trading Strategy’s Win Rate Be to Cover Trading Costs?

In crypto trading, many people know their win rate but not how high it needs to be to actually make money. If winning trades earn little while losing trades lose a lot, you can still end up losing money even if you make the right call more often. The break-even win rate helps traders understand the minimum performance their strategy needs to achieve.

First, what is the break-even win rate?

The break-even win rate is the minimum win rate required for the long-term expected return to equal
post-image
#10月非农数据聚焦
The October US Nonfarm Payrolls Report is becoming one of the most closely watched economic events of the week. Investors, traders, economists, and financial institutions are preparing for fresh employment figures that could provide important clues about the strength of the American economy and the Federal Reserve's future monetary policy.

The US labor market has become an important source of uncertainty for financial markets. Although the economy continues to demonstrate resilience in several areas, hiring activity has shown signs of slowing. This makes the October employment repo
BTC-0.67%
  • 3
What permissions are you actually granting when you click “Approve”?

In the Web3 world, there is an action that seems very ordinary but can determine the risks facing your digital assets.

That is clicking “Confirm Approval” in your wallet.

Many users think that as long as they don’t actively transfer funds, they haven’t really handed over their assets.

But the reality is not that simple.

In many DeFi applications, you first need to authorize a smart contract to use a particular token before you can swap, stake, or perform other operations. This process is not necessarily dangerous in itse
post-image
What Is the Risk-Reward Ratio? Why Can a Trade Have Long-Term Value Even With a Low Win Rate, As Long As Risk Is Managed Properly?

In cryptocurrency trading, many people focus too much on win rate, believing they need to make frequent correct calls to make money. But what really affects long-term trading results is not just the win rate, but also the amount gained or lost on each trade. The risk-reward ratio is an important tool that helps traders assess whether a trade is worth taking.

First, what is the risk-reward ratio?

The risk-reward ratio generally compares a trade’s potential loss w
post-image
Bitcoin outlook: At this stage, we are bullish and looking for suitable opportunities to go long at lower levels. This pullback is more of a deep shakeout during the uptrend and has not directly damaged the broader bullish structure. After repeated tests of key support below, buying interest has continued to come in.

Although the short-term market may remain choppy, downside momentum is weakening, and conditions for a bullish counterattack are gradually maturing. A reminder to everyone: being bullish does not mean entering blindly. Entry levels are crucial. Chasing highs carries very high ris
post-image
BTC-0.65%
ETH-1.23%
SOL-0.74%
#USStocksFaceHistoricSelloff
Anatomy of a Volatility Spike: Analyzing the UVXY Breakout ‌
$UVXY ‌

Let’s break down the technical anatomy of this specific chart to understand how to read a parabolic breakout and manage the extreme risk associated with volatility instruments.

The Setup: A Tale of Two Halves

Looking at the chart, we see a textbook V-shaped recovery that has transitioned into a parabolic breakout.

1. The Capitulation Phase (Left Side)

From November 2nd through November 4th, UVXY experienced a severe downtrend. The price consolidated lower, eventually hitting a floor at the
UVXY+44.07%
  • 11
  • 2
#USTechSelloff 👀

Is artificial intelligence shifting from infrastructure to application?

Are the markets experiencing the growing pains of a transition from the infrastructure phase of the AI revolution to the application and profitability phase? The Nasdaq’s historic 5.52% single-day drop is not merely a panic sell-off; it also signals a rotation of capital away from the "chips and data centers" narrative toward software giants that generate actual revenue and profit. During this transitional period, defining a clear strategy ahead of critical macroeconomic data releases is more important
Gate_Square
🤖 AI Stocks Sell Off — Could AI Applications Lead the Next Rally?

AI chip, server, and data center stocks are under pressure as investors question massive AI spending and stretched valuations.

But the AI story is far from over.

The focus is shifting from AI infrastructure spending to real revenue and profits.

🔍 Google: AI Search & advertising revenue

☁️ Microsoft & Amazon: Cloud and AI monetization

🚀 Meta, Palantir & Oracle: Enterprise AI growth

If capital rotates from AI infrastructure to applications, which company could lead the rebound?

Share your stock picks, market outlook, or trading strategy on Gate Square with #USTechSelloff.

🎁 Gate's AI Applications Trading Event is live. Trade eligible AI and cloud stocks for chances to win rewards, including up to 1,888 USDT in Google stock trial funds.

👉 Event link: https://www.gate.com/campaigns/6916

repost-content-media
MU-17.23%
NVDA-9.33%
AMD-17.64%
SNDK-22.24%
NAS100+1.34%
  • 15
  • 1
🔹South Koreas KOSPI Plunges 8, Triggering a Trading Halt! Losses Narrow After Trading Resumes. Are
live-cover
LIVE1,995
Last night’s Nasdaq 100 was genuinely a little scary😥

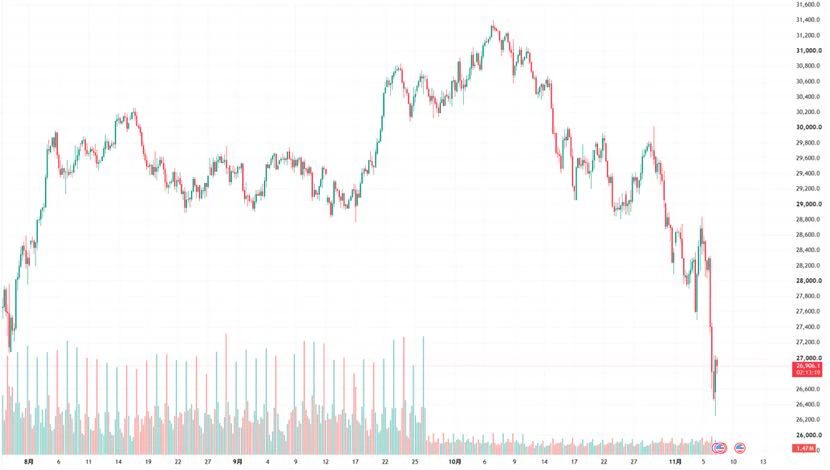
$QQQ It plunged 6.36% in a single day, closing near 26,630 and marking an exceptionally rare one-day drop not seen since 1992

What’s even more noteworthy is that the biggest losses came from the AI supply chain that had previously supported the US stock market’s rise. The Philadelphia Semiconductor Index even fell more than 12%

After the Democrats won the midterm elections, the market began to worry that data center construction would face more regulatory restrictions. Combined with ongoing questions about the returns on AI investments,
post-image
QQQ+0.01%
  • 7
  • 2
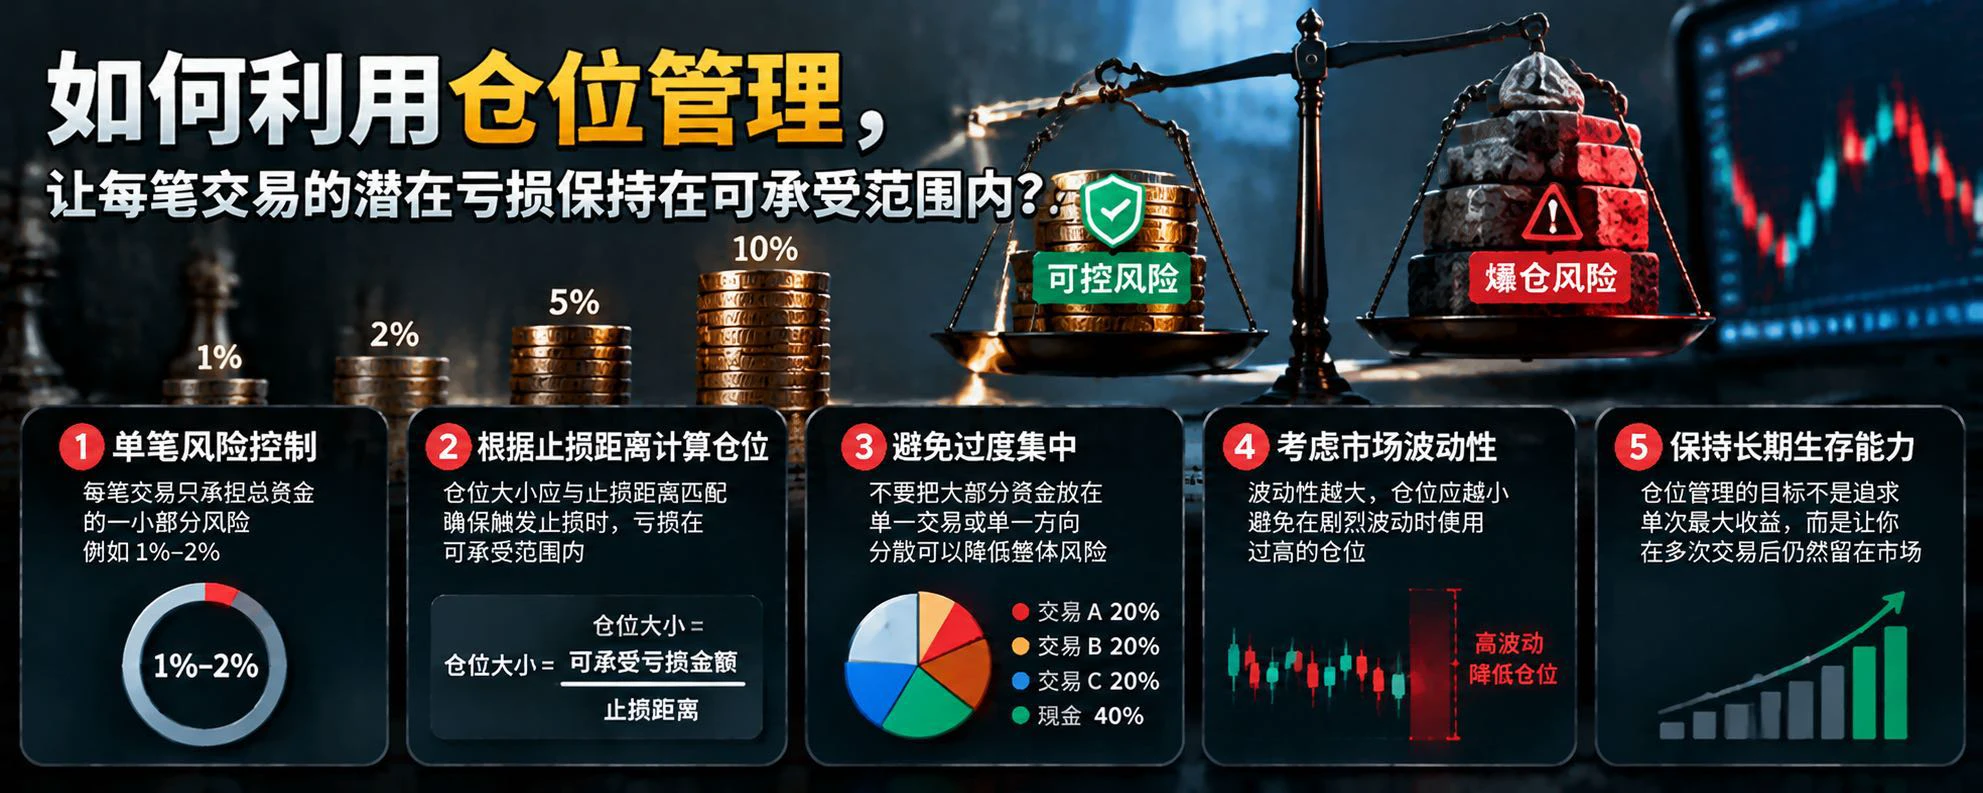
What is maximum drawdown? Why can a consistently profitable trading strategy still experience a series of losses that is difficult to withstand?

In cryptocurrency trading, some strategies may be profitable over the long term but experience substantial losses along the way. If traders do not assess in advance how far their account could fall, they may be forced to exit before the strategy recovers. Maximum drawdown is an important metric for measuring this risk.

First, what is maximum drawdown?

Maximum drawdown (MDD) is the largest percentage decline in an account’s net value from a previous
post-image
Major data release tonight at 21:30
The U.S. October nonfarm payrolls report will be released
Nonfarm payrolls are a key indicator of Fed rate-cut expectations, directly driving volatility in BTC and ETH
Data above expectations → strong employment, dampening rate-cut expectations and weighing on crypto
Data below expectations → weaker employment, boosting rate-cut expectations and benefiting the crypto market
Volatility will spike on nonfarm payrolls night. Manage risk and avoid taking oversized positions to gamble#Gate首创资金安全证明 $BTC ‌
post-image
BTC-0.67%
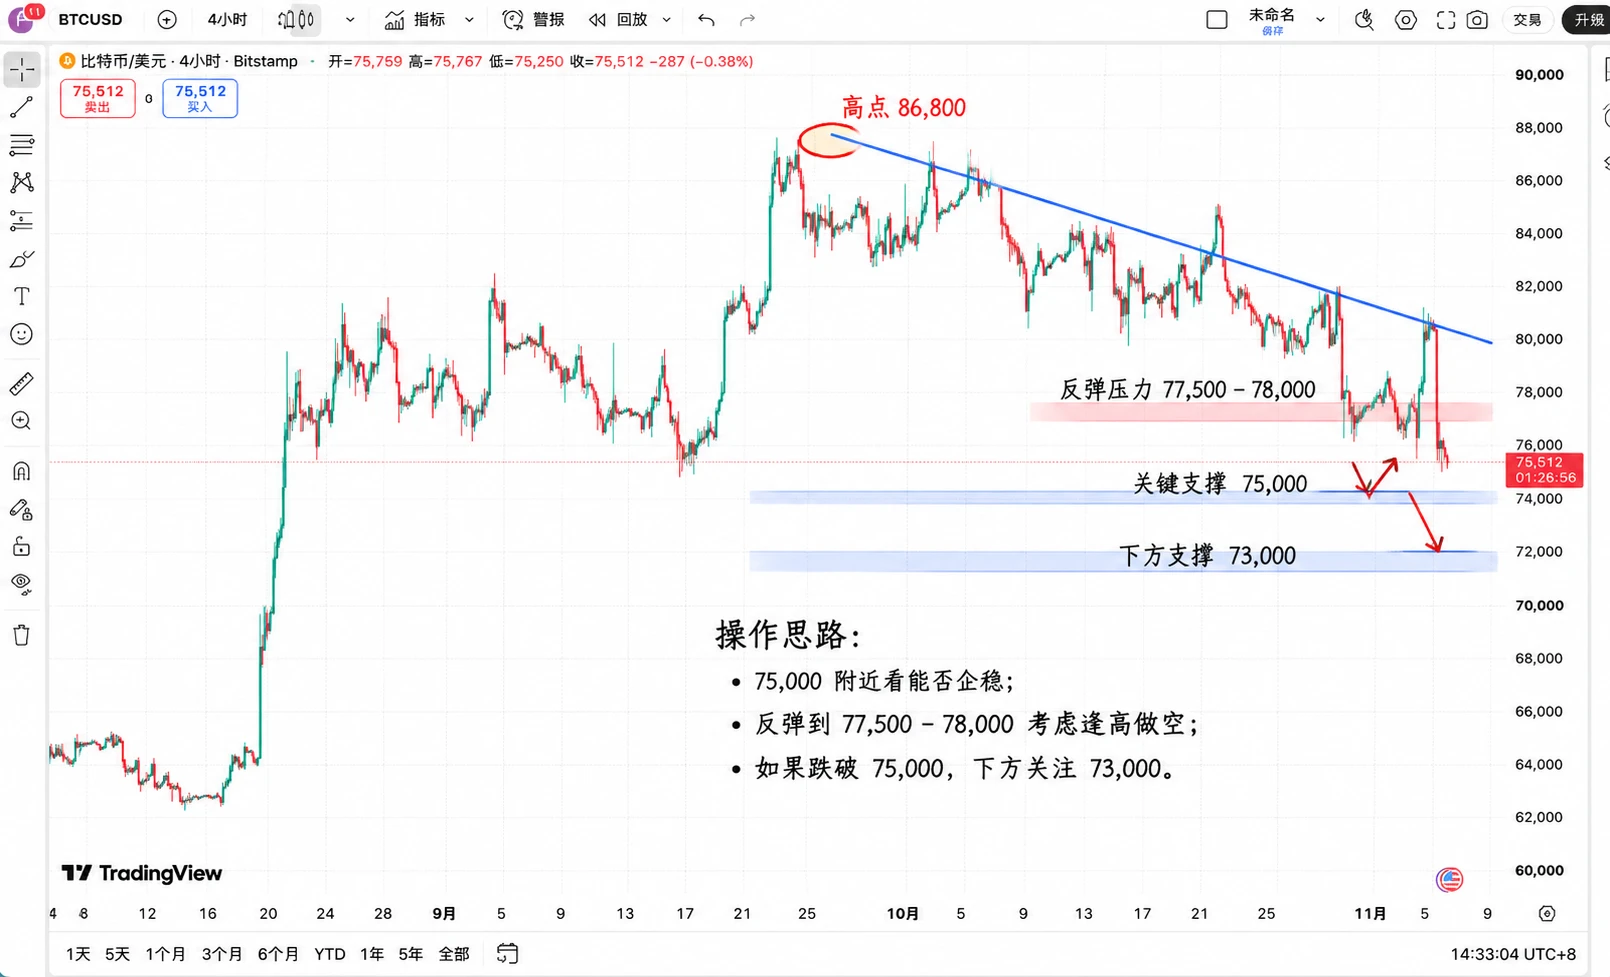
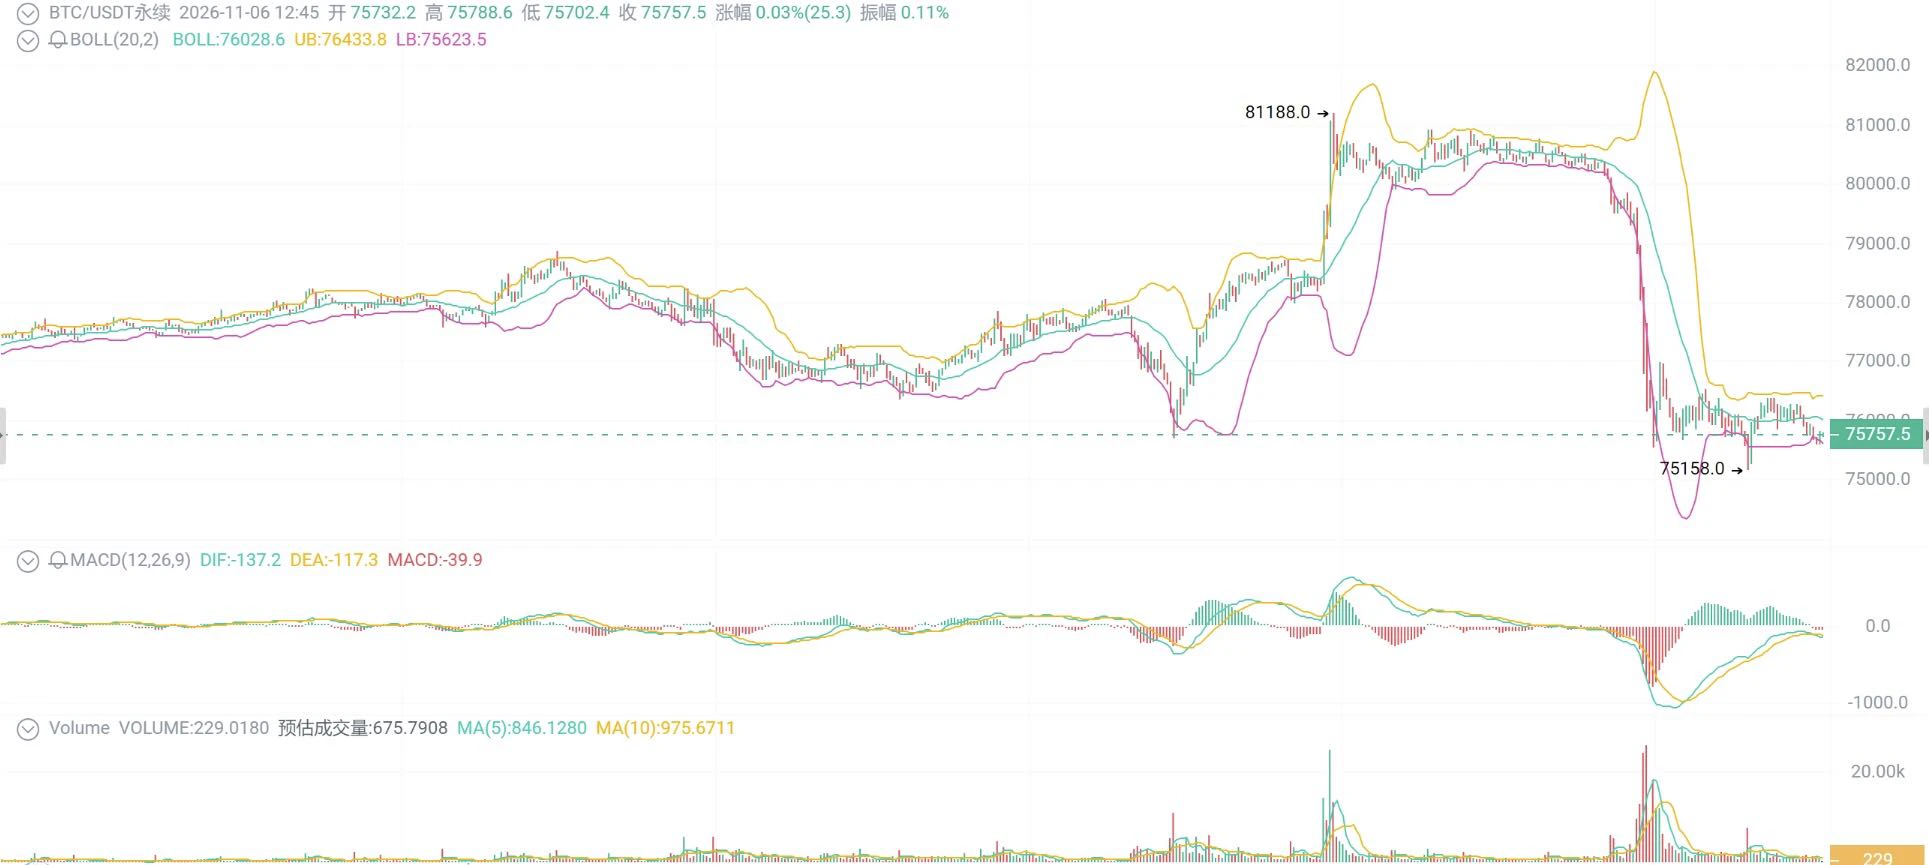
$BTC Yesterday it was still pushing toward $81k; today it got dumped straight back to $75k! Anyone who chased longs was probably blindsided by this move again.

On November 6, BTC fell to a low of $75,158, down more than 6% in 24 hours, with futures trading volume exceeding $21.3 billion.

Even more exciting, U.S. October nonfarm payrolls are due at 21:30 tonight, with the market expecting around 65k new jobs.

First, my take: the short-term outlook remains bearish, and there’s no need to rush into buying the dip.

This drop isn’t just about ugly price action. Four-hour futures open interest a
post-image
BTC-0.65%
🏆 Gate Social Year-End Community Gala | Annual Streamer & Creator Awards Now Open for Entries!

🎁 Top 20 rewards revealed for both Chinese-language categories!
🥇 TOP 1: DJI Osmo Pocket 4
🥈 TOP 2–3: AirPods Pro 3
🥉 TOP 4–6: Honor AI Projector
🎁 TOP 7–10: Anker 3-in-1 Power Bank
🏎️ TOP 11–20: LEGO Red Bull Racing Car
🌟 All TOP 20 winners receive an annual honor trophy + exclusive VIP5 badge!

🔥 Annual Streamer × Annual Creator: Compete for annual honors in two categories!
⏰ Entry deadline: November 10
🚀 Enter now and compete for a spot in the annual TOP 20!
👉 https://www.gate.com/zh/a
post-image
  • 19
  • 7
#每周来晒 #美股史诗级抛售 Deleveraging or the Start of a Deeper AI Correction? What Thursday's Tape Tells Us
Thursday's sell-off was the kind of session that makes investors ask whether the AI trade is breaking. The Nasdaq 100 fell about 6.4% and erased roughly $2.5 trillion in market value, its deepest one-day drop since "Liberation Day" in April 2025, according to Reuters. Chip stocks posted their second-biggest one-day fall on record. The question is whether this is a forced reset or the first leg of a longer unwind.

The numbers from the close

From the Gate feed's closing prints on 5 November: NVIDI
post-image
NAS100+1.34%
QQQ-6.34%
US500+0.39%
NVDA-9.33%
AMD-17.64%
  • 2
  • 1
Hey everyone, welcome to the livestream.

Today is day two of the 100U test. We’re not talking about trading with big money or making claims about guaranteed profits. We’re simply using 100U to live-test a short-term strategy on the 1-minute timeframe.

The position size is very small right now. This is purely to test the strategy’s logic and execution and see how it performs in the current market in terms of win rate, drawdown, and actual profit and loss.
post-image
🔹South Koreas KOSPI Plunges 8, Triggering a Trading Halt! Losses Narrow After Trading Resumes. Are
live-cover
LIVE1,762
📡 Real-time Signal Card · BTCSOS Capture
Source: Crypto Boss Target: $BTC Long entry: 83050 Target: 83450 / 83700 / 84150 Stop-loss: 82500
Speaking of which, earlier today (11-06), I had just copied the Boss's $BTC trade, and now here comes another 👀
As usual: I only relay and sync the trades; whether to follow and how large a position to take are up to you. The market can go crazy, but risk management can't go crazy with it. Shared as a personal record, not investment advice. #Nasdaq100 index falls 6%
BTC-0.67%
Load More

Join 40 M users in our growing community

⚡️ Join 40 M users in the crypto craze discussion

💬 Engage with your favorite top creators

👍 See what interests you

Trending Topics

USStocksFaceHistoricSelloff

2.23k Views3.59k Discussing

U.S. stocks suffered a sharp selloff on Thursday, with the Nasdaq closing down more than 5% and the Philadelphia Semiconductor Index falling over 12%. AI and chip stocks including $NVDA and $AMD were hit especially hard. Markets are reassessing AI valuations, data-center spending and future returns. Is this just short-term deleveraging, or the start of a deeper correction in the AI trade? Which sectors are you watching next?

GateLaunchesPoSECProofOfSecurity

13.06k Views579 Discussing

USNonfarmPayrolls

11.25k Views4.02k Discussing

View More