Share your thoughts
placeholder
Article
ADA just flashed a 4h short signal while everyone’s still buying the range top—are you on the wrong side?

$ADA /USDT - SHORT

Trade Plan:
Entry: 0.2182 – 0.2194
SL: 0.2246
TP1: 0.2145
TP2: 0.2116
TP3: 0.2073

Why this setup?
Why now?
- 15m RSI at 35.9 shows momentum already bleeding, not bouncing.
- 1D trend is *range*, not breakout—so 0.2188 is the ceiling, not the floor.
- ATR (1h) at 0.0024 means volatility is contracting—waiting to snap.
- Targets: TP1 0.2145, TP2 0.2116. Invalidation only below 0.2119 (that’s your escape hatch).

Debate:
If ADA slices through 0.2182, do you f
ADA+2.02%
Tong Ge’s 9.6 BTC strategy
Enter a short around $BTC 805-810, with a stop-loss at 815, first target 790, second target 785.
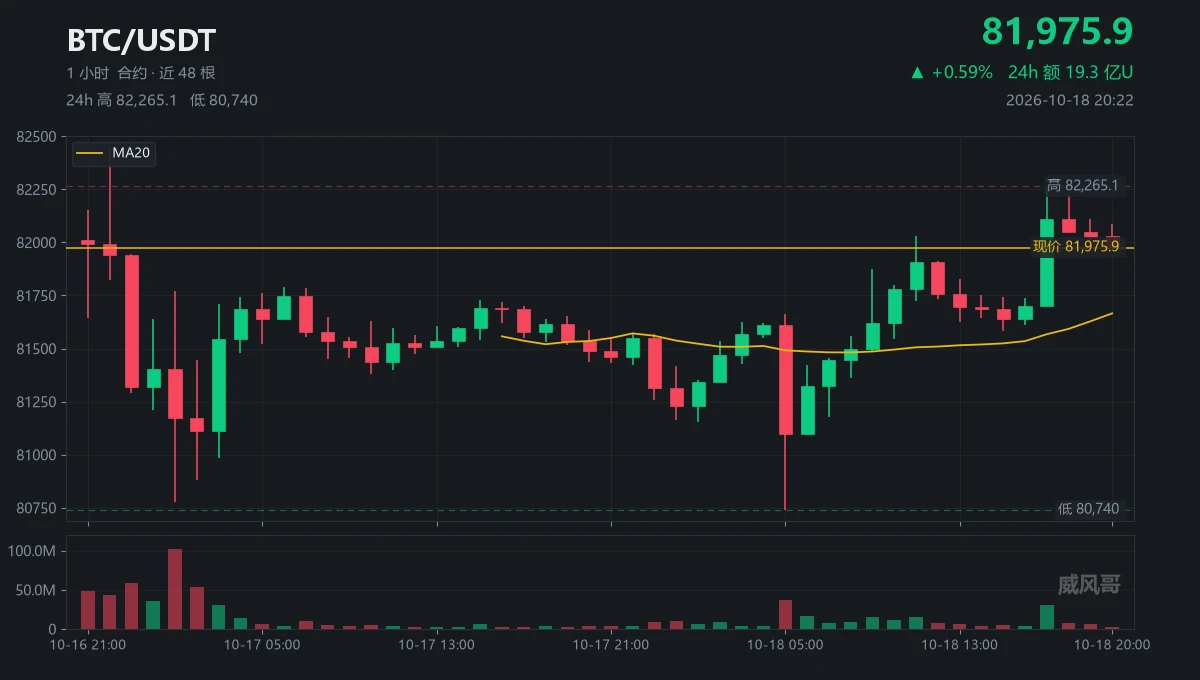
Current price: 79737. The market tentatively touched 80167 but failed to hold above it and quickly pulled back. There is selling pressure above 800, so this move cannot yet be considered a breakout.
Moreover, it is the weekend today, and liquidity is already thin, so even a slight price move can easily trigger back-and-forth wicks.
There is no need to force trades in this market. Short if it moves up to the entry level; do not chase if it moves down.
If 815 holds, withdra
post-image
BTC+0.25%
bitcoin:native
Taking a long scalp here,
Might be a bit early but imo we are going to push higher towards 82K soon
post-image
BTC+0.21%
Everyone’s watching Bitcoin—but DASH just flashed a sell signal most will ignore.

$DASH /USDT - SHORT

Trade Plan:
Entry: 69.3 – 70.9
SL: 78.1
TP1: 64.1
TP2: 60.1
TP3: 54.1

Why this setup?
Why now? 4h bias is SHORT at 55% confidence, while 1D stays rangebound—no trend rescue.
- Price sits at 70.1, right at the entry ref, with TP1 at 64.1 (−8.5%).
- RSI 15m at 46.46 shows no oversold bounce fuel—momentum is fading, not flipping.
- ATR 1h at 3.33 means volatility is alive; a break below 69.3 opens the slide fast.

Debate:
If DASH drops to 64.1, are you scaling out or adding to the sh
DASH+1.89%
Do not buy this phone!!!
post-image
$BTC Signal】Range tightening | Buying dominates the order book; buy-the-dip long
$BTC 1H RSI 49.92, 4H RSI 54.36, momentum neutral. Bid/Ask Ratio 2.87, with stronger bid-side depth, and the funding rate at 0.0020%. The 1H Bollinger Bands are 80065-79589, an ultra-narrow range, while the current price of 79800 sits just below EMA20_1H at 79810. The 4H MACD green bars are expanding, while the 4H EMA50 at 79039 is close to the stop-loss level of 79002.198 and can still provide support before a breakdown. OI is stable, with no extreme crowding. Above 80080, selling pressure is limited up to 80997
post-image
BTC+0.25%
crypto market
live-cover
LIVE1,017
Everyone’s watching Bitcoin—but DASH just flashed a 77% short signal nobody’s talking about.

$DASH /USDT - SHORT

Trade Plan:
Entry: 73.41 – 74.97
SL: 83.92
TP1: 66.89
TP2: 62.03
TP3: 54.73

Why this setup?
Why now? The 4h chart shows a textbook rejection zone:
- Price pinned at 74.19 with a hard ceiling at 74.97—that’s the line in the sand.
- RSI on the 15m is cooling at 59.74, losing upside momentum right as we tap resistance.
- ATR (1h) at 3.11 means volatility is ripe for a squeeze—but direction leans down.
- Target map: TP1 at 66.89 (-10%), TP2 at 62.03 (-16%). This isn’t a di
DASH+1.89%
#BTC
Look at this 5D Bitcoin chart.
In April 2017, BTC was around $ 1,000. By December 2017, it had reached nearly $ 20,000 — around a 20x move in just 8 months.
The interesting part is not just the price increase. It is what the mining industry looked like during that early phase. Mining infrastructure was much smaller, and the economics were very different compared with today.
This chart is a good reminder that Bitcoin has historically gone through explosive expansion phases after long periods of accumulation.
If BTC enters another major expansion cycle, the companies and infrastructure supp
post-image
BTC+0.25%
Could buying a fleet of these cabs and operating them be a profitable business model? All you’d need is a garage and some maintenance. Thoughts?
post-image
Everyone’s watching gold, but XAG/USDT just flashed a trap signal most retail will ignore.

XAG/USDT - SHORT

Trade Plan:
Entry: 66.23 – 66.27
SL: 66.46
TP1: 66.09
TP2: 65.98
TP3: 65.83

Why this setup?
- 4H bias is SHORT with 55.4% confidence, yet the 1D trend is *range*—not a breakout.
- Price is parked at 66.25, hugging the entry zone while RSI (15m: 42.3) lacks momentum to push lower fast.
- ATR (1H: 0.088) is thin—this isn’t a crash; it’s a slow bleed toward TP1 (66.09) and TP2 (65.98).
- Why now? The clock is ticking: if 66.46 (SL) breaks, the short thesis dies, but until then,
XAG+0.02%
Everyone’s still staring at 80K—but the real money is quietly shorting $BTC /USDT right now.

$BTC /USDT - SHORT

Trade Plan:
Entry: 79725 – 79839
SL: 80332
TP1: 79369
TP2: 79094
TP3: 78681

Why this setup?
Why now? The 1D trend is rangebound, yet the 4h momentum just flipped SHORT at 79,782. RSI on the 15m is already at 36.3—weak but not capitulated. ATR shows 229 points of 1h volatility, so the drop to TP1 (79,369) is only ~0.5% away. This isn't a breakout; it’s a grind down. The "Armed" status means the trap is set—if we lose 79,136 (invalid), the thesis dies, but until then, gravity win
BTC+0.25%
#OpenSky百日筑基 Day 69】⚡️
The opportunities that truly deliver results are often counterintuitive.
The only ecosystem in the world that “begs you to dump” — OpenSky.📉➡️📈
Sell orders flow back into the pool ➡️ triggering new output ➡️ 50% of the output is burned immediately ➡️ 10% is locked for an extremely long period ➡️ repeating in a cycle.
It does not rely on the project team’s empty talk to buy the dump; it runs entirely on mathematical mechanisms.
The more you dump, the more gets burned; the more you sell, the healthier the ecosystem becomes.
Dumping is no longer panic—it powers deflation
This is going to be the $ZIVIDEND chart in just a day or two
Screenshot this post
btw, Someone literally earned $5 zcash:native from a $100 position at 5k$ market cap
Imagine the smell at 1m$ mc and then 10m$!
post-image
ZEC+16.74%
Most traders are watching XLM upside while the 4h chart quietly whispers otherwise.

XLM/USDT - SHORT

Trade Plan:
Entry: 0.18518 – 0.18592
SL: 0.18914
TP1: 0.18286
TP2: 0.18107
TP3: 0.17838

Why this setup?
Why now? The 1D trend is range, not breakout—so the 55% SHORT bias isn't fighting momentum, it's fading it.
• RSI 15m at 48.9 = zero bullish fuel left for a push above 0.18592.
• ATR 1h (0.0015) shows volatility is tight—perfect for a grind to TP1 (0.18286) before the trap zone at 0.18266.
• Entry sits mid-range at 0.18555, but the alt (long) setup is invalid below 0.18196—meaning
XLM+1.42%
Btc back.?
live-cover
LIVE845
why do most RH meme charts look like this
almost every coin’s top traders show zero buys, but they have an infinite bag to dump into every pump
no wonder pons has never had a $20M runner
post-image
MEME-1.04%
PONS+11.19%
$PONS After all this time, Pons is still holding strong. The spot holdings haven’t been sold—hold on tight. All other coins are scams.
post-image
PONS+11.19%
$DASH A considerable number of long positions were liquidated over the past two hours.
post-image
DASH+1.98%
Everyone’s staring at XRP’s range—but the 4h chart is silently building a trapdoor.

$XRP /USDT - SHORT

Trade Plan:
Entry: 1.4152 – 1.4198
SL: 1.4400
TP1: 1.4006
TP2: 1.3894
TP3: 1.3726

Why this setup?
Why now? The 1D trend is *range*, not uptrend—so longs are renting, not owning.
- RSI 15m at 46.53: no oversold bounce fuel left.
- ATR 1h is thin (0.0093): a weak push to 1.4175 entry = low-risk short.
- Invalidation at 1.4078 is close—meaning the downside from 1.4175 to TP1 (1.4006) is a clean 1.2% slide, no drama.
- If 1.4152 breaks, TP2 at 1.3894 is the magnet. This isn’t a gamb
XRP+0.75%
Load More

Join 40 M users in our growing community

⚡️ Join 40 M users in the crypto craze discussion

💬 Engage with your favorite top creators

👍 See what interests you

View More