Share your thoughts
placeholder
Article
#Gate60MillionUsers
Gate 60 Million Users: My Crypto Journey with Gate.io
When I first entered the crypto world, everything felt like a maze. The jargon, the charts, the endless discussions about bull runs and bear markets — it was overwhelming. But somewhere along the way, I found a platform that didn't just let me trade; it helped me understand. That platform is Gate.io.
Today, as Gate celebrates 60 million users worldwide, I want to share my personal story and explain why Gate has become my go-to exchange.
The Beginning of My Crypto Story
I remember the day I created my Gate account. I had
BTC+0.42%
ETH+1.97%
I just casually hit refresh, and it went up on its own, leaving me in a pretty passive position.
While it was grinding along the bottom intraday, my position was still showing an unrealized loss, and I didn't do much. Then $MU suddenly shot up in a bullish candle, and my account went straight from bright green to bright red. Who could handle an experience like that?
My brain hadn't caught up, but I had held the position all the way up from 934.48, and now it's at 1030.57. I did the math, and the return is +662.26%. It's okay if you don't understand the market—what matters is knowing how to hol
post-image
MU+1.75%
ADA+3.75%
SOL+4.10%
🔹 Bonk Guys PONS position achieves over 150x returns, with his portfolio breaking through $27 milli
live-cover
LIVE1,384
Name one stock that will 100% do this.
post-image
this is a mid to long term bot for patient traders.
#btc #eth #gate #nvidia
BTC+0.42%
ETH+1.97%
NVDA+0.87%
  • 1
$XMR Signal】Go long + snipe with buying support
$XMR The order book's buy-side depth is 2.25 times the sell-side pressure, with the price at 539.32 approaching the 1H Bollinger lower band at 535.85. The 1H MACD histogram at -2.60 continues to weaken, while the 4H MACD histogram at +0.46 shows shrinking bullish momentum. The funding rate is relatively high at 0.0876%, OI is stable, and leveraged longs face interest payment pressure. 1H momentum is bearish, while 4H momentum is bullish. The price is below the 1H EMA20 at 546.49 and above the 4H EMA20 at 534.47, with the range narrowing.
🎯Direc
post-image
XMR-0.21%
BTC+0.42%
ETH+1.97%
SOL+4.12%
This COTI surge has completely caught me off guard—up 25% in 24 hours, ripping from 0.0147 to 0.0190, with $45 million in trading volume. That’s not volume retail traders can generate.
Here’s a reference for bottom-fishing: the Fear and Greed Index is currently at 67, leaning greedy but not yet extreme. Funding rates flipped positive from -0.03% last night to +0.01%, and shorts are being liquidated. The last time COTI saw this kind of simultaneous rise in price and volume was in November last year. Back then, after funding rates turned positive, the price went on to gain another 35% through mo
COTI+19.14%
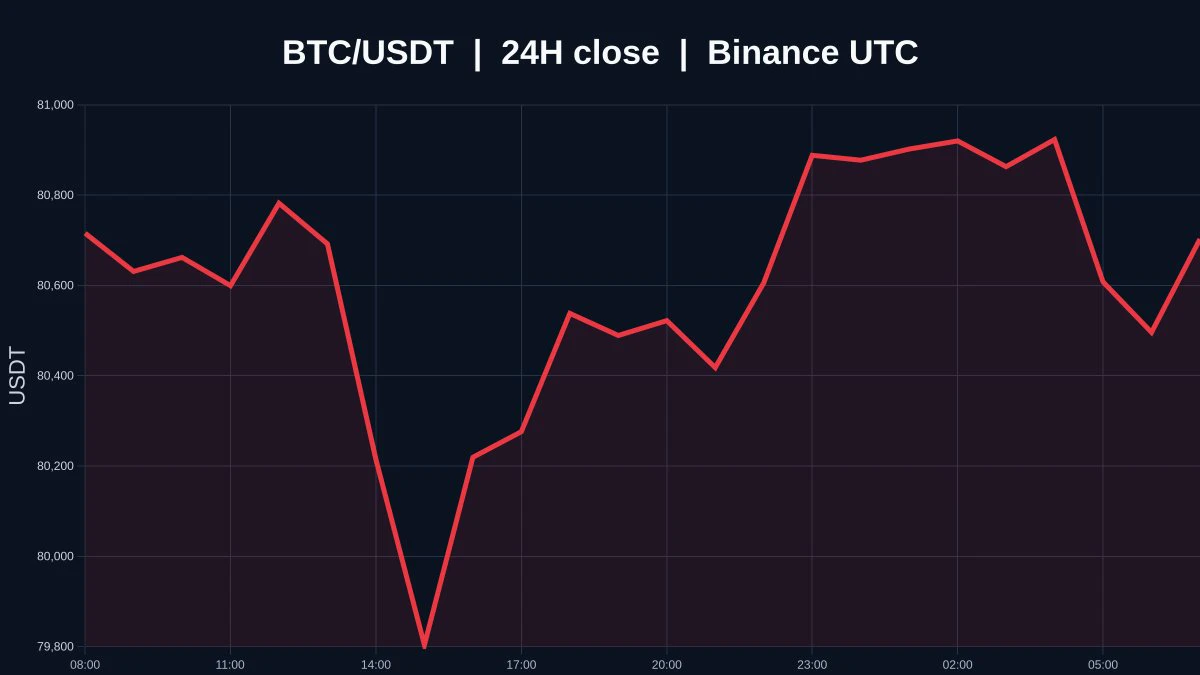
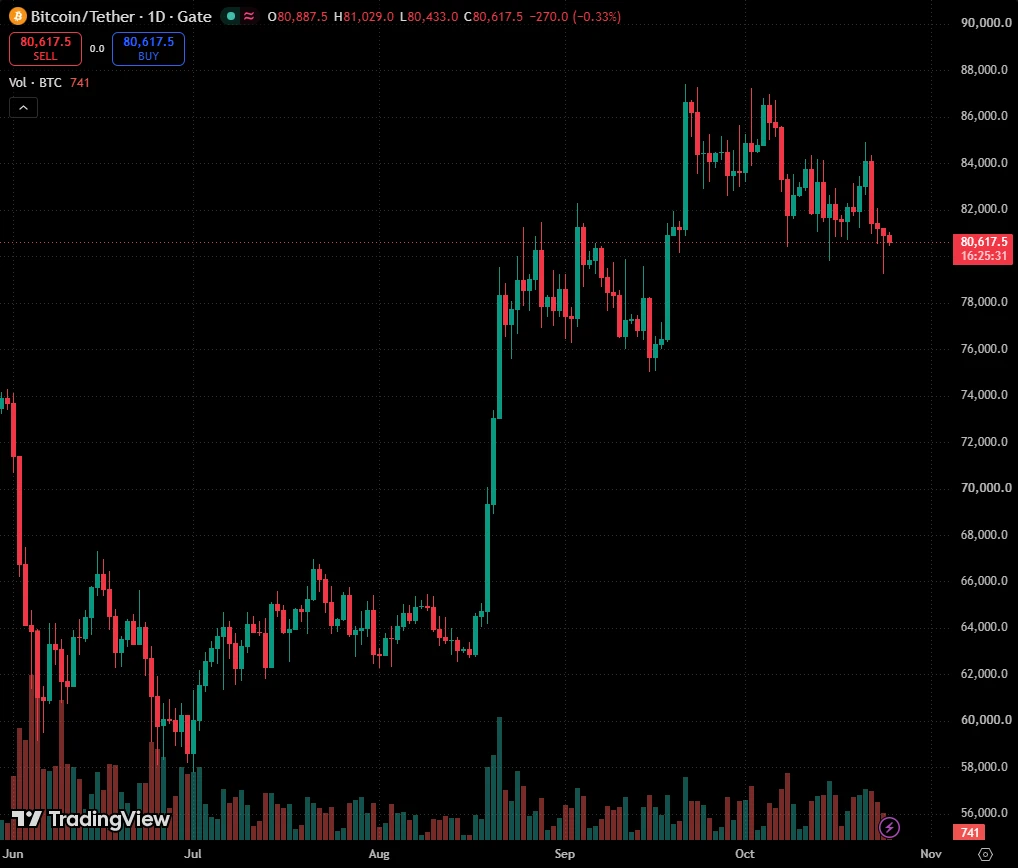
Would you chase BTC at $80,000?
Look at the surface first: the rebound has reached its target, but the direction remains undecided.
BTC rose 25% from 63,000 to 80,000 in August. After surging to 82,280 on September 3, it pulled back and has traded in a narrow range of 79,400-80,200 for several consecutive days. September has historically averaged a 2.9% decline, while the probability of an FOMC rate hike has surged to 58%, making bulls nervous.
The price is 15% above the 50-day and 200-day moving averages, keeping the medium-term outlook bullish, but short-term momentum is fading and MACD has
post-image
BTC+0.42%
ETH+1.97%
SOL+4.12%
#Gate60MillionUsers
NVDA vs TSLA: Same tech universe, completely different momentum.
The latest session showed a clear split: NVIDIA held firm while Tesla suffered a heavy rejection.
Market Snapshot
$NVDA : $230.36 | +0.84%
• Volume: 135.35M shares
• Day range: $229.63–$234.76
• 52W high: $236.54
$TSLA : $354.08 | -5.92%
• Volume: ~65.0M shares
• Day range: $351.32–$364.69
• 52W range: $297.38–$498.83
Why It Matters
NVIDIA is still being supported by the AI infrastructure narrative. Its latest earnings showed $96B quarterly revenue, up 106% YoY, while guidance pointed to roughly $108B next
TSLA+0.24%
NVDA+0.37%
#‌$NVDA NVDA AT $231: NVIDIA REMAINS ONE OF THE STRONGEST AI STOCKS — FULL MARKET ANALYSIS, NFP IMPACT & TRADING PLAN
NVIDIA remains one of the most powerful names in the global technology market, and in my view NVDA continues to deserve serious attention because the AI infrastructure story is far from finished. With NVDA around the $231 area, the stock is sitting in an important decision zone where momentum, fundamentals, AI demand, macroeconomic pressure and valuation are all coming together. The latest verified Friday close was approximately $230.36, after NVDA traded as high as $234.76 and
A few days ago, the hand that set the stop-loss trembled slightly; this morning, I realized that was unnecessary overprotectiveness. Before bed, I set up $TAC 's short order, and by the time I woke up, the candlestick chart had already completed most of the move for me 😏

Watching the market at the time, the rebound had no volume, and every upward push felt weak. The selling pressure above was obvious; people rushed to exit every time the price tested a high. This structure was not a breakout but a bull trap. I placed my entry at 0.002477 in advance—when it was time to short, I shorted witho
post-image
TAC-4.00%
ETH+1.97%
ZEC+16.28%
Everyone’s waiting for SUI to break out—but the 4H chart is quietly setting a trap for late longs.

$SUI /USDT - SHORT

Trade Plan:
Entry: 0.7973 – 0.8021
SL: 0.8224
TP1: 0.7826
TP2: 0.7713
TP3: 0.7542

Why this setup?
Why now?
- 1D trend is *range*—no momentum to push higher.
- RSI on 15m is cooling at 55, losing upside steam.
- ATR (0.0095) shows tight, indecisive candles—breakouts are failing.
- Entry zone 0.797–0.802 is exactly where sellers stepped in last cycle.
- SHORT bias (55% conf) targets TP1 at 0.7826, then TP2 at 0.7713—a clean 3.5% drop from here.

Debate:
Is SUI fa
SUI+2.29%
btc , eths and zec coin updates
live-cover
LIVE1,660
Everyone’s watching $BTC /USDT pump—but the 4h tape just whispered a secret that most retail will ignore.

$BTC /USDT - SHORT

Trade Plan:
Entry: 79886.1 – 79995.7
SL: 80467.4
TP1: 79546.0
TP2: 79282.8
TP3: 78888.0

Why this setup?
- Price is stuck at **79,940** with a hard ceiling overhead.
- 1D is *range*, not breakout—so this isn’t momentum; it’s a trap zone.
- RSI (15m) at 57 shows weak bounce fuel, while ATR (1h) = 219 means volatility is compressing before a snap.
- Short setup targets **79,546 → 79,282** before the real air pocket at **78,888**.
- Why now? The clock is tickin
BTC+0.42%
$MU
Is it still the weekend today?
How come Micron is still secretly pumping?
Does the market maker know something?
post-image
MU+5.89%
Why is everyone still long on $LAB /USDT when the 4h chart is screaming reversal?

$LAB /USDT - SHORT

Trade Plan:
Entry: 0.07264 – 0.07304
SL: 0.07481
TP1: 0.07137
TP2: 0.07038
TP3: 0.06891

Why this setup?
- 95% confidence on SHORT, not a guess—the algo is armed.
- Daily trend is bearish; the 1h ref at 0.07284 is sitting right under a key breakdown zone.
- RSI 15m at 41.53 shows weak bounce attempts, but ATR 1h (0.000819) hints at a violent move down.
- TP1 (0.07137) is 2% away—easy pickings if sellers step in.
- Why now? The clock is ticking: momentum is fading, and the next push
LAB-1.79%
This profit is making me feel terrified, worried that the market will come to its senses tomorrow and blacklist me.

While everyone else was running, $TRUMP bounced back to the upper boundary at 2.481, but failed to break through after grinding along it for two K-lines, with clear resistance above. I’d be letting the chart down if I didn’t short at a level like this. After opening the short, it even gave plenty of room to breathe. Unfortunately, it was too lazy to even stage a bull trap, drifting down all the way to 2.345 and delivering a direct return of +411.51%.

I took 80% off the table
post-image
TRUMP-0.38%
BNB+0.38%
LAB-1.79%
$ETH Ecosystem with L2s and DeFi leading the charge the past week.
Outperforming everything from the major sectors.
Besides obviously the smaller memes that have been popping off. But those are not included in this chart.
post-image
ETH+1.97%
💸 The good times continue, and every rise is real profit 💸
Anyone who judges the market based on buying at the top and says the market has turned against him is suffering from a major psychological crisis; he has started seeing the crypto market as if it were his alone, as if there were no traders other than him, even though people trade billions of dollars every day..
You entered the market years ago, but every day new traders enter with cash and buy cryptocurrencies at steep discounts..
That is why you should not judge the market based on your portfolio or your exit
For you, a 100% rise me
post-image
Load More

Join 40 M users in our growing community

⚡️ Join 40 M users in the crypto craze discussion

💬 Engage with your favorite top creators

👍 See what interests you

View More