

Square
Following
Hot
News
Profile
Share your thoughts
placeholder
Article
Someone opened a short position worth $45,200,000 using 20x leverage$ETH . Liquidation price: $3,188
post-image
ETH-1.23%
#晒出我的合约收益 This coin is cursed. I bet if anyone buys in, the market maker will dump it without even pretending otherwise. Be careful if you’re going to play #meme
post-image
MEME-1.03%
Trenches
ZIG
Z
bade
b
ZIG
0x8c...1145
Market Cap
$.
Change
.
24h Vol
$.
Holders
.
KIM
K
bade
b
KIM
8pjf...pump
Market Cap
$.
Change
.
24h Vol
$.
Holders
.
Anakin
A
bade
b
Anakin
Exxz...pump
Market Cap
$.
Change
.
24h Vol
$.
Holders
.
IDOL
I
bade
b
IDOL
0x3b...ab07
Market Cap
$.
Change
.
24h Vol
$.
Holders
.
BTC
B
bade
b
BTC
C5xp...pump
Market Cap
$.
Change
.
24h Vol
$.
Holders
.
$UAI $UAI dropped exactly two targets—our bearish analysis
post-image
UAI-7.58%
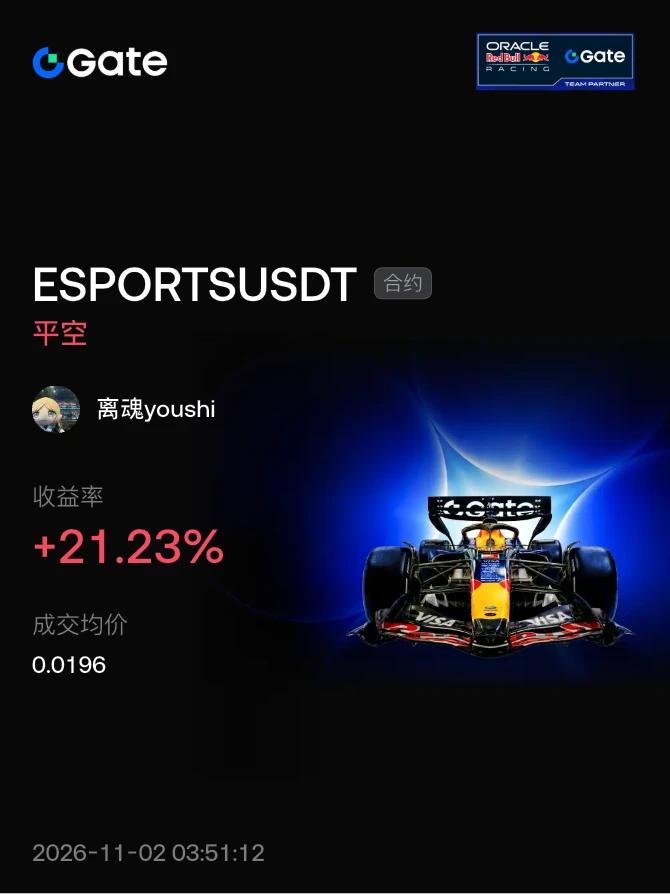
$ESPORTS I'm getting absolutely wrecked by losses
post-image
ESPORTS-5.30%
$AIN $AIN can enter a short trade! 📉🔥A small-pin candle appeared in the past 15 minutes, and this time the pullback is expected to be larger than before.🎯 Target: 0.20🈳 Hurry and open short positions! 📉
post-image
AIN+3.85%
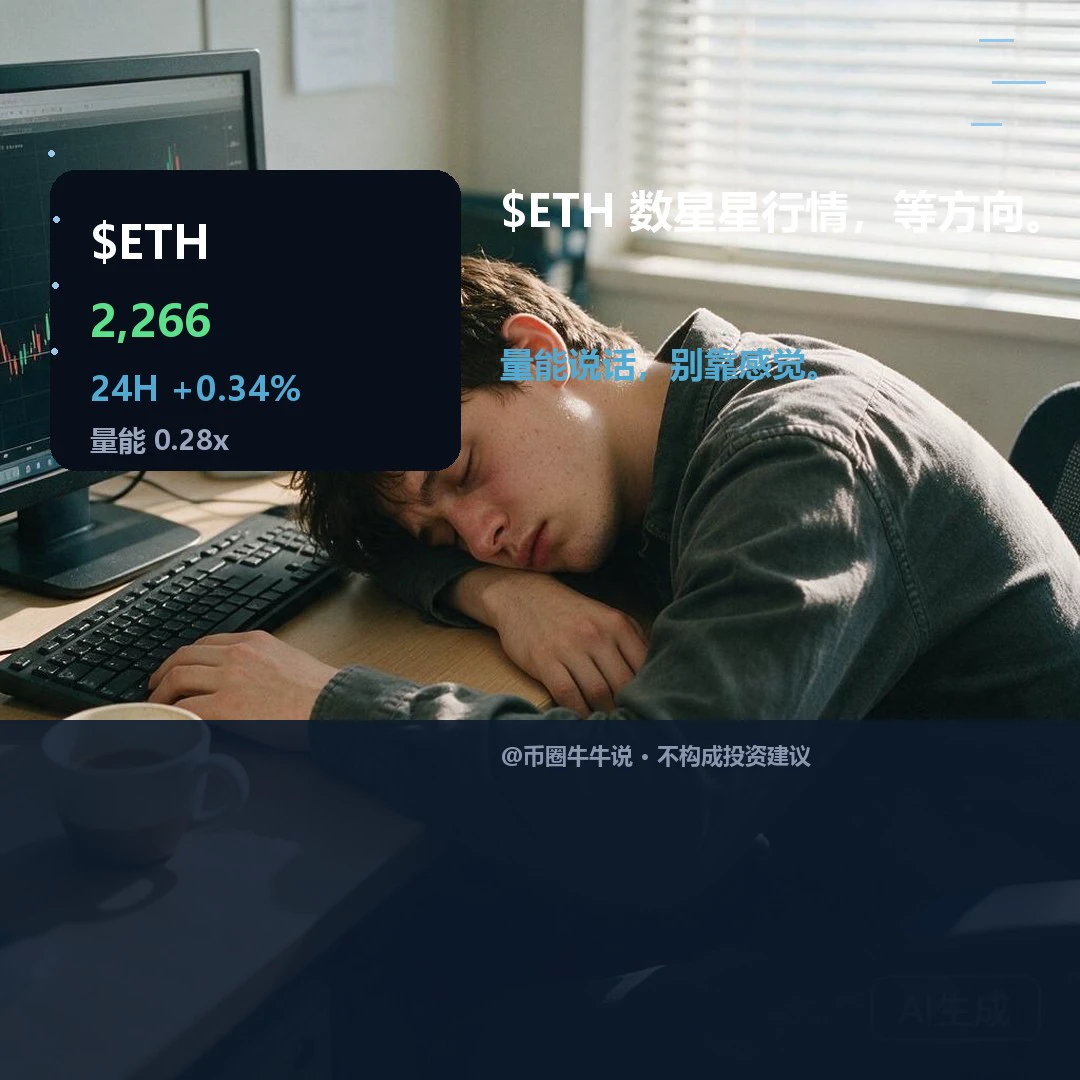
Divergence: $ETH is currently at 2,265.59, with the one-hour outlook leaning bullish and the four-hour outlook bearish. The two timeframes have yet to align. The one-hour RSI is near neutral, while the four-hour RSI is above 70. This kind of conflict suggests the direction is unconfirmed, not a trend reversal. Trading volume is less than 30% of the average, indicating insufficient participation and that neither side has the strength to change the situation. If the one-hour strength cannot even reach the intraday high, how can the four-hour weakness be overturned? Only a move above and hold abo
post-image
ETH-1.26%
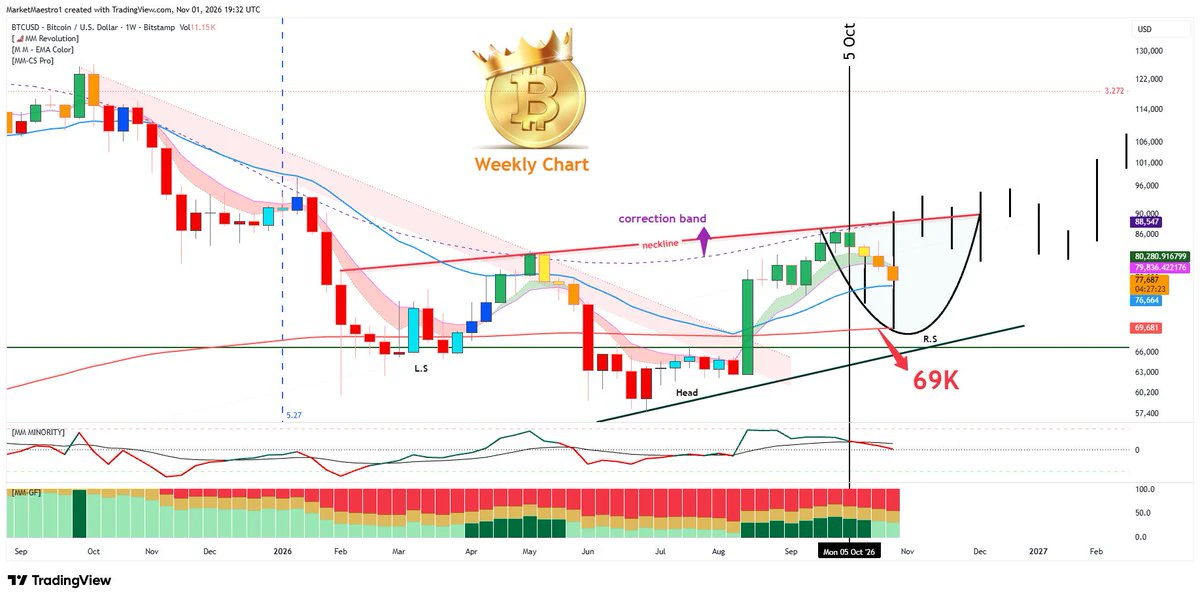
bitcoin:native will make a decision very soon. Let's say $78,385 on the upside and $76,600 on the downside. It will break in one direction. Minority had already signaled this back on October 5. $69K would not invalidate the pattern. Let's see
post-image
BTC-0.67%
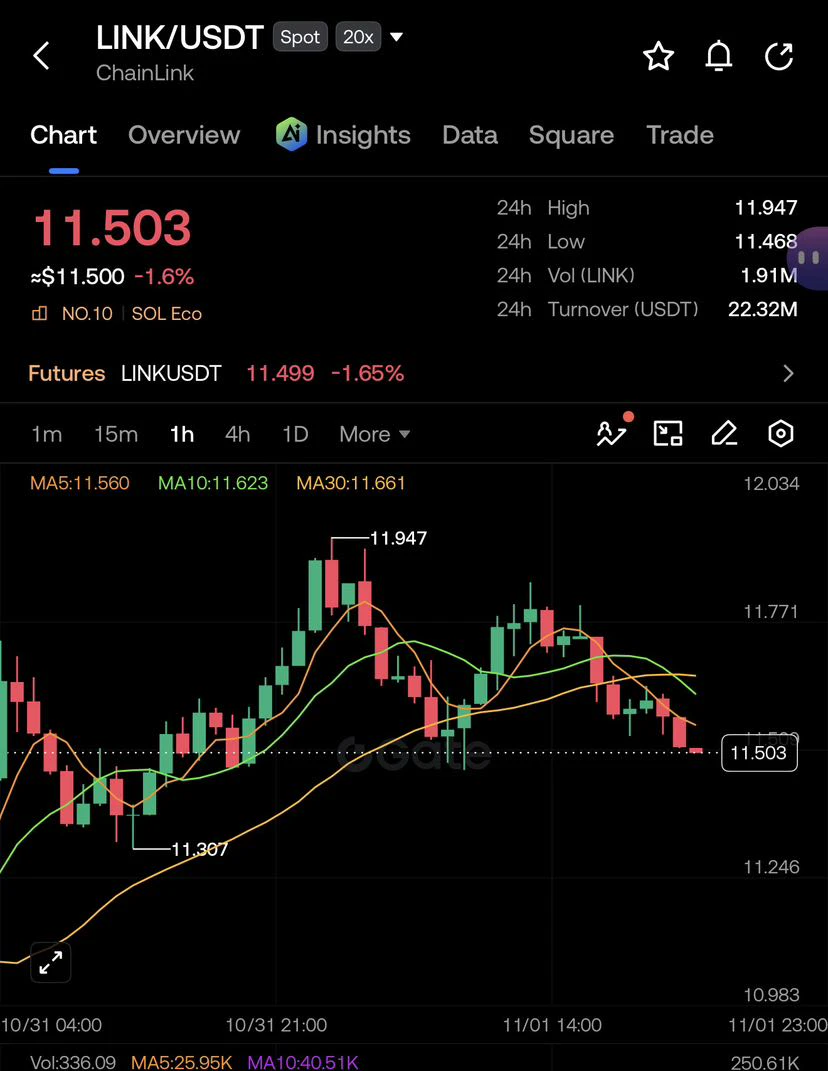
$LINK is currently trading at $11.503.
Chainlink is showing renewed market activity as traders monitor its next move. Can LINK maintain its momentum and push toward higher levels? Keep watching!
post-image
LINK-0.18%
  • 8
  • 2
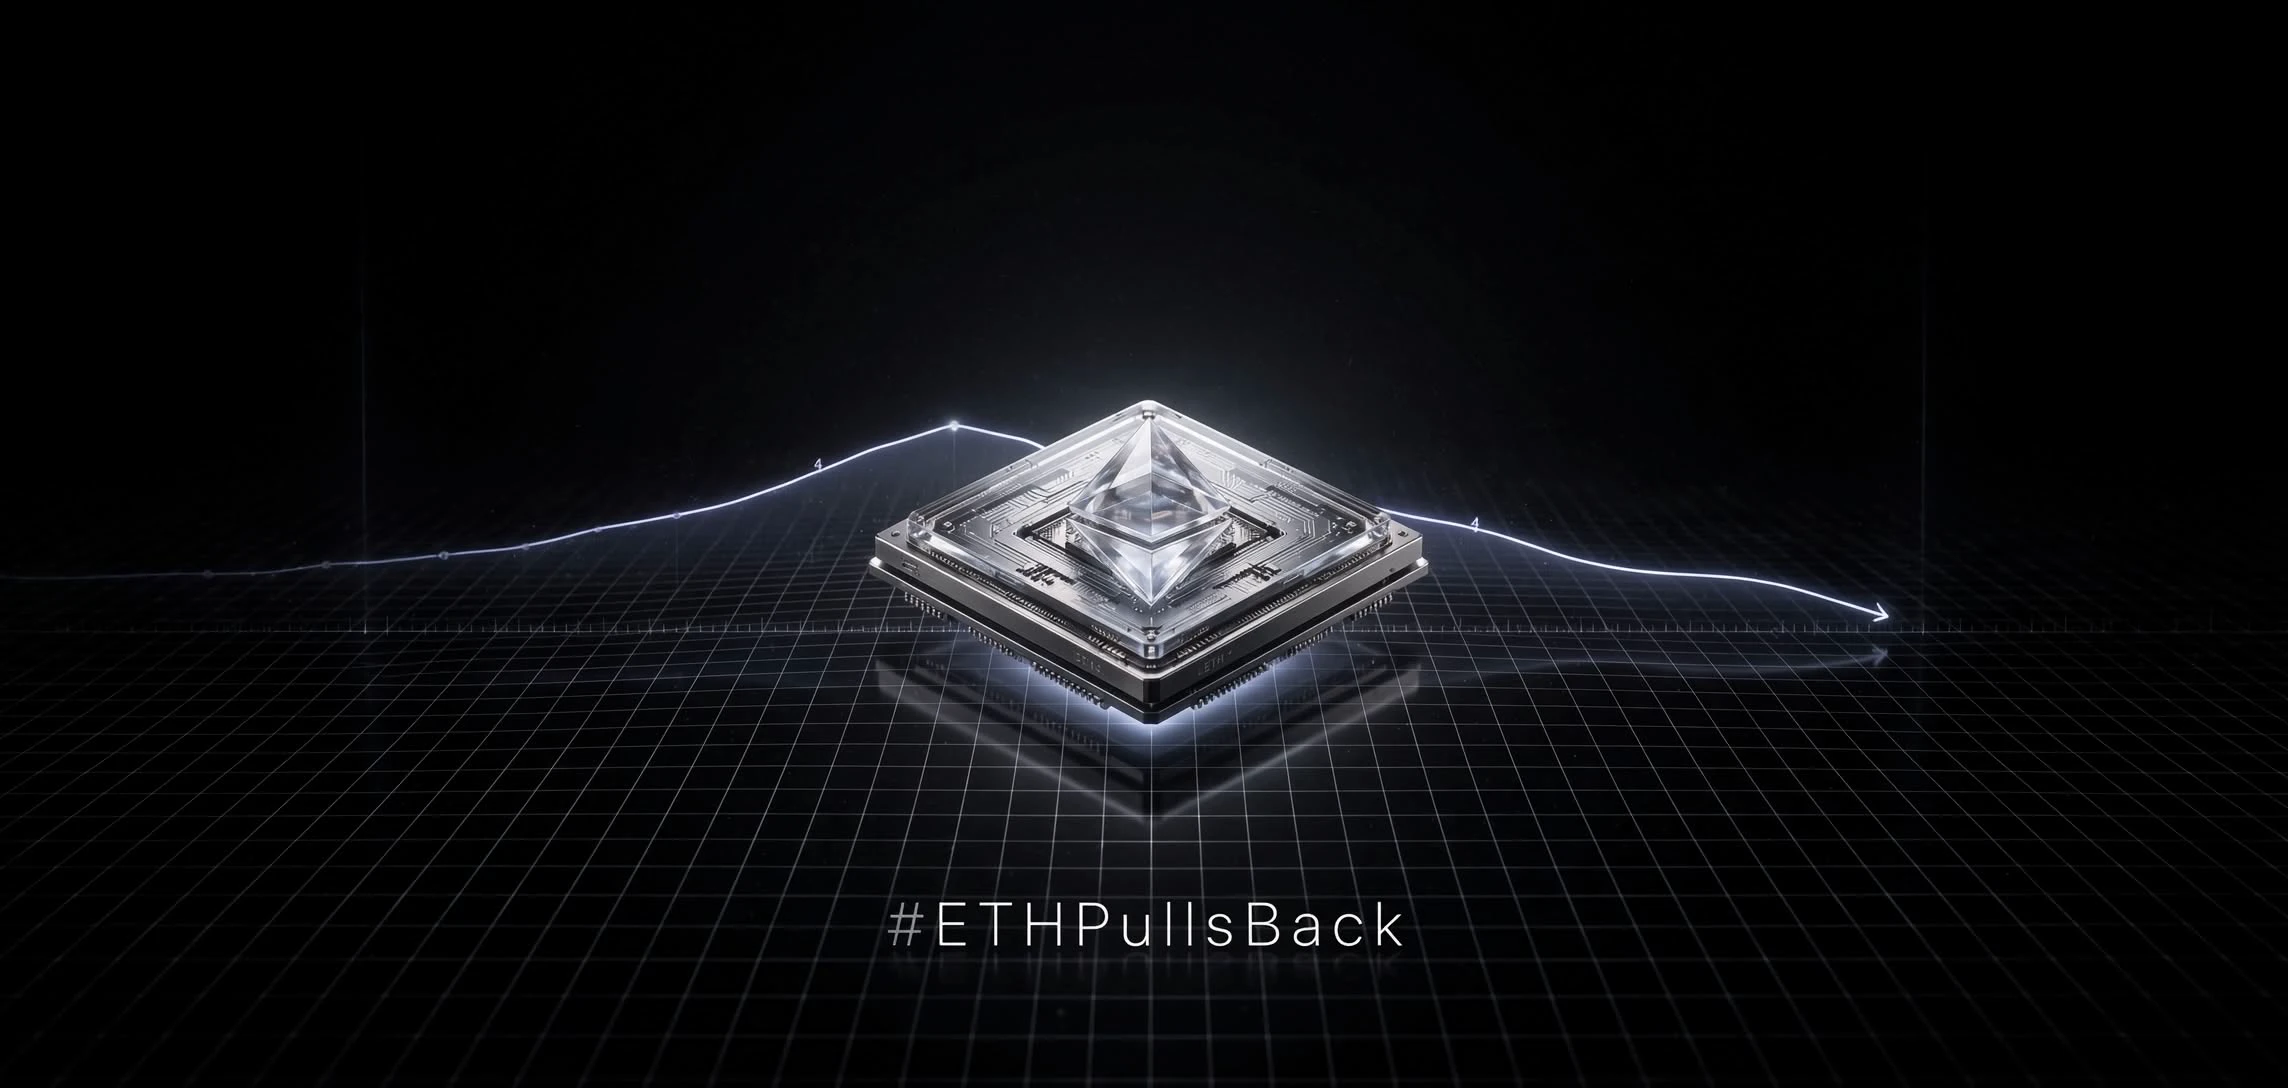
#ETHPullsBack
ETH shows a broad pull back that spans intraday and weekly charts, with each bounce capped by prior volume clusters.
Current Verified Board
Base you gave aligns with live feed: current price 2,263.72 USD, open 2,255.75, high 2,278, low 2,251.36, prior close 2,255.75, change +7.97, +0.35%. This is low range for year after heavy drop.
Recent prints in same feed show how pull back evolved:
• 3,730 USD early Nov, already under 4,000 and down 4% on day, 14% on month. • 3,310 USD consolidation on Nov 7, with upside capped by short moving averages. • 3,122.32 USD on Nov 17, RSI 34.1 ov
post-image
ETH-1.26%
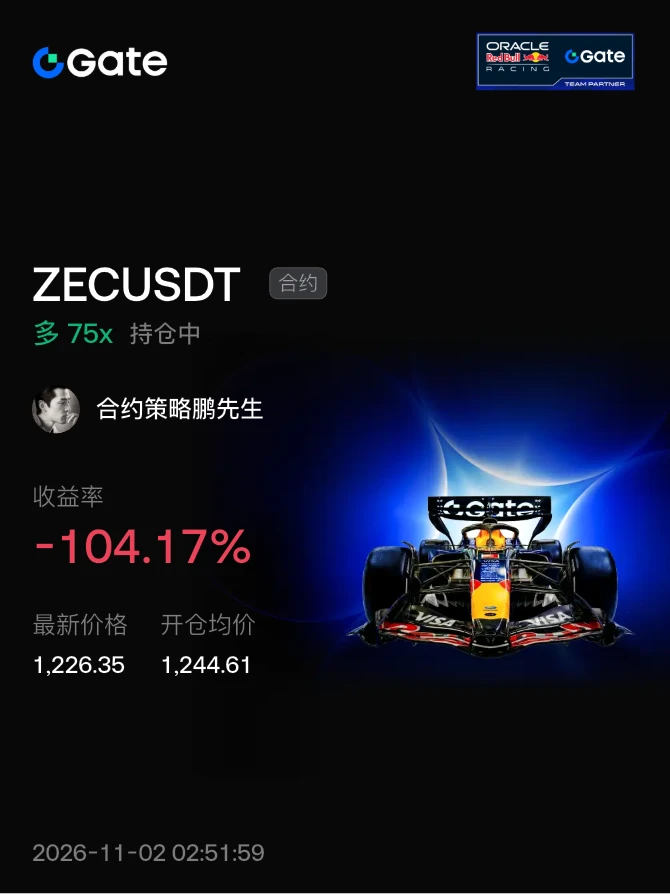
Good news: Ethereum shorts have cleared out
Bad news: ZEC longs got stopped out again 😭😭😭
​#晒出我的持仓收益
post-image
ETH-1.23%
ZEC+1.29%
I cried last night when I realized that 25 Ghana cedis is ₦3,000. I mean, 25 Ghana cedis is ₦3,000!
How did Nigeria become this bad? How did the Giant of Africa fall so drastically?
If we allow APC and Tinubu to continue ruling this country, very soon, one Ghana cedi could be worth ₦1,000.
Anyway, happy new month, guys! May this new month bring blessings to those who deserve them.
Bitcoin could move either way this week, but the overall trend is bearish. Around 83,500 is the best level to short.
post-image
BTC-0.65%
  • 1
Target profit this month: 100,000 #10u战神 Copy trading is now open; feel free to follow if you're interested
post-image
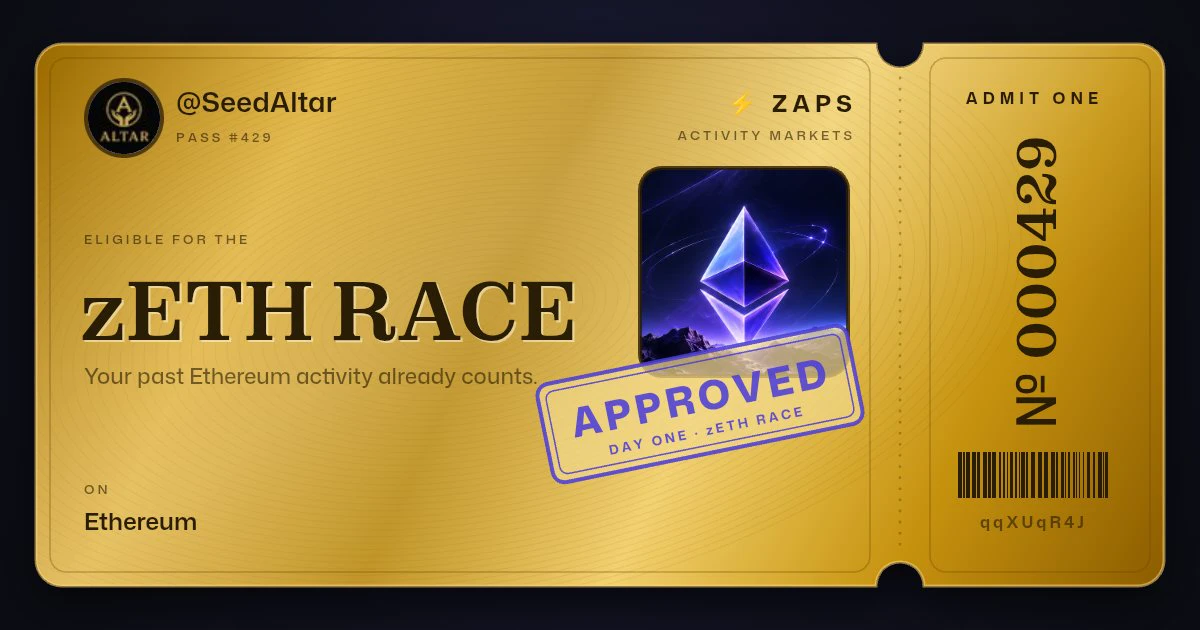
I'm in the zETH race. Pass #429. A new meme coin with no dev bag.
post-image
MEME-0.94%
#BTC大跌 #ShareWeekly #WCTC9
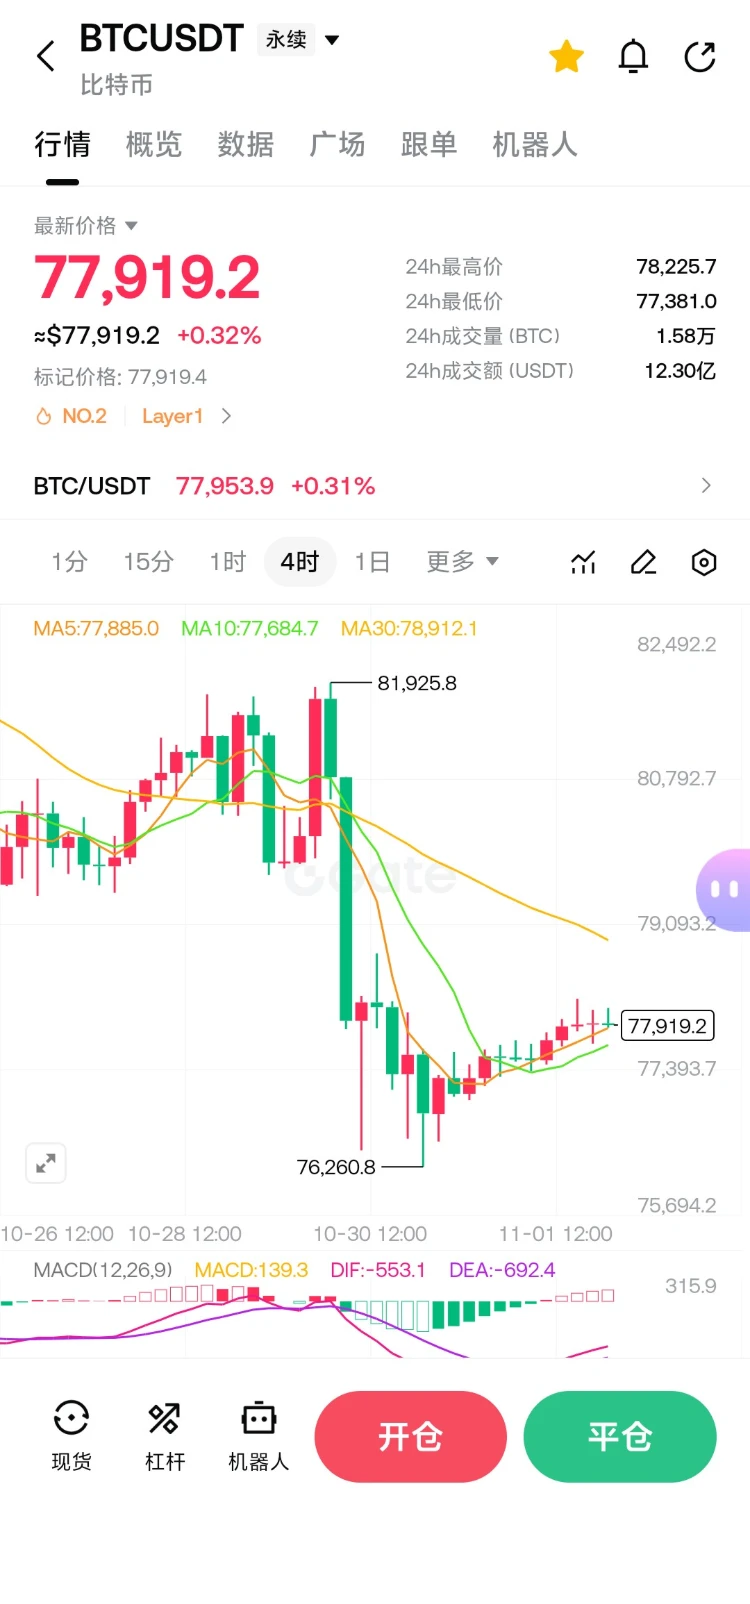
Bitcoin ($BTC ): Next key support levels after losing $80,000
Bitcoin's break below $80,000 is technically significant because that level can now act as resistance rather than support.
With BTC trading around $77,000 and selling pressure increasing, I would focus on $75,000–$76,000 as the next important support zone, followed by $72,000–$73,500 if sellers maintain control.
The key question is whether buyers can defend the $75K region or whether the market enters another leg lower.
Key BTC support map
Bitcoin (BTC) $77,379.00
Immediate support $76,900–$76,200 Firs
post-image
BTC-0.67%
Afternoon Market Updates
live-cover
LIVE1,092
#AIN I got stopped out, and then it dropped. So painful
post-image
AIN+3.85%
market update
live-cover
LIVE2,962
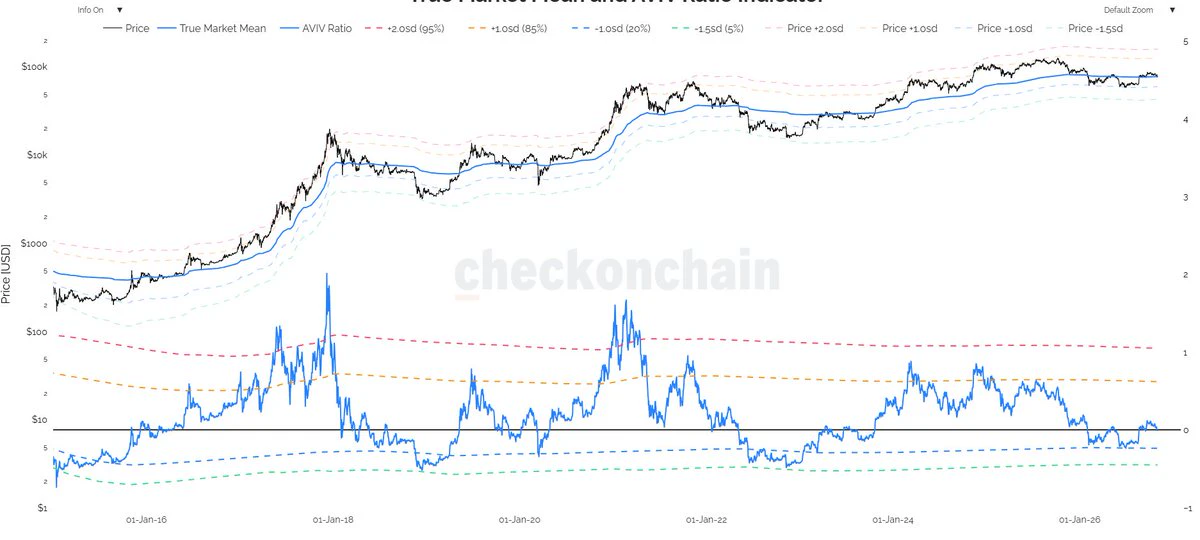
$BTC is right at the True Mean.
You know what to do 🫡
post-image
BTC-0.67%
Load More

Join 40 M users in our growing community

⚡️ Join 40 M users in the crypto craze discussion

💬 Engage with your favorite top creators

👍 See what interests you

Trending Topics

BTC大跌

508.75k Views39.9k Discussing

$BTC briefly fell below $77,000 and remains under pressure around the $77K zone, with its 24-hour decline still above 4%. With risk appetite weakening and Fed uncertainty rising, where is the next key support after losing $80K?

IntelBeatsEarningsButStockPlunges

47.78k Views1.09k Discussing

StrategySTRCNears100ParValue

56.12k Views4.22k Discussing
View More