
Share crypto content and earn up to 60% commissions through content mining.
placeholder
gatefun
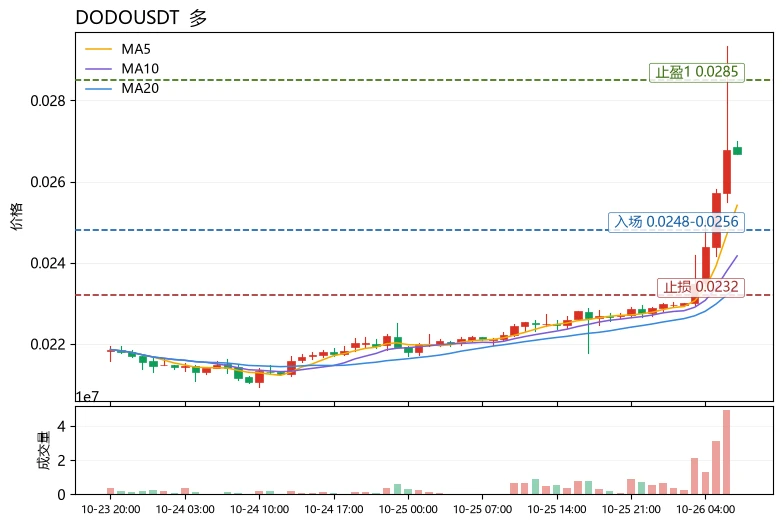
After BICO surged 25% on heavy volume but failed to continue rising, chasing a long here would just make you exit liquidity for the big players. I’m only watching the 0.0475 dip-buying zone; I’ll buy if it gets there, and stay out to watch if it doesn’t. 24-hour trading volume is $126 million, and the turnover rate is high enough, but the price fell back after failing to hold above the 0.0516 high, showing that the selling pressure overhead is very real. My plan: place orders to enter at 0.0475–0.0485, set a stop-loss at 0.0448, with a first target of 0.0520 and a second target of 0.0560, whil
BICO30.19%
View Original
post-image
post-image
post-image
  • Reward
  • Comment
  • Repost
  • Share
I just asked around in the community, and several people still have that BTC long at 62,600 open.
It’s been over a week. I thought they had all exited long ago, but after asking around, I found out quite a few hadn’t taken profit at all and were still holding. I’ve got to respect that mindset.
This past week, BTC has just been grinding back and forth around 64000, neither rising nor falling. This kind of market is the most agonizing. Honestly, I almost lost my composure too.
#股票交易分享挑战 $BTC There are only two paths from here: either exit at breakeven or take a big bite. At least it can’t turn
BTC-1.40%
View Original
post-image
  • Reward
  • Comment
  • Repost
  • Share
8.11 Bitcoin morning strategy
Long entry zone around 63,500–64,000
First target: 65,000; second target: 65,500
Place the stop-loss below 627
This is an important buying-demand zone on the 4-hour/daily charts. Previous pullbacks have repeatedly attracted buying support at this level, which is the lower boundary of the current consolidation range.
The daily 20-day moving average is near this zone, making it a dip-buying area after the pullback rather than a level to chase higher. A pullback to this level indicates that the short-term correction has been released, offering a chance to trade a reb
BTC-1.40%
View Original
post-image
  • Reward
  • Comment
  • Repost
  • Share
#GoldBreaks4400USD : A MAJOR MILESTONE FOR THE GOLD MARKET
Gold breaking above the $4,400 per ounce level would represent another remarkable milestone for the precious-metals market and a powerful signal of how strongly investors are valuing safety, liquidity, and protection against uncertainty.
The move is more than just another round number on a price chart. A psychological level such as $4,400 can attract significant attention from traders, investors, institutions, and market analysts because major price levels often influence market sentiment and trading behavior.
When gold reaches a new
post-image
  • Reward
  • 2
  • Repost
  • Share
SopnaAktar:
2026 GOGOGO 👊
View More
Tether Treasury minted 1 billion USDT on the Tron chain, worth approximately $1 billion.
USDT0.00%
View Original
post-image
  • Reward
  • Comment
  • Repost
  • Share
$BEAT , if I’d known you could drop this much, I wouldn’t have closed my short position.
BEAT-46.64%
View Original
post-image
post-image
  • Reward
  • 1
  • Repost
  • Share
NoProfitWithoutACondom:
If you don't cut your short position, they'll pump the market and liquidate you.
$BTC is currently around $64,040, having retreated from yesterday’s high of around $65,400, but it is now right near the $64,000 support, so chasing shorts directly at the support level is not recommended.
Focus on these levels: $64,000: immediate support; $63,300–$62,600: the first target after $BTC breaks below $64,000; $62,000–$60,000: the true core support zone; $64,800–$65,500: rebound resistance; if $BTC regains a firm foothold above $65,500: the short-term bearish thesis will weaken significantly.
More reasonable conditions for a short position: a valid break below $64,000 on the 1-h
BTC-1.40%
View Original
post-image
  • Reward
  • 3
  • Repost
  • Share
DerivativesGardener:
What I care more about is the CPI data on August 12. Once such data is released, any support level could prove flimsy, so it’s still best to stay lightly positioned and wait for direction.
View More
BACK TO BACK BANGERS TRADE 💰
CLEARED 2 FOUNDED ACCOUNTS IN ONE SETUP 🤌
TELEGRAM LINK IN BIO
post-image
post-image
post-image
  • Reward
  • Comment
  • Repost
  • Share
There are still too many people losing money; making money is too hard.
View Original
  • Reward
  • Comment
  • Repost
  • Share
On August 11, 2026, the short-term bearish trend for ETH futures is relatively clear. After failing to break the $1,937 high, the price has fallen below the $1,900 round-number level, showing a weak pattern of declining prices on rising volume.
📊 Key Levels in the Long-Short Battle
· Current price: Approximately $1,873 - $1,878, with the intraday low dipping to around $1,866.
· Resistance above (ceiling for a rebound): $1,890 - $1,905 is the core short-term resistance zone. Before breaking above this area, any rebound should be viewed only as a weak recovery within the bearish trend; stronger
ETH-2.06%
View Original
post-image
  • Reward
  • 1
  • Repost
  • Share
ShuranR:
On August 11, 2026, the short-term bearish trend in ETH futures is relatively clear. After failing to break above the $1,937 high, the price has fallen below the $1,900 psychological level, showing a weak pattern of high-volume decline.

📊 Key Battleground Levels for Bulls and Bears

· Current price: approximately $1,873–$1,878, with the intraday low dipping to around $1,866.
· Resistance above (ceiling for rebounds): $1,890–$1,905 is the core short-term resistance zone. Before breaking above this area, any rebound should only be viewed as a weak recovery within the bearish trend; stronger resistance lies at $1,925–$1,937.
· Support below (bulls’ line of defense): The first support zone is $1,866–$1,874 (the intraday low and lower Bollinger Band). If this level fails, the next key support is at $1,850, while the medium-term lifeline moves down to $1,830–$1,846 (200-day moving average).
Another precise wick catch, perfectly anticipated. Take profits and move your stop-loss to breakeven yourself (don’t be greedy and try to take too much in the current market).
View Original
post-image
  • Reward
  • 3
  • Repost
  • Share
LedgerLoyalist:
Steady—preserving capital is the real discipline.
View More
Sister U 8.11$BTC @Morning Strategy
Yesterday, after the price surged to 65400 and reached a short-term high, the market quickly reversed. Consecutive large bearish candles drove the price directly below the short-term upward trendline, and the short-term market trend completely shifted from bullish to bearish, marking a rapid decline following the end of the uptrend.
A small K-line signaling a halt to the decline has formed at the current low, while short-term indicators have entered oversold territory, creating the potential for a technical rebound and recovery. The key distinction is that
BTC-1.40%
View Original
post-image
post-image
  • Reward
  • Comment
  • Repost
  • Share
Crypto Market Momentum | Live Trading Room
gate liveLIVE
878
live-coin
  • Reward
  • Comment
  • Repost
  • Share
✅August 10 BTC short strategy perfectly played out
Entry range: 65500-65800
Price surged to 65337.9 before coming under pressure and falling back
Dropped as low as 63775.9, with both take-profit levels hit, securing an additional 1500+ points
The high-short strategy at the resistance level was fully validated by the market. $BTC #非农爆雷降息预期逆转
BTC-1.40%
View Original
post-image
post-image
  • Reward
  • Comment
  • Repost
  • Share
$$HEMI ’s data looks off. The 24-hour trading volume is 4.3M, yet the price was smashed from 0.0057 to 0.0049, with a 16% swing, before closing at 0.0050. This kind of volume-price divergence is rarely seen even once in half a month on Gate Square. Let me state my conclusion first: this is not ordinary shakeout.
I looked through the order book details and found three anomalies: First, the order depth at 0.0050 is three times the usual level, as if someone deliberately laid down a cushion; second, the 24h low of 0.0049 landed exactly at the previous low support without breaking through even wit
HEMI-10.01%
BTC-1.40%
View Original
post-image
post-image
post-image
  • Reward
  • Comment
  • Repost
  • Share
Early ETH outlook
Trade:
Short near 1885–1895 after a rebound
First target: 1850–1830
Second target: 1800–1780
Set a stop-loss
After a sharp drop, ETH has entered a low-level narrow-range consolidation, with the rebound clearly weaker than BTC’s. The upper Bollinger Band continues to exert strong resistance, and repeated attempts by the bulls have failed to break through effectively. The MACD has formed a golden cross below zero, but the red bars are extremely short. RSI momentum has slowed after rising sharply, and overall the market remains in a weak recovery phase within a downtrend continu
ETH-2.06%
View Original
post-image
  • Reward
  • Comment
  • Repost
  • Share
The truest confidence in market performance is always found in the data on funds and trading volume🔥
The latest CEX trading data across the entire market is out: Gate ranks fourth globally in combined spot and futures trading volume. Amid the current market volatility, capital outflows from most platforms, and shrinking liquidity, maintaining the fourth position globally is by no means accidental. This is not short-term hype, but the result of long-term stable order book liquidity, sustained net capital inflows, and solid market depth.
View Original
post-image
  • Reward
  • Comment
  • Repost
  • Share
8.11 Bitcoin $BTC Analysis
Entry: Short near 64500‑65000
Defense: 65500
First target: 63500
Second target: 62500
After spiking, the market has continued to weaken, with rebounds consistently lacking strength. For now, this is only a brief recovery after a sharp decline. Selling pressure is concentrated around the 64500‑65000 resistance zone above, and trapped-holder selling pressure will become more apparent if prices rebound into this range. As long as the price cannot hold above 65500, the broader bearish structure remains unchanged.
#GPU龙头摩尔线程将赴港上市
BTC-1.40%
View Original
post-image
  • Reward
  • Comment
  • Repost
  • Share
📉 $APT – Remains in a clear downtrend across multiple timeframes
🔴 APT SHORT
🎯 Entry: 0.5871 – 0.5874
🛑 Stop Loss: 0.5990
🎯 TP: 0.5755 - 0.5638 - 0.5520
APT-1.16%
post-image
  • Reward
  • Comment
  • Repost
  • Share
Load More

Join 40 M users in our growing community

⚡️ Join 40 M users in the crypto craze discussion
💬 Engage with your favorite top creators
👍 See what interests you
  • Pinned