Square
Following
Hot
News
Notifications
Profile
Share your thoughts
placeholder
Article
Where can I buy this jacket @JensenHuang ?
Asking for a friend
post-image
How can you build a risk warning system for a trading strategy to detect anomalies before losses mount?

Many traders spend a great deal of time researching entry signals, but rarely plan ahead for something else:

If a strategy starts to fail, how can I detect it in time?

By the time a series of losses or a substantial account drawdown prompts you to review the strategy, you may already have paid an unnecessary price.

A truly mature trading system needs more than entry and exit rules. It should also have a mechanism to detect anomalies, limit risk, and trigger a review.

1. First, be clear
post-image
Trenches
ZIG
Z
bade
b
ZIG
0x8c...1145
Market Cap
$.
Change
.
24h Vol
$.
Holders
.
BTC
B
bade
b
BTC
C5xp...pump
Market Cap
$.
Change
.
24h Vol
$.
Holders
.
STONK
S
bade
b
STONK
6GmA...UNgx
Market Cap
$.
Change
.
24h Vol
$.
Holders
.
ANSEM
A
bade
b
ANSEM
9cRC...pump
Market Cap
$.
Change
.
24h Vol
$.
Holders
.
CLAUDIA
C
bade
b
CLAUDIA
2j5S...W2ZM
Market Cap
$.
Change
.
24h Vol
$.
Holders
.
How do you create a weekly trading plan for BTC?
Many BTC traders wake up every morning and immediately open a market app to see how much the price has risen or fallen, then make a last-minute decision about whether to go long or short that day.
The biggest problem with this approach is that you make decisions every day without having a complete trading framework. When the market rises, it’s easy to chase the rally; when it falls, it’s easy to panic. In the end, short-term volatility dictates your actions.
If you want to improve your trading discipline, you can try creating a weekly trading pl
post-image
BTC-0.65%
Live Market Update
live-cover
LIVE1,422
$XBRUSD ‌$CL ‌$BZ ‌
What happened to oil—from $118 down to the $90s?

The sharp decline in oil prices has been confirmed. Brent crude, which peaked above $118 on October 30, has retreated by approximately 18%, falling below the $100 mark for the first time since October 7 and closing the week with a loss of over 12%. It has been verified that WTI is trading around $90, and the prices displayed for both Brent and WTI are consistent with live market data. The catalyst for this drop—expectations of negotiations between the U.S. and Iran—has been confirmed by various sources, pointing to discus
XBRUSD-0.10%
CL-1.83%
BZ-1.18%
  • 3
Seems like $ESPORTS $ESPORTS is finally catching a bit of a bid after that nasty drop. Is this the floor or just another trap before we head lower? Watching the 15m closely to see if buyers actually show up here.TP: 0.00985SL: 0.008849Around the market:
$ETH : Current Price 2,146.75 - 24h Change: -3.90%
$AIO : Current Price 0.04771 - 24h Change: +14.74%
post-image
ESPORTS-5.30%
ETH-1.26%
AIO-3.19%
🔹Democrats Sweep Congress: Is a Major Shift Coming for Crypto? Tighter SEC Oversight and Prediction
live-cover
LIVE2,529
  • 1
2026.11.9 BTC/ETH/XAU/SNDK Analysis
Markets surged and plunged in early Monday trading, with $1.015 billion wiped out in liquidations over the past 24 hours and 149020 people wiped out;
The long-to-short liquidation ratio reached 10:1, putting an end to last week's call—the bulls were practically wiped out!
XAU is moving independently, surging $100 in early trading; keep watching the 3970-4000 level: if it doesn't break below decisively, that points to a potential short- to medium-term bottoming attempt. No need to hold on too long; take a small position near the bottom of each swing and move
post-image
BTC-0.67%
ETH-1.26%
SNDK+3.53%
  • 7
Some people say Jensen Huang must be starving
He can stomach this?
Wrong!
Huang's eyes have built-in ray tracing and DLSS 5
Effects turned all the way up!
post-image
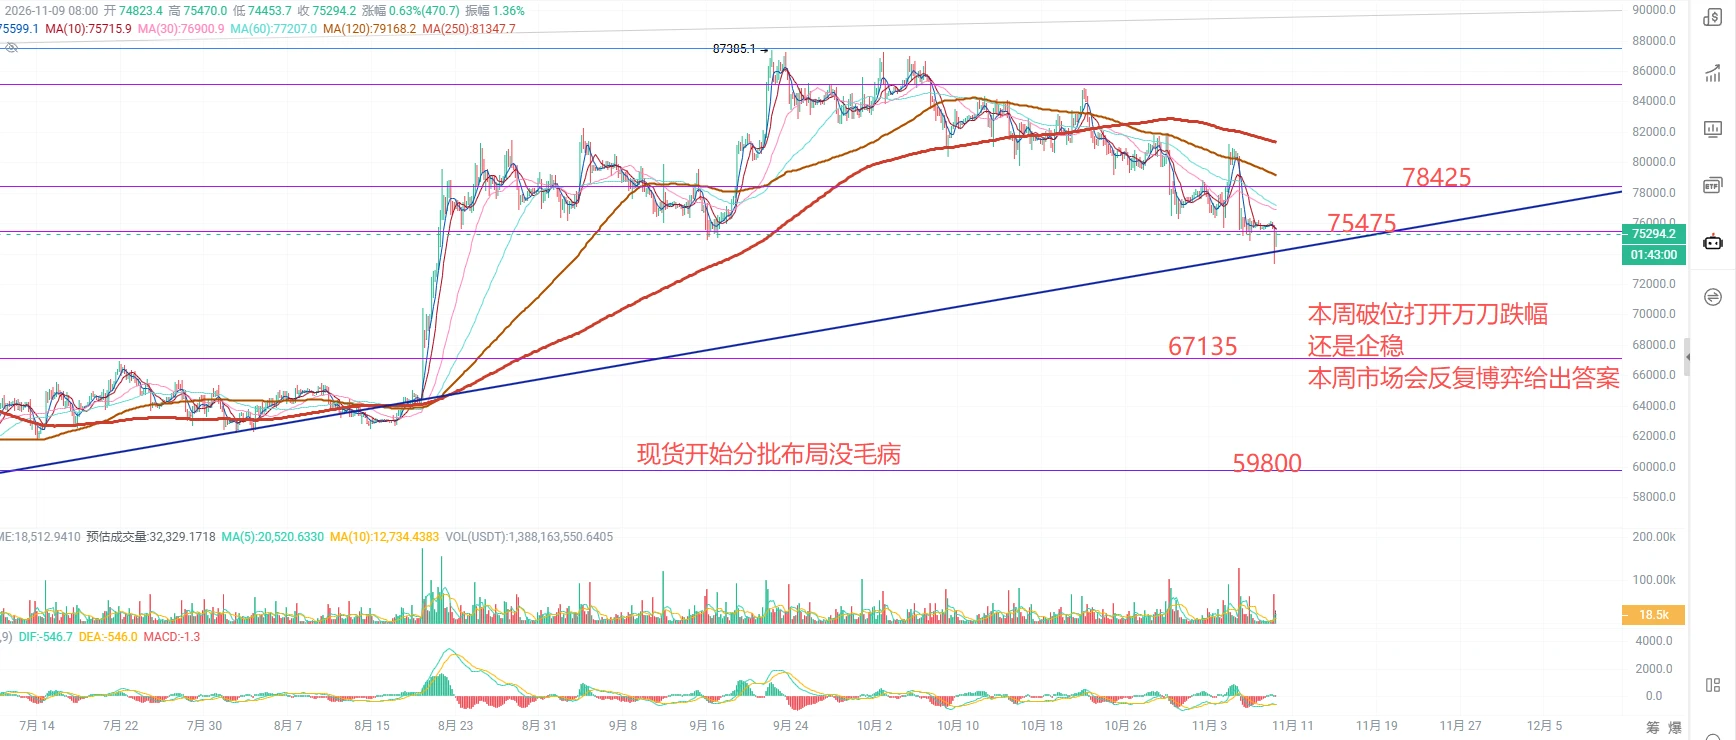
Monday morning, the range that had been hovering around 76000 all weekend was smashed through overnight.

BTC hit a low of 73550 on Gate and is now around 74800. ETH looks worse, around 2130, down nearly 5% in 24h, with a low of 2065. SOL is near 87.3.

Why the drop? Simply put, no money is coming in. Last week, U.S. spot Bitcoin ETFs saw net outflows of about $1.28 billion for the week, including $410 million on Friday alone, most of it from BlackRock's IBIT. ETH ETFs have also seen outflows for several consecutive weeks.
Weekend longs were too crowded, and the overnight drop liquidated about
BTC-0.67%
ETH-1.26%
SOL-0.77%
IBIT-0.30%
#StockTalkSeason #SKHynix #WCTCS9
SK Hynix: Is a Strong Recovery Ahead?

Current Reference Price: 851 USDT

SK Hynix is approaching an important trading zone as investors monitor the semiconductor sector, AI infrastructure demand and the growing market for high-bandwidth memory (HBM).

My view is that SK Hynix has strong fundamental growth potential, but its short-term technical structure needs improvement. At 851 USDT, traders should focus on whether buyers can reclaim resistance or sellers will push the price toward lower support.

Market Fundamentals
SK Hynix recently announced impressive
SKHYNIX+1.41%
SK Hynix+3.79%
  • 3
Why might an edge gradually disappear as more people adopt similar trading strategies?

A trading strategy is backtested and performs well.

More and more traders discover similar signals and begin entering at similar prices, and taking profits and stopping out at similar levels.

At first, the strategy remains effective.

But after some time, traders begin to notice that price action after entry has changed, slippage has increased, profit potential has narrowed, and previously stable performance has begun to fluctuate.

Why?

One easily overlooked fact is:

A trading strategy's edge comes not
post-image
BLG really has the script of destiny in hand
post-image
#美国10月CPI即将公布 #WCTCS9 On the Eve of CPI: We’ll Know Tomorrow at 21:30—My Market Forecast and Three-Step Strategy

Tomorrow (Tuesday, November 10) at 21:30, U.S. October CPI will be released.

The market has already priced in about a 77% chance of a rate hike in December—once the data is out, that will either be confirmed or disproven. This post covers my forecast and what I plan to do.

【My Forecast: The Base Case Is “In Line With Expectations,” With Volatility at Either Extreme】

September CPI rose 0.6% month over month (the biggest increase in five months) and 3.7% year over year; core CPI r
BTC-0.65%
NAS100-0.07%
GLDX-0.40%
  • 3
  • 1
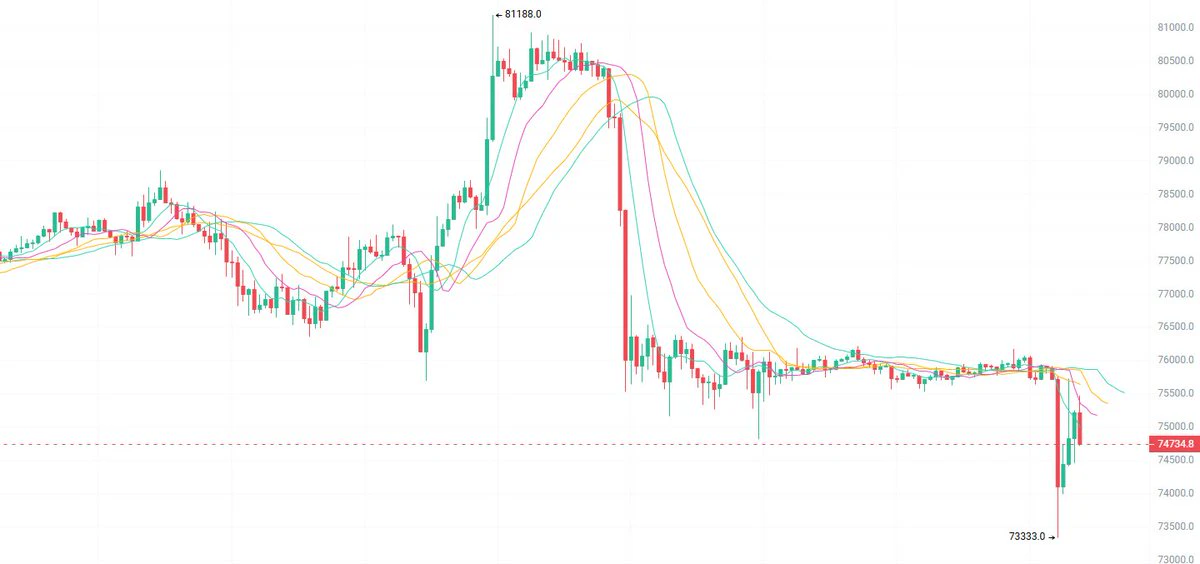
On Nov. 9, BTC’s rebound is facing resistance around 75,500. Look for a move down to 74,000/73,300.

For those looking to go long, wait for price to stabilize near 73,300 before entering. Set a stop at 72,800, with targets at 74,500/75,000.

On the 1-hour chart, price has plunged from the high of 81,188. The previous consolidation support at 75,800 has given way. After briefly dipping to 73,333, price rebounded.

However, the moving averages remain bearishly aligned, and 75,000/75,500 are short-term resistance. For now, treat the rebound as a corrective bounce. $BTC #BTC
post-image
BTC-0.67%
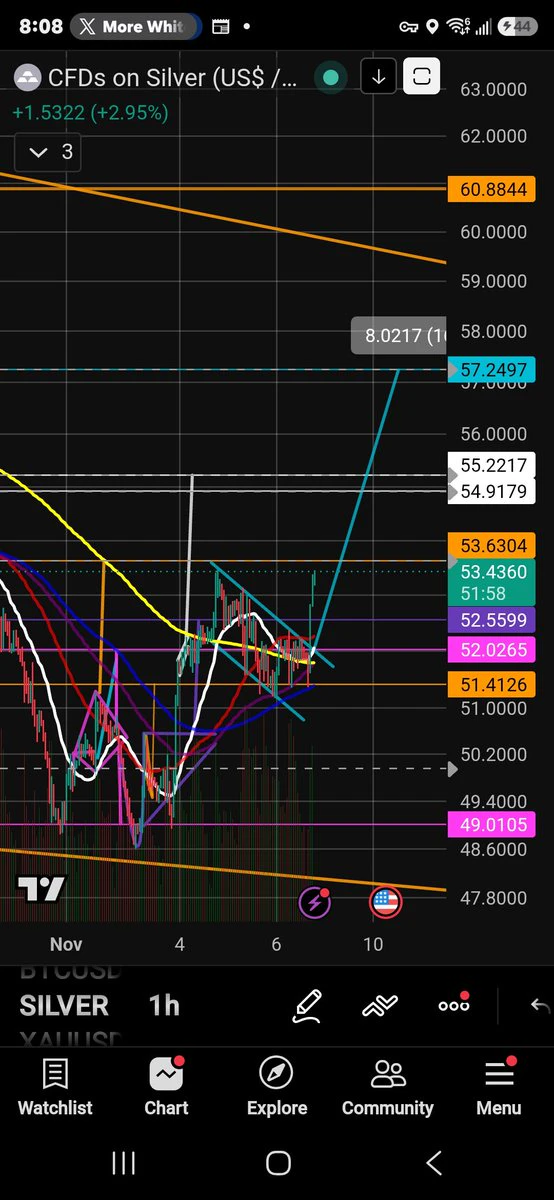
$SILVER RUNNING UP TO NEXT PROJECTED TARGET! 🎯
Good night everyone. 💤
See you all tomorrow!
Everything is fine when you are rolling your capital into more gains.
Nothing is ever financial advice. 💯
Structure no smoke!
🔥🐶🔥
post-image
XAG+0.47%
After Jensen Huang admitted having an affair, a whale opened a 10x short on 30,000 $NVDA ($5.44M) on Hyperliquid.
NVDA-0.35%
Why Can a High Backtest Win Rate Still Lead to Persistent Losses in Live Trading?

Have you ever seen a trading strategy like this?

Its backtest win rate reaches 70%, and the equity curve keeps climbing. Its parameters have been optimized repeatedly, and its historical performance looks quite impressive.

But once it goes live, the account starts bleeding slowly.

Some people think market conditions have changed, some think the parameters still need improvement, while others start looking for new indicators.

But before modifying the strategy, there is a more important question:

Does your ba
post-image
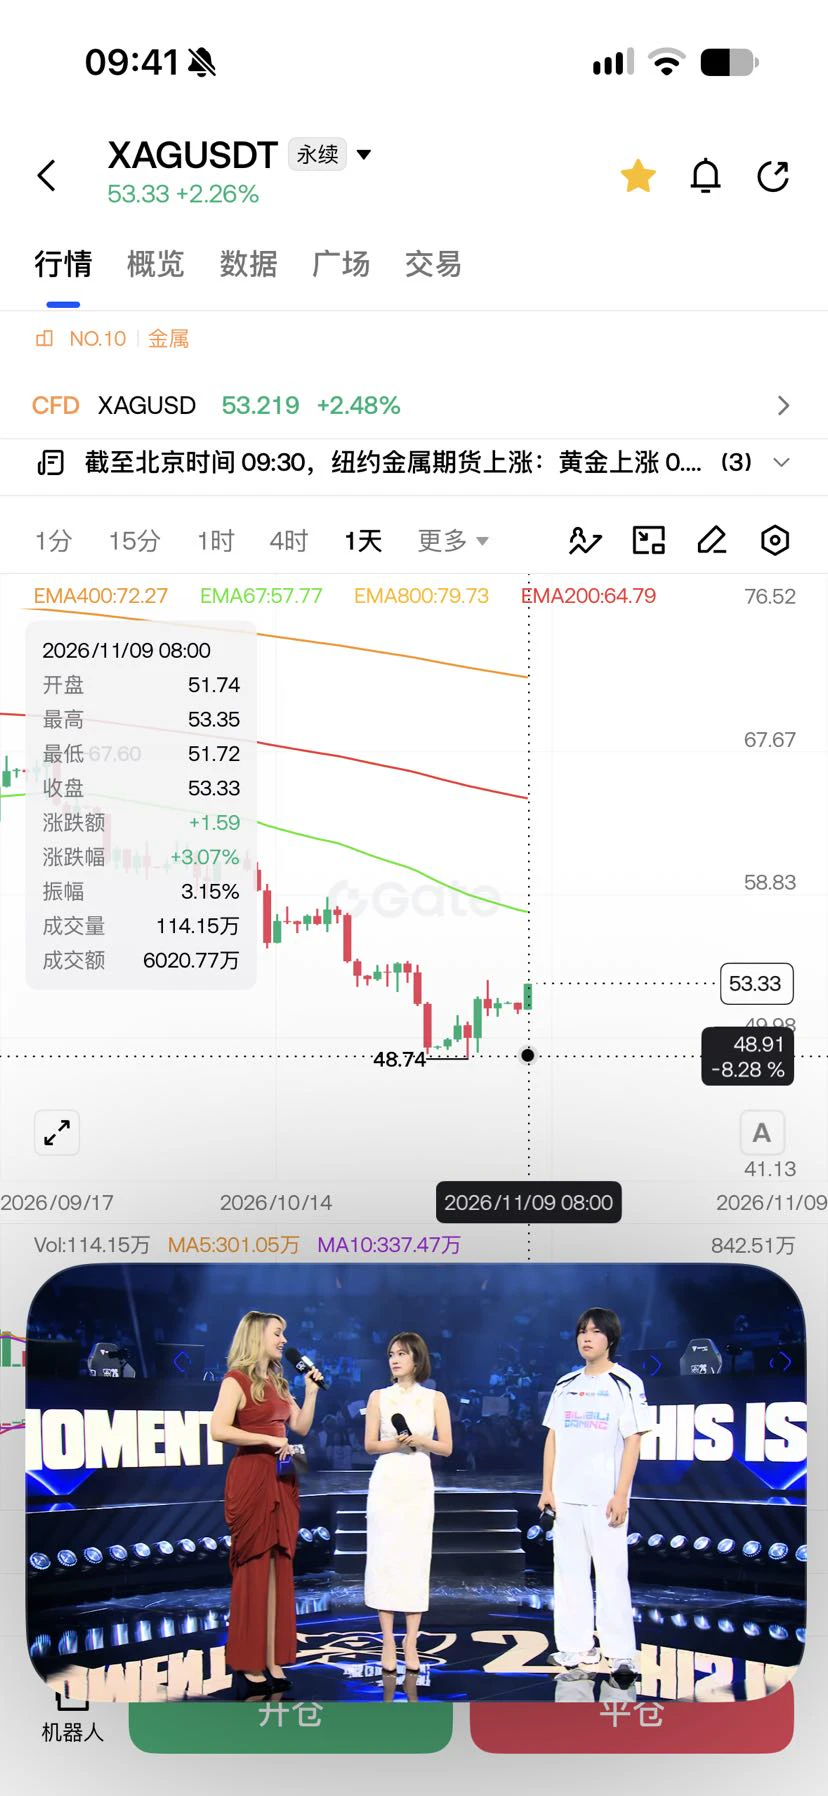
Silver is looking strong. Long at 48.88—let’s go! $XAG
post-image
XAG+0.47%
Load More

Join 40 M users in our growing community

⚡️ Join 40 M users in the crypto craze discussion

💬 Engage with your favorite top creators

👍 See what interests you

Trending Topics

USCPIDataIncoming

21.09k Views1.72k Discussing

The U.S. October CPI report will be released on November 10 at 8:30 a.m. ET. September CPI came in at 3.7% year over year, and markets will be watching closely for signs that inflation is cooling, especially in core CPI. A softer-than-expected reading could strengthen rate-cut expectations, while hotter inflation may pressure risk assets through higher Treasury yields and a stronger dollar. How do you think this CPI print will move $BTC, U.S. stocks and gold?

BTCFlashCrash

11.44k Views66.02k Discussing

USAIStocksHitHard

31.15k Views3.75k Discussing
View More