
Square
Following
Hot
News
Profile
Share your thoughts
placeholder
Article
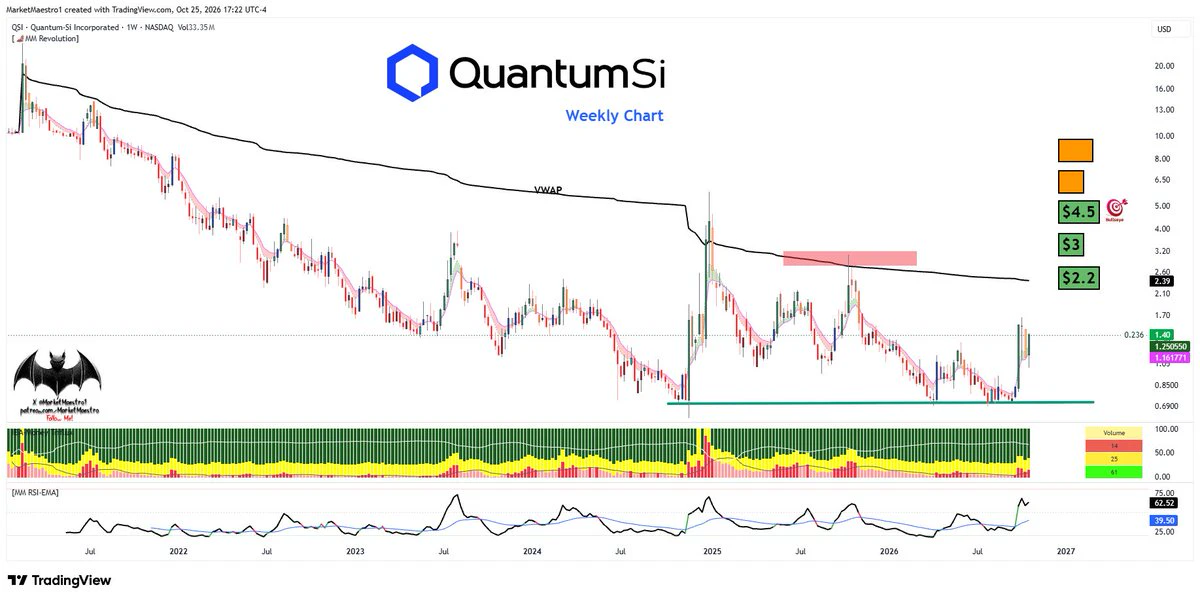
$QSI
It spikes occasionally but hasn’t been able to sustain a rally. With rotation into biotech during this period and this being a microcap, it could make similar spikes again. There’s currently Proteus driven momentum and retail interest
post-image
Trenches
STONK
S
bade
b
STONK
6GmA...UNgx
Market Cap
$.
Change
.
24h Vol
$.
Holders
.
BTC
B
bade
b
BTC
C5xp...pump
Market Cap
$.
Change
.
24h Vol
$.
Holders
.
CNPY
C
bade
b
CNPY
0xc6...ddd2
Market Cap
$.
Change
.
24h Vol
$.
Holders
.
LAUNCH
L
bade
b
LAUNCH
AhBi...Qj6C
Market Cap
$.
Change
.
24h Vol
$.
Holders
.
ZIG
Z
bade
b
ZIG
0x8c...1145
Market Cap
$.
Change
.
24h Vol
$.
Holders
.
Shorts dump it down 22.5%, $ANIME volume ratio 5.938—I’m bullish
$ANIME Currently at 0.00291, down 22.5% in 24h. I’m bullish at this level—the shorts are dumping their bags to you.
Futures sentiment is bearish, with a funding rate of -0.00064505 and a long-short account ratio of 0.9124. Shorts are overwhelmingly dominant. But spot isn’t buying it: 24h trading volume is 5564918 USDT, and the volume ratio has hit 5.938, with huge volume being fully absorbed. Daily RSI at 63.3 is strong; MACD has formed a golden cross below the zero line, and the red bars are still growing.
The headwinds are rea
ANIME-27.73%
ETF funds wash back and forth like tides, flowing in quickly and leaving just as fast. Market sentiment swings sharply with the direction of fund flows—inflows spark cheers that the bull market is back, while outflows trigger fears of an impending crash. 😂
But looking at the market calmly, this looks more like a typical shakeout and should not be overinterpreted.
The short-term outlook is indeed weak, and another sizable correction is likely ahead. The key variable is the Fed meeting: if it signals a continued hawkish stance, rate-cut expectations disappoint again, and U.S. stocks weaken, Bit
post-image
BTC-0.10%
When gold prices are hitting new highs, I’m actually reducing my position. Don’t rush to argue. The 20-, 50-, and 200-day moving averages are all trending upward, so the short-term trend is still intact. But chasing it at these levels offers a poor risk-reward tradeoff. After doing this for so long, I’ve learned that position sizing always matters more than calling the direction. Save this call and come back tomorrow to see if it holds. If you’re watching, follow #Gold
post-image
GLDX+0.16%
PAXG+0.05%
XAU+0.16%
What #memecoin is here?
Shill me!
post-image
MEME-2.02%
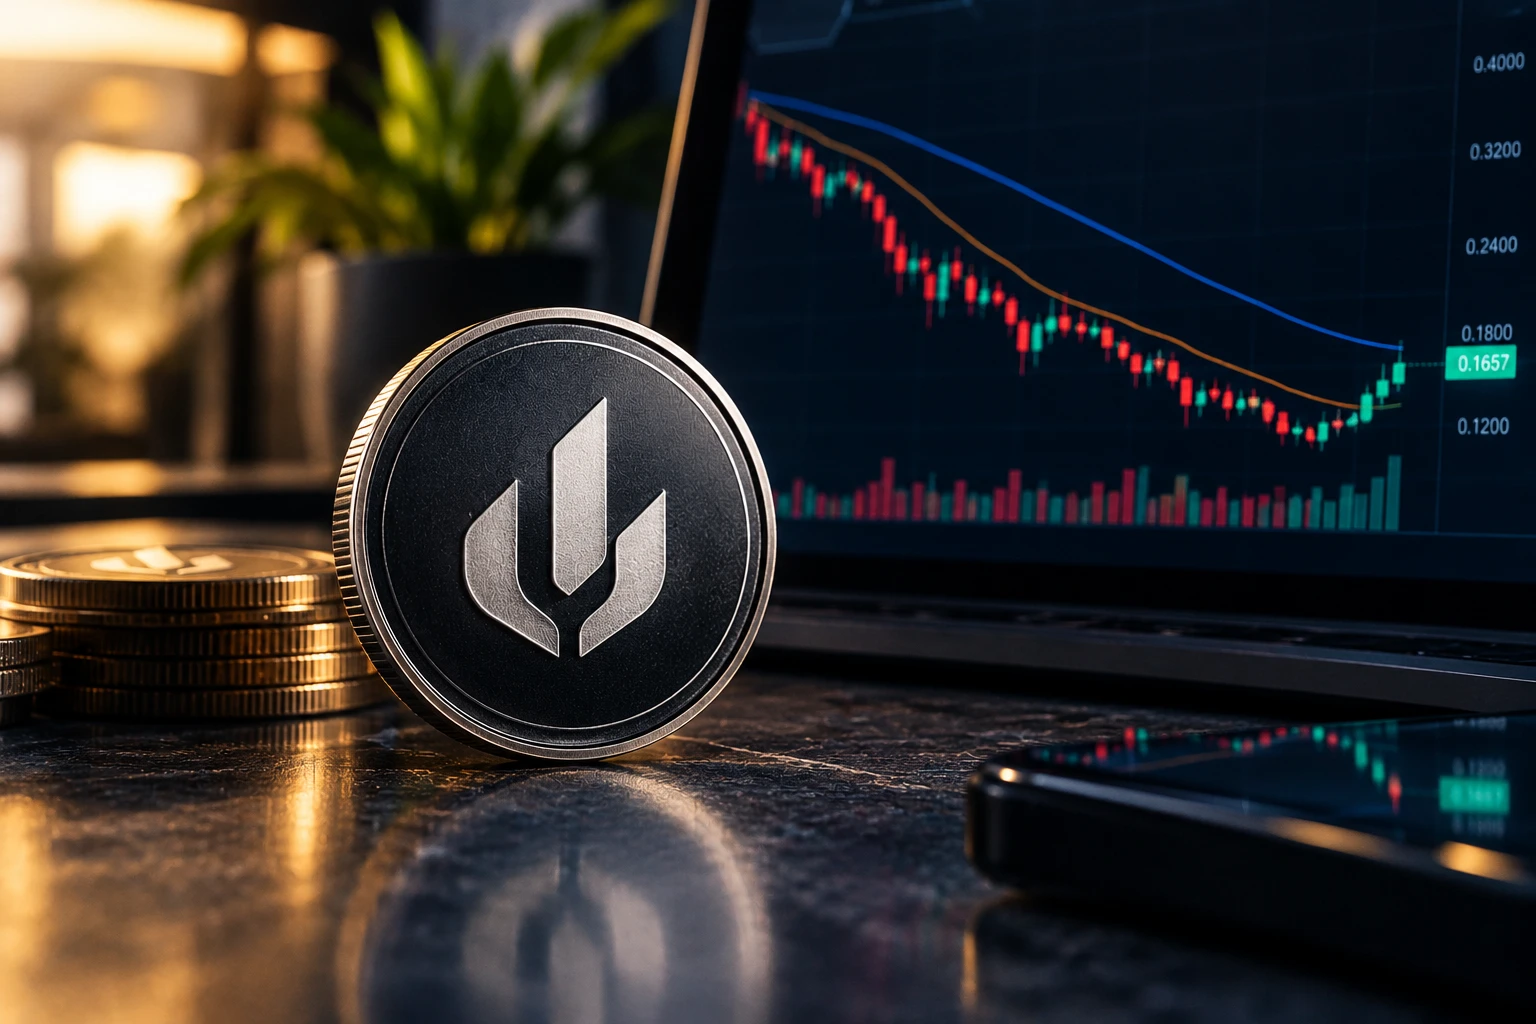
$UP Recovery or Just a Temporary Bounce?
$UP gained 13.44% to $0.1657 after rebounding from $0.1228. The move is encouraging, but the broader downtrend remains a concern.
Price is still below its 30-day moving average near $0.1858. A sustained break above this level could strengthen the recovery, while rejection may bring renewed selling pressure.
With $1.31M in reported liquidity versus $11.26M in 24-hour volume, sharp price swings and slippage remain risks.
Momentum starts the move. Holding key levels determines whether it lasts.
Would you trust this rebound, or wait for confirmation?
#Unit
post-image
UP+10.13%
  • 2
Guys, although 2377 wasn't reached, that's even better news: it means buying pressure is weaker than we thought, and an M top has formed. Enter a short at 2335 to 2340, take profit at 2295. More conservative traders can close half at 2320 and set a stop to breakeven (70~100x leverage recommended), with a stop loss at 2460
post-image
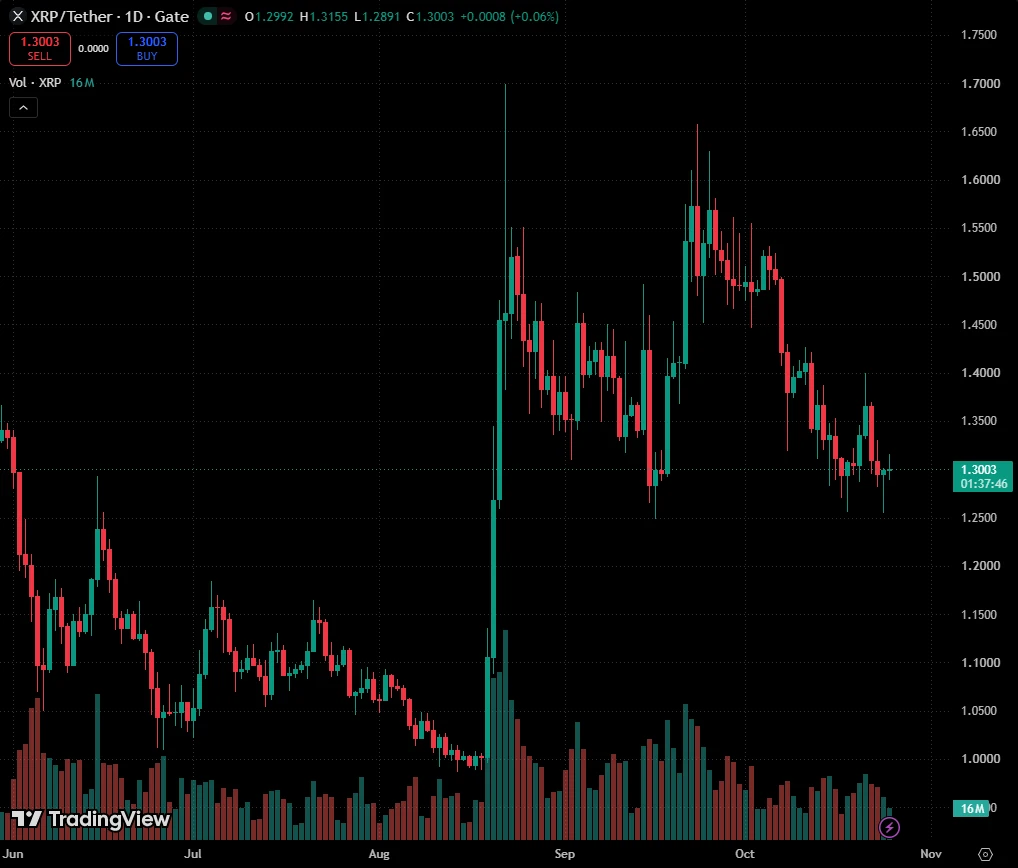
$XRP XRP Got One Bounce in October. It Was Rejected. 1.21 Next?
XRP has had exactly one real bounce in the second half of October, and the monthly grid shut it down.
This is the October monthly grid, built from September's high, low and close, on daily candles. The pivot is 1.4650. The S 0.184 zone, the bottom of the neutral range, runs from 1.3679 to 1.4049. S 0.382 is at 1.3079, and the S 0.702 zone runs from 1.1417 to 1.2108.
XRP lost the neutral range in mid-October and closed under S 0.382 for the first time on Oct 17, at 1.2941. Then on Oct 21 it bounced to 1.3992, right inside the S 0.1
post-image
XRP+0.21%
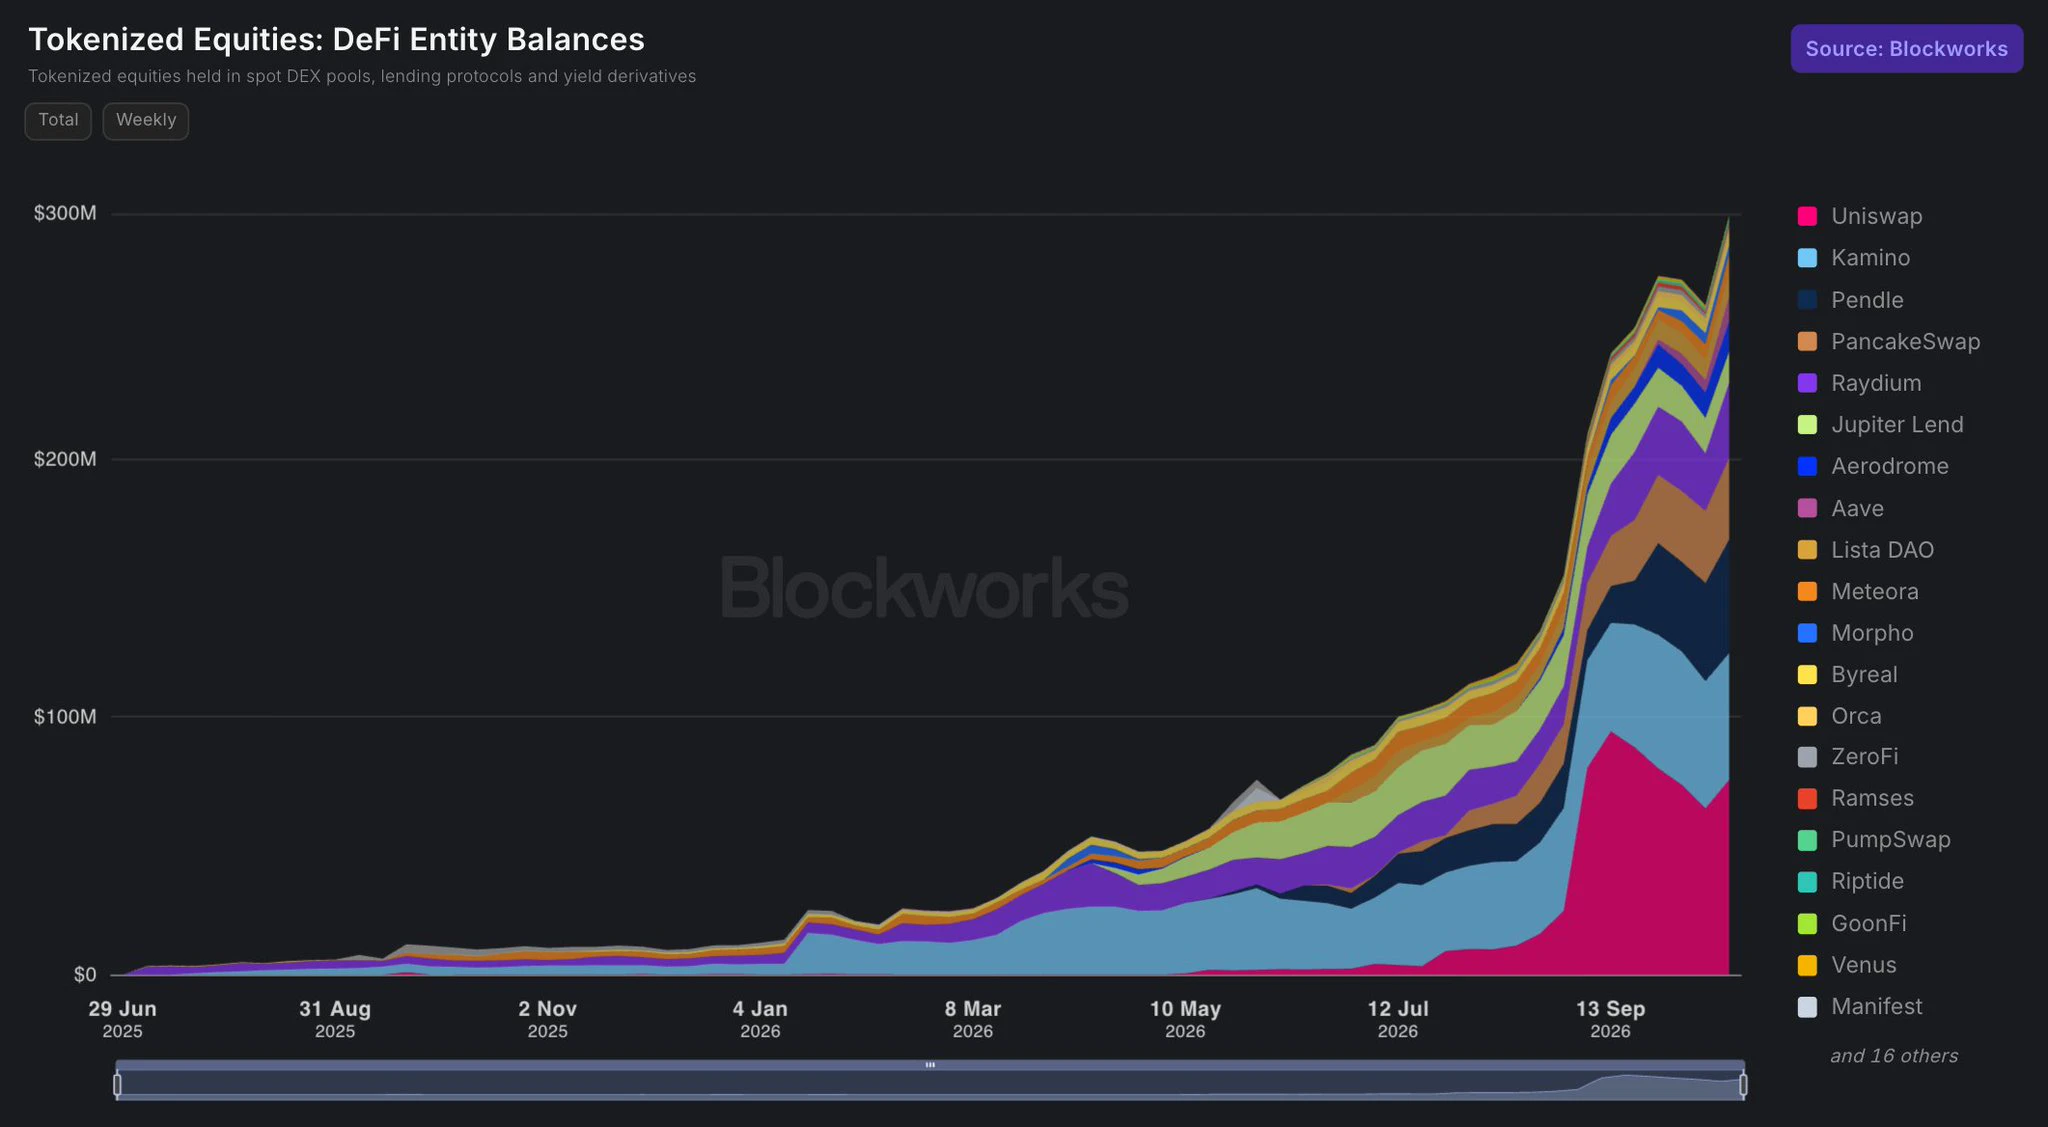
Close to $300m in tokenized equities have been deposited into DeFi.
$UNI leads the pack with around $70m in tokenized equities.
post-image
UNI+2.55%
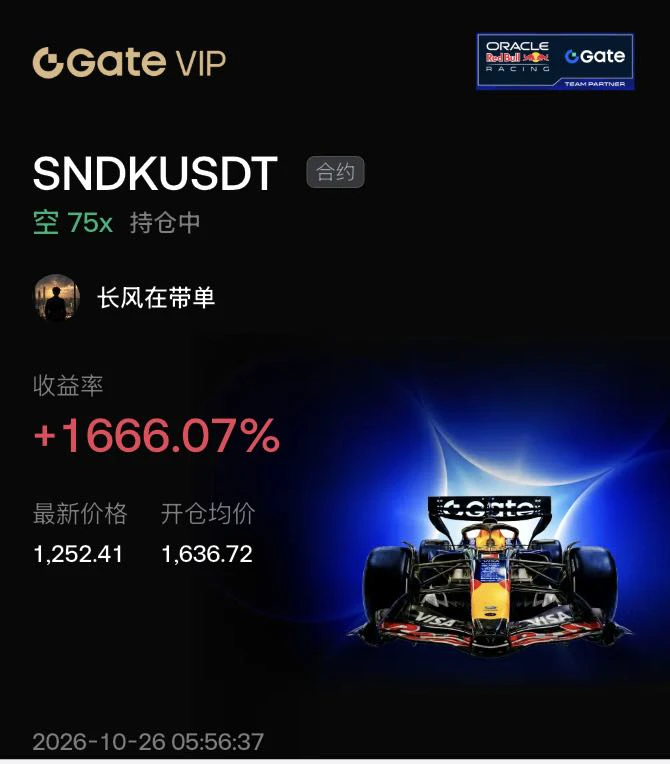
$SNDK I said long ago it couldn't go any higher, and all the news signals were crystal clear! Those who trusted me are having a great time flying high. I'll let you know next time SanDisk is about to take off! It should be soon!$SNXX
post-image
SNDK+1.85%
SNXX+3.75%
  • 1
Crypto Market Live Updates
live-cover
LIVE1,940
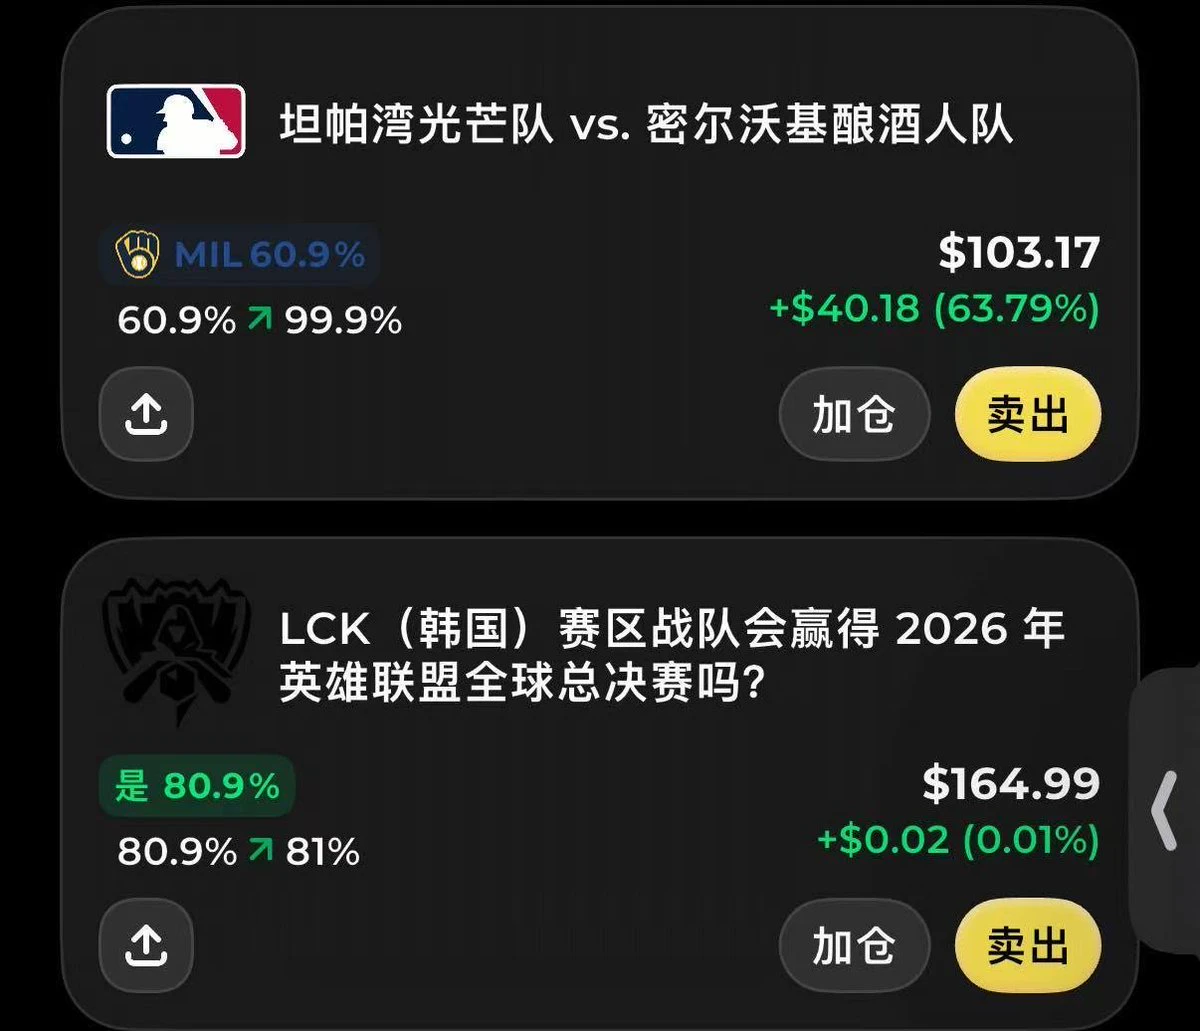
World Series Game 2 recap
Rays 4–5 Brewers (series 0–2)
Opening: The Rays dominated
Top of the first, Pratt’s throwing error opened the door,
consecutive hits + Liam Hicks’ two-run homer,
and suddenly it was 4–0.
Middle innings: The Brewers grind out at-bats and rally
Contreras and Mitchell immediately clawed back 2 runs in the bottom of the first;
Aranda’s error in the fourth gave them another run, making it 4–3.
Frelick’s game-tying homer in the sixth,
then rookie Pratt’s opposite-field hit put them ahead in the seventh.
Actually, besides the champion being the Brewers from the National Leag
post-image
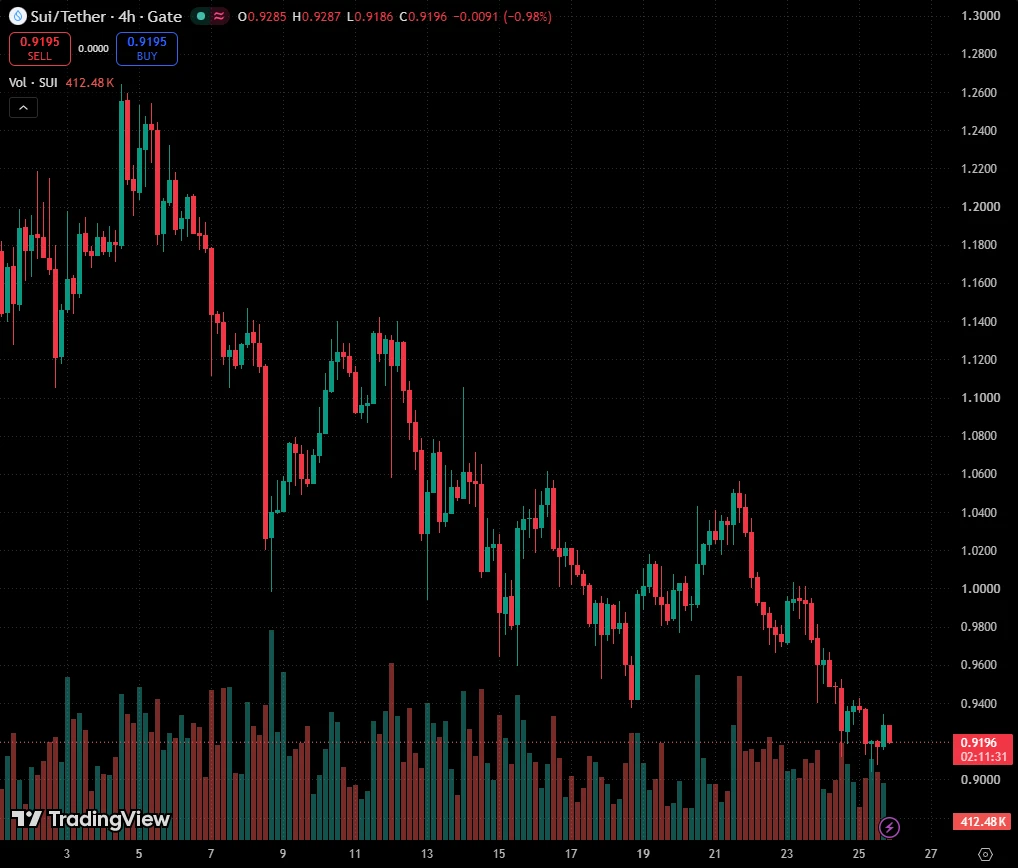
$SUI SUI analysis
SUI analysis:
The price is currently testing a major support area, which may lead to a bounce. Additionally, there is a falling wedge pattern; a breakout from this pattern could result in a significant upward rally. Consider opening long positions, but be sure to use a tight stop-loss.
post-image
SUI-1.28%
Field day for bears
$BTC
post-image
BTC-0.10%
📘 How is the spread in Venezuelan P2P really calculated? The essential guide breaks it down using data from the October 25 P2P Radar, and the difference between the overall average and the top of the book is key to avoiding overpaying.
The benchmark data:
• Buy USDT: Bs. 1.015,51
• Sell USDT: Bs. 985,15
• Official BCV rate: Bs. 887,30
• Premium over BCV: 14,45%
• Overall spread: 3,08% (Bs. 30,36 per USDT)
• Offers observed: 173
• P2P traffic light: yellow, 71 points
The spread is the difference between the buy and sell prices: 1.015,51 − 985,15 = 30,36 Bs., or 3,08% of the sell price. But kee
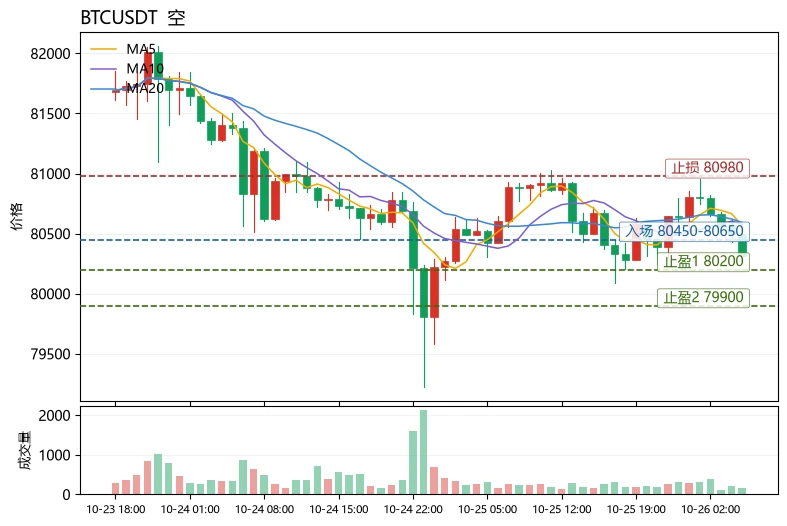
$BTC Short-term bias is bearish; favor shorting bounces. The core rationale is funding: BTC’s funding rate remains positive at +0.0033%, meaning longs are paying to hold positions, while the price has barely moved over 24h (-0.05%). This shows longs are crowded but unable to push the price higher, a typical “longs pay, shorts collect rent” setup. Any pullback could easily trigger a cascade of long stop-losses and liquidations. Technicals point the same way: MA5=80568 has fallen below MA20=80592.5, RSI=41.3 is in the weak zone, and the MACD histogram at -3.343 remains bearish. The price is nea
post-image
BTC-0.10%
AVAX+0.33%
AAVE+0.20%
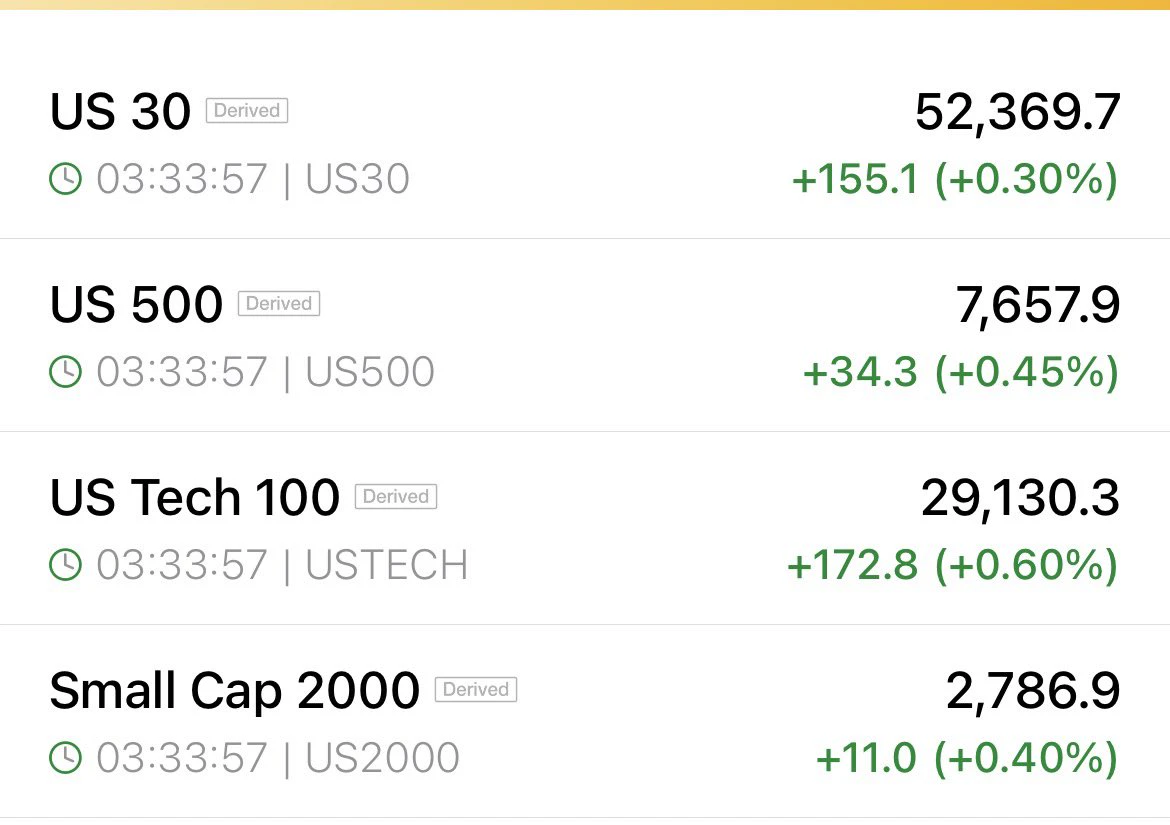
Breaking : Futures open green
Nasdaq 100 up +.60%
Oil dropped -1.72%
post-image
NAS100+0.48%
Load More

Join 40 M users in our growing community

⚡️ Join 40 M users in the crypto craze discussion

💬 Engage with your favorite top creators

👍 See what interests you

Trending Topics

USEarningsSeason

106.47k Views3.54k Discussing

The U.S. Q3 earnings season is in full swing, with major tech companies including Tesla and Meta reporting results. Market focus is shifting beyond revenue and profit toward AI spending, capital expenditure, margins and forward guidance. Which company’s earnings are you watching most closely?

GateWCTCS9GlobalTradingCompetition

742.79k Views8.12k Discussing

USConsumerSentimentNearRecordLow

13.43k Views308 Discussing

View More