Square
Following
Hot
News
Profile
Share your thoughts
placeholder
Article
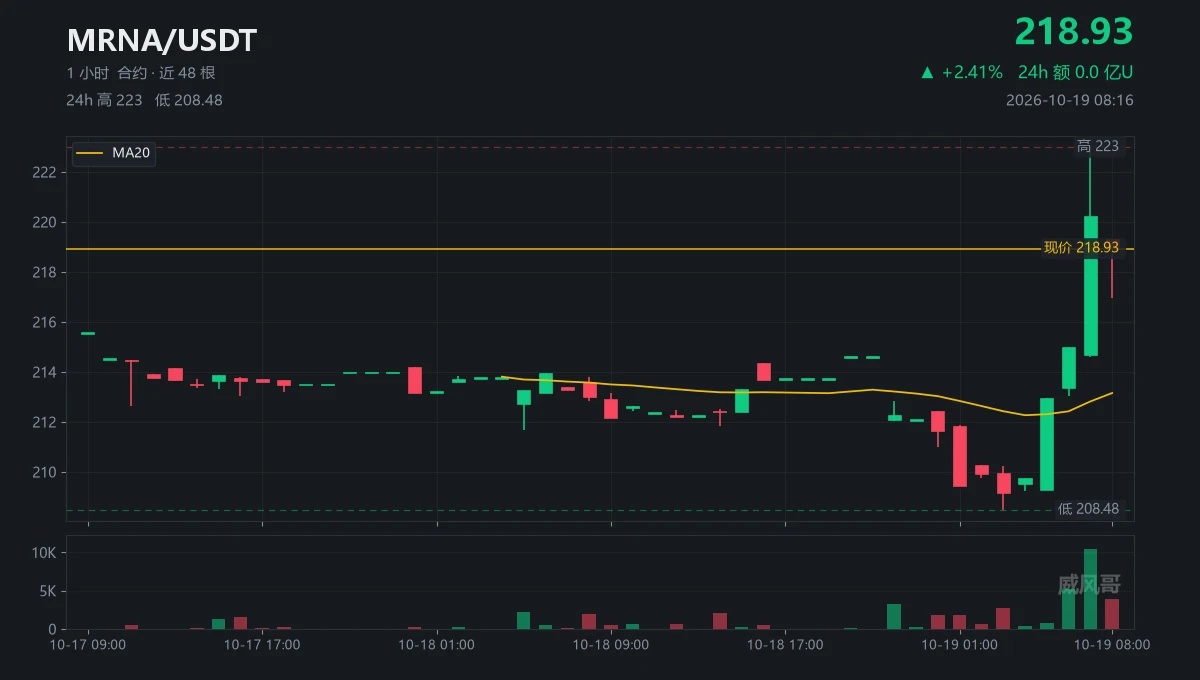
Don’t rush to chase.
Left: 03:00 a.m., 208.48
Right: four hours later, 223
Middle: now, 218.93
The same $MRNA , with just $77k traded in 24 hours
With liquidity this thin, even a slightly larger order can draw upper and lower wicks
Scenario one: hold above 220.22 and take out 223, and the weekend range will have finally broken to the upside
Scenario two: fall back below 216.94, and it’ll have to revisit that wick at 208.48
I’m not guessing which way it goes (those with no position are the freest)
Of the 14.52 points from 208.48 to 223, half were drawn by wicks
Whoever moves first is wrong; I’ll
post-image
MRNA+1.84%
  • 1
Include an image: 1987.10.19 Dow Jones down 22.6% in one day.
Today marks the 39th anniversary. Before the market opens, watch oil prices and yields, not the calendar. Not investment advice.
post-image
Trenches
TSI
T
bade
b
TSI
0xa8...1c1e
Market Cap
$.
Change
.
24h Vol
$.
Holders
.
CNPY
C
bade
b
CNPY
0xc6...ddd2
Market Cap
$.
Change
.
24h Vol
$.
Holders
.
AGT
A
bade
b
AGT
0x5d...e274
Market Cap
$.
Change
.
24h Vol
$.
Holders
.
BOOMER
B
bade
b
BOOMER
0x5a...5c00
Market Cap
$.
Change
.
24h Vol
$.
Holders
.
CLAUDIA
C
bade
b
CLAUDIA
0xd5...5261
Market Cap
$.
Change
.
24h Vol
$.
Holders
.
🔹 A new perspective on AI-driven fraud prevention: Actively allowing oneself to be scammed in order
live-cover
LIVE2,297
10.19 Morning Analysis$BTC ‌
On the four-hour Bitcoin chart, price stabilized near the lows after an earlier deep decline. A single solid-bodied bullish candle rallied sharply from the lower Bollinger Band support zone, and the short-term price broke above EMA15 resistance, forming an initial bullish recovery structure. The medium- and long-term EMA30, EMA60, and EMA90 averages remain densely clustered overhead. However, as price stabilizes and rebounds, overhead pressure is gradually being absorbed. A breakout on increased volume would open up further upside. Overall, the indicators show sig
post-image
BTC+1.10%
#BitcoinTops$82K
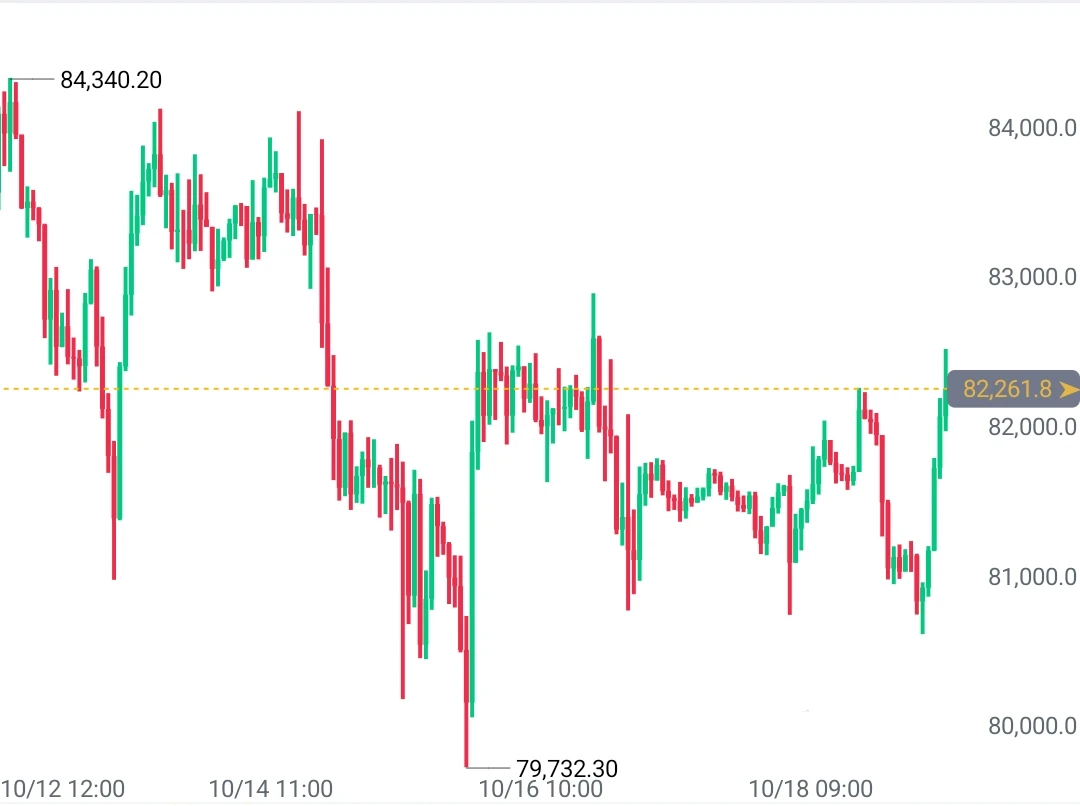
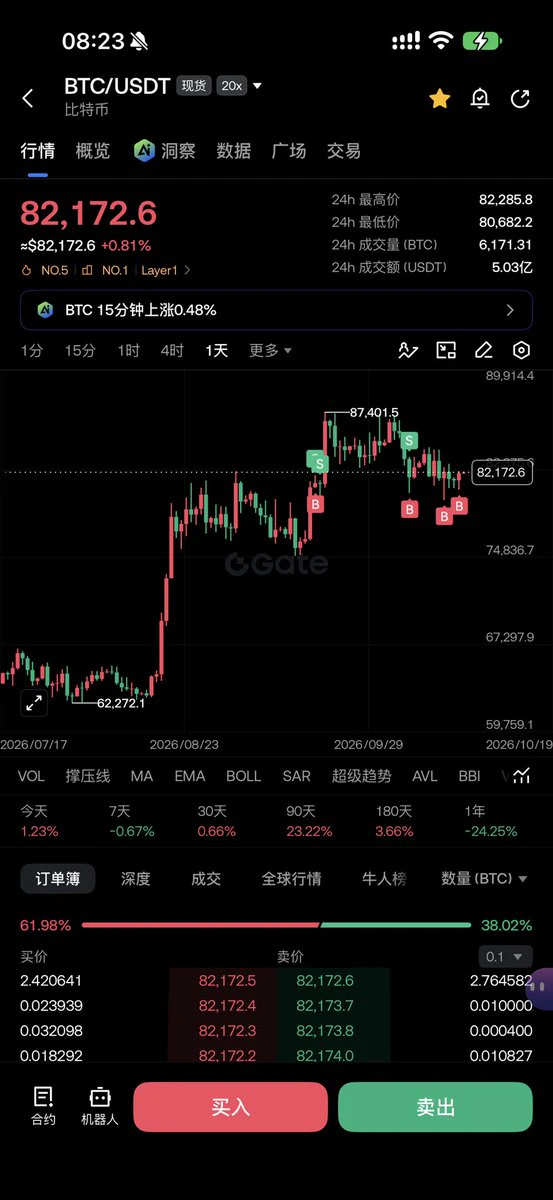
Bitcoin is trading around the $82,000 area, but it is not comfortably above it. It fell to about $80,000 on October 15 after hot CPI and PPI data, then rallied sharply on October 17. Treat the level as a zone, not a settled breakout. Here is the post in English, with no hashtags, no stars, no tables or charts, and no banned terms.
Bitcoin Price Analysis for Monday, October 19, 2026: Can BTC Hold Above $82,000?
Bitcoin has been the center of attention this month, and the reason is simple. After weeks of trying to climb back toward the upper $80,000s, BTC has been pushed and pu
BTC+1.10%
  • 5
  • 1
Volume is rising, and prices are starting to move up. 📈 This could be a positive signal for a potential recovery, but watch the momentum! 🚀
post-image
Walk slowly
The confidence that comes from clearly visible results. $BTC $ETH #美国9月PPI大超预期
BTC+1.10%
ETH+0.73%
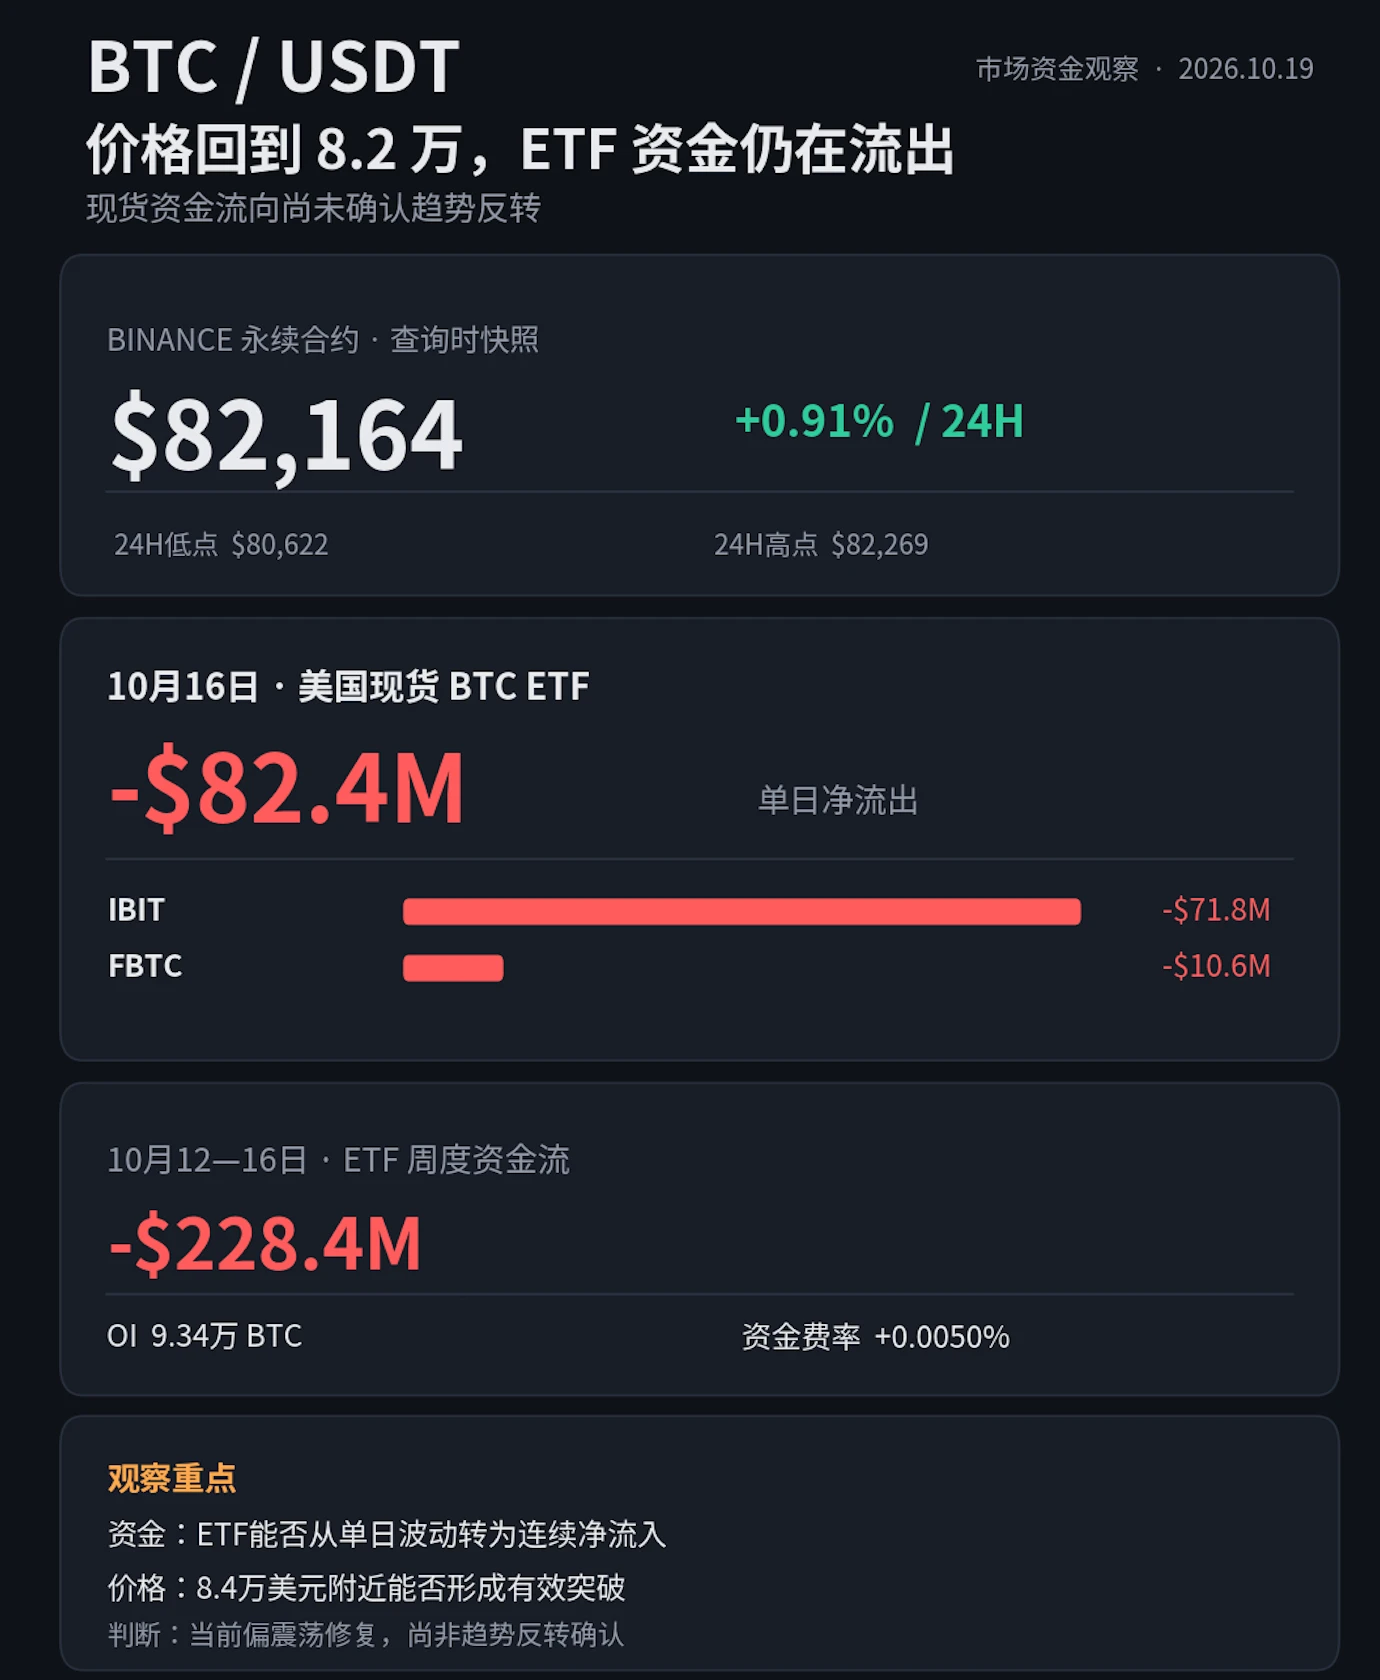
$BTC Rebounds to $82,000, ETF outflows continue, and the short-term rebound still lacks confirmation from capital flows
BTC climbed back above $82,000 today, but it is still too early to confirm that the downtrend has ended.
📊 Latest futures market data:
BTC price: $82,164
24H change: +0.91%
24H low: $80,622
24H trading volume: approximately $8.016 billion
Futures open interest (OI): approximately 93,400 BTC
Funding rate: +0.004958%
The price has rebounded, while the funding rate remains slightly positive, indicating some recovery in bullish sentiment. But current OI and funding rates alone a
post-image
BTC+1.10%
ETH+0.76%
GT-0.49%
  • 4
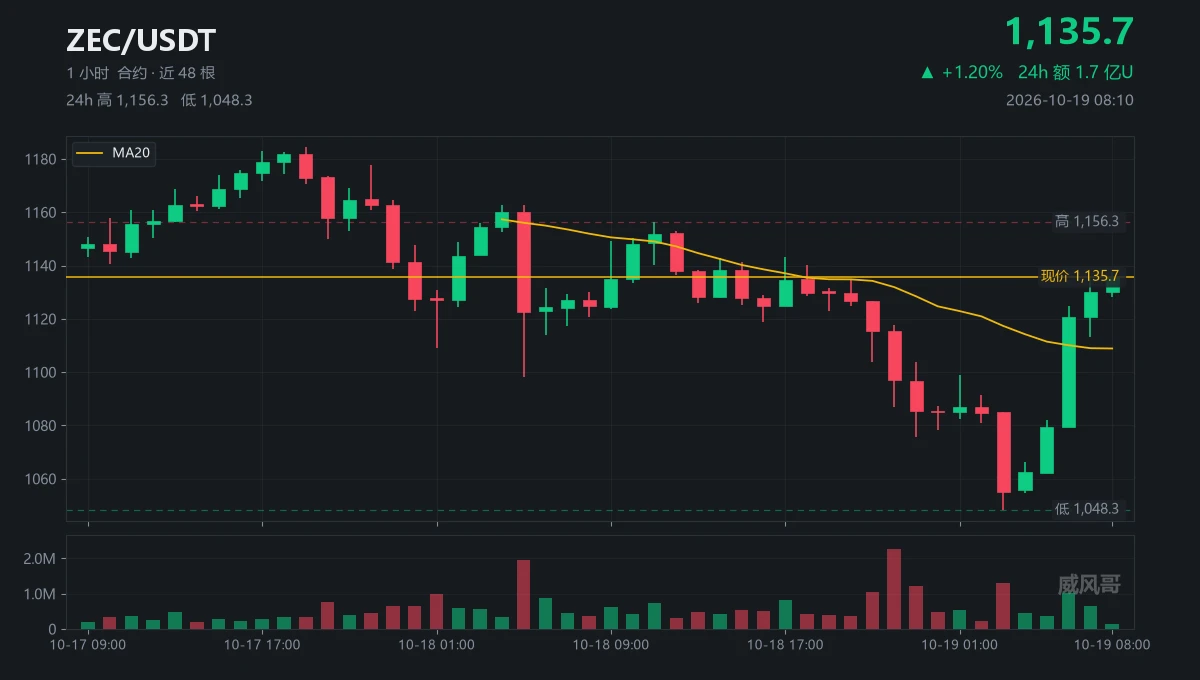
Someone asked in my comments: After this wick, is it about to turn bullish?
I replied: First, look at how fast it moves (almost unbelievably fast).
At 03:00, it plunged to 1048.31, and the chat was eerily quiet then
At 04:00, that 4-hour candle shot straight from 1055.62 to 1129.99
One candle, up 7.05%, erased all the losses from the previous ten hours
$ZEC Now at 1135.69, above the 20-hour moving average
1184.51 is still overhead resistance, 4.30% higher
1048.31 below was just pierced overnight, 7.69% lower
By that math, the risk-reward ratio is 0.56 to 1 (I checked with a calculator, not by
post-image
ZEC+2.18%
Musk: The only solution to the US debt crisis is AI and robots. Choose any topic to start a live st
live-cover
LIVE2,366
Bitcoin has staged a clear short-term rebound, and buying pressure is recovering, but it is still too early to conclude that a new uptrend has formed.
The most important short-term level is whether Bitcoin can break above $82,295 decisively. If it breaks through and holds above $82,940, while spot trading volume continues to strengthen, confidence in the rebound’s continuation will increase. If the breakout fails and the price falls below $81,300, watch for a retest of $80,684.
The key medium-term question is whether institutional funds will start flowing back in. Continued net outflows from E
post-image
BTC+1.10%
#KOSPIJumps3.3% #ShareWeekly
KOSPI’s Sharp Rebound: Semiconductor Stocks Recover, but Is the Market Ready for a Sustainable Rally?
South Korea’s stock market has delivered a powerful reminder of how quickly investor sentiment can change. After the KOSPI plunged 7.6% on October 15, 2026, falling to approximately 5,554 points and triggering a circuit breaker, the index rebounded by more than 3% on October 16, reaching around 5,745 points during the session.
The recovery has brought fresh optimism, but I believe investors should remain cautious. The central question is whether this rebound repre
SK Hynix-2.83%
NVDA-1.42%
JPN225+1.69%
NAS100+1.07%
  • 1
Bad-Boy Watch: CL Crude Oil 10.19
At the start of the new week, crude oil is still the first thing to watch. CL’s candlestick chart shows gains slowing, with a likely pullback to the 5- and 10-day moving averages.
The 4-hour chart shows no MACD divergence yet, so the uptrend has support.
Looking at the external environment, the U.S. should be taking some action by now, right?
Let’s see if there’ll be another pullback today, with a chance to get near 95.
A pullback in CL would also create an opportunity for a rebound in U.S. stocks. Those holding relatively large positions should trim them a bi
CL-1.05%
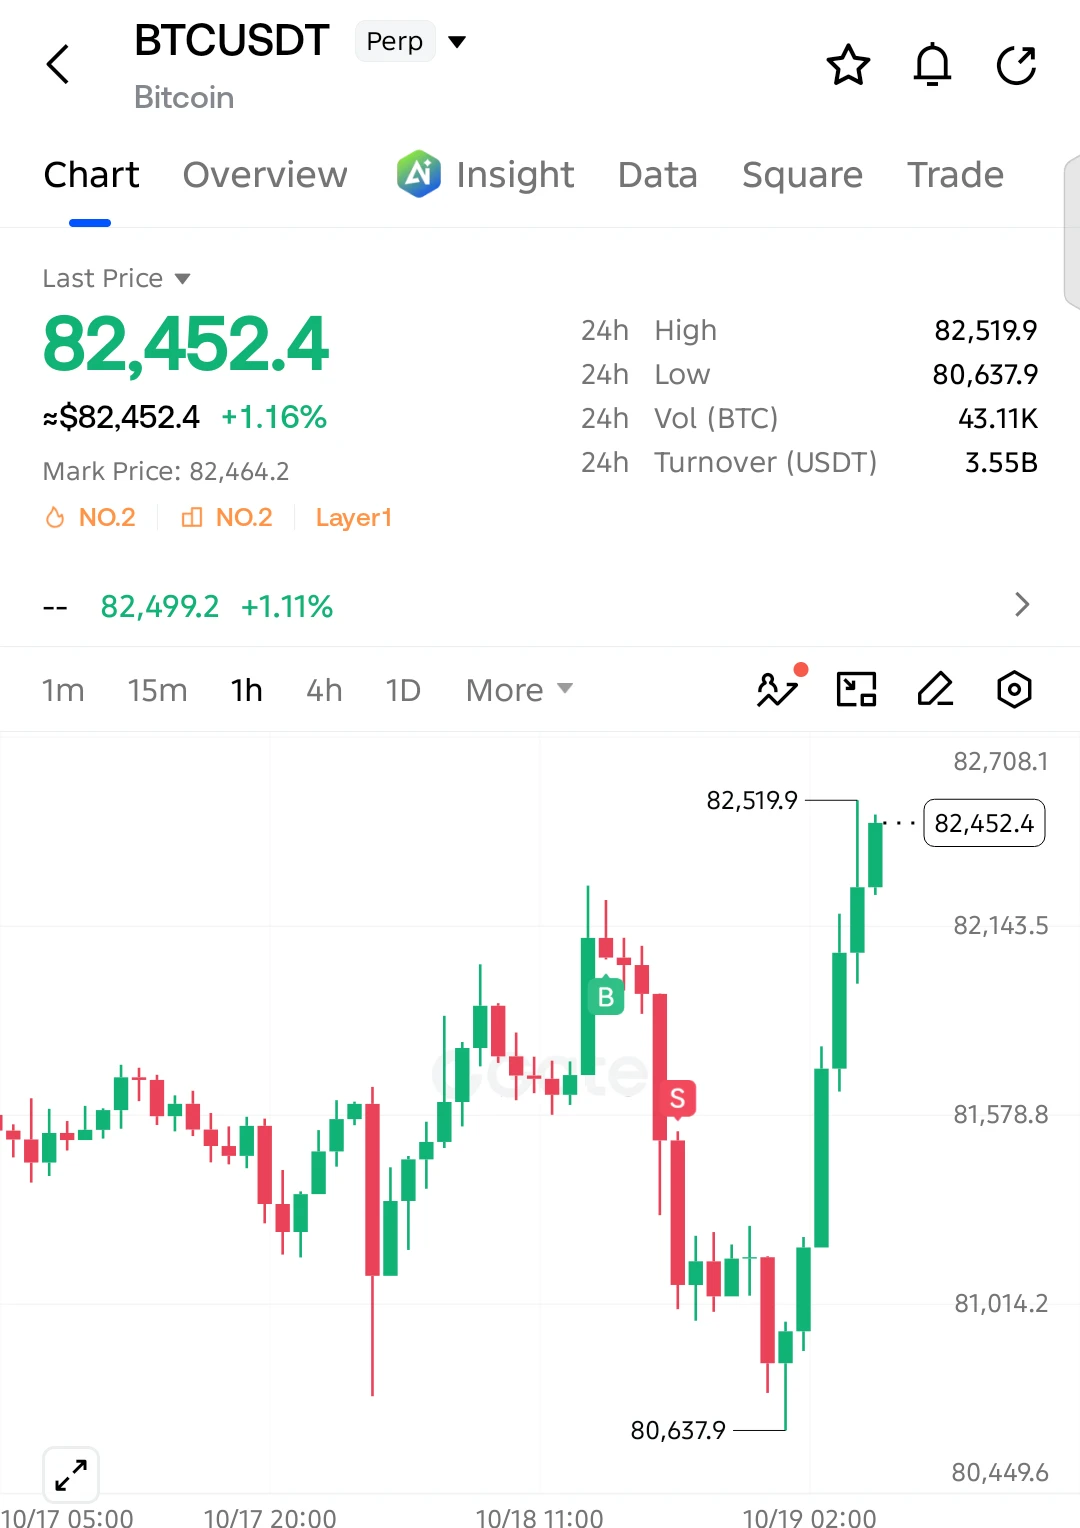
$BTC LONG SETUP 🚀
Entry: 82,100 – 82,250
SL: 81,750
TP1: 82,520
TP2: 82,850
TP3: 83,200
Strong 1H recovery. Watch for a pullback and support confirmation.
post-image
BTC+1.10%
  • 3
  • 1
What's about to happen this year is going to be incredible #BitcoinTops$82K #WarshIMFSpeech #GateBTCAndETHFuturesVolumeRanksTop3
While a woman is pregnant, no one—not even a court—is allowed to grant a divorce.
Unless there’s one situation where the law doesn’t protect the woman: the child she gives birth to isn’t her husband’s 🫣
post-image
🌐 ONEA NETWORK — Digital assets need to find their place in real life.
Digital assets bring new possibilities for people to store, transfer, and exchange value.
But one important question remains:
How can digital assets truly become part of everyday economic activity?
A technology becomes more meaningful when it can help people solve real-world problems.
Payments, online commerce, digital services, the creator economy, and global communities are all areas where digital infrastructure could create real value.
🔗 More than just holding assets
The future of digital assets should not be measured
post-image
If the Wright brothers were Elon Musk.
post-image
Currently, $BTC ’s weekly K-line structure looks very similar to that in March 2022.
A confirmation candlestick for a false breakout is still missing. For now, we can only make a blind bet on either direction, with a higher probability of a move downward.
post-image
BTC+1.10%
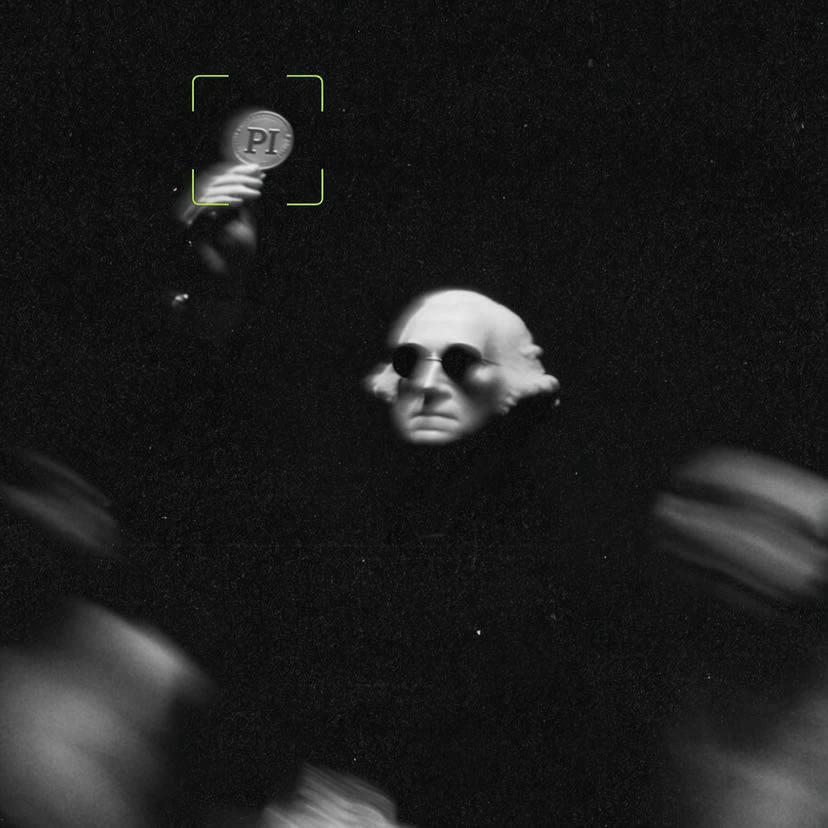
They are laughing, we're studying. They are selling, we're accumulating. They are doubting, we're persevering.
And then they turn around and say this is luck?! 🤣🔥 $PI ‌
post-image
PI-0.05%
  • 6
Load More

Join 40 M users in our growing community

⚡️ Join 40 M users in the crypto craze discussion

💬 Engage with your favorite top creators

👍 See what interests you

Trending Topics

USSeptemberPPIBeatsExpectations

91.35k Views1.94k Discussing

US September PPI came in at 6.3% YoY, well above the 5.3% market expectation, pointing to renewed producer-side inflation pressure. Weekly jobless claims were 199K, broadly in line with forecasts. Could hotter inflation further reduce room for rate cuts, and what does it mean for $BTC, US stocks, and gold?

GateWCTCS9GlobalTradingCompetition

37.87k Views6.86k Discussing

GateBTCAndETHFuturesVolumeRanksTop3

53.8k Views1.96k Discussing
View More