Square
Following
Hot
News
Notifications
Profile
Share your thoughts
placeholder
Article
What is statistical arbitrage? How can historical relationships between assets be used to identify trading opportunities, and why might historical correlations suddenly break down?

In the cryptocurrency market, some assets have long exhibited similar price movements. When their historical relationship temporarily deviates, traders may try to exploit the discrepancy. This is the basic idea behind statistical arbitrage, but historical patterns do not guarantee that they will repeat.

First, what is statistical arbitrage?

Statistical arbitrage is a type of trading strategy that uses historical
post-image
Right-side opportunities are rare—you may not see one even a few times in a week. You have to wait for a breakout before entering, and then use protection.

With left-side trades, you must never get greedy; they’re all short-term. But 80%-90% of the market is range-bound, so there are plenty of opportunities. As long as you maintain a certain win rate and identify the right entry points, you can still achieve great results through compounding.

In other words, capture opportunities on both higher and lower timeframes[阴险]
post-image
Trenches
fxUSD
f
bade
b
fxUSD
0x08...d8f6
Market Cap
$.
Change
.
24h Vol
$.
Holders
.
ZIG
Z
bade
b
ZIG
0x8c...1145
Market Cap
$.
Change
.
24h Vol
$.
Holders
.
BTC
B
bade
b
BTC
C5xp...pump
Market Cap
$.
Change
.
24h Vol
$.
Holders
.
CORLA
C
bade
b
CORLA
0xba...7777
Market Cap
$.
Change
.
24h Vol
$.
Holders
.
STONK
S
bade
b
STONK
6GmA...UNgx
Market Cap
$.
Change
.
24h Vol
$.
Holders
.
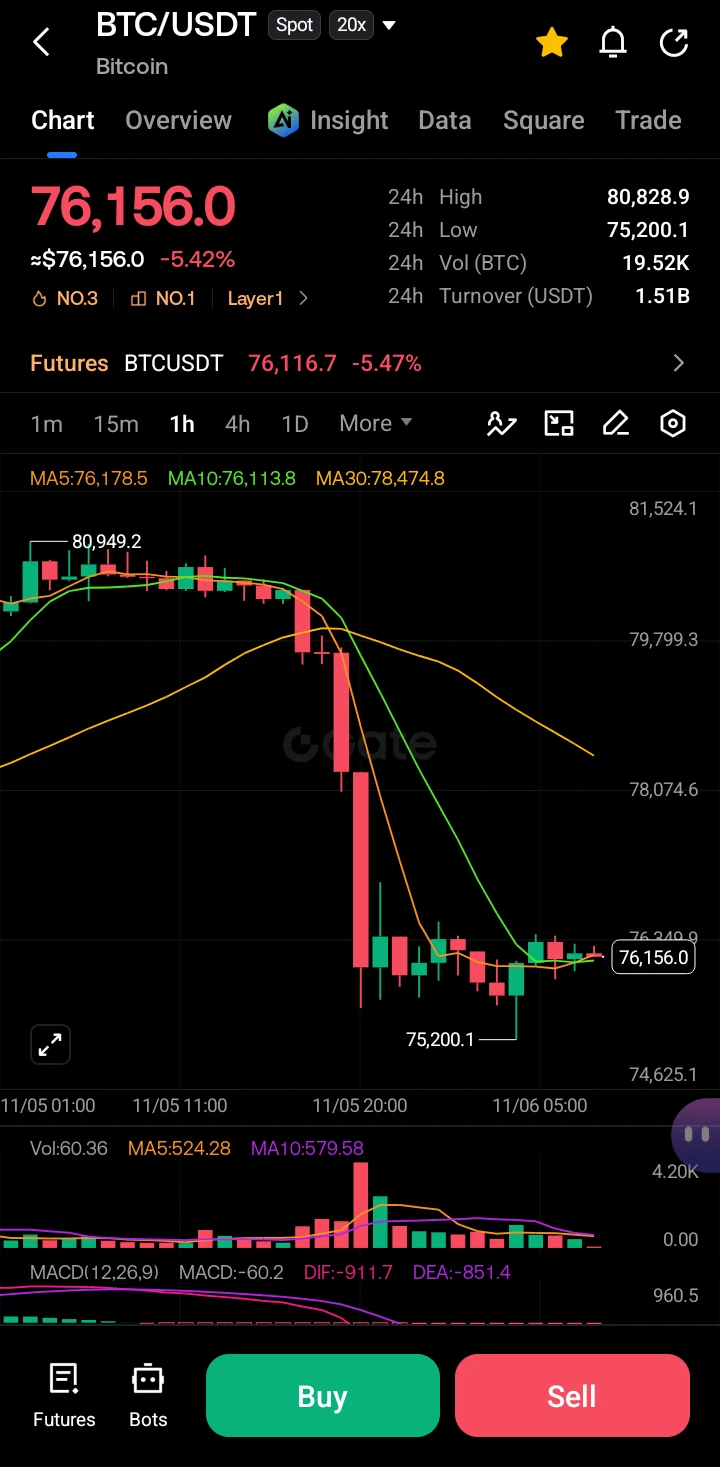
$BTC ‌
Overview and Macro Structure
Bitcoin is currently exhibiting a pronounced bearish structure on the intraday charts. Following a rejection near the 80,949.2 local high, the asset has undergone a significant distribution phase, culminating in a sharp impulsive move to the downside. The current spot price sits at 76,156.0, reflecting a 5.42% daily decline. This price action invalidates the prior bullish consolidation and shifts the immediate market bias firmly to the downside.

Moving Average Analysis.

The technical indicators confirm the bearish momentum. The price is trading well below
post-image
BTC-0.67%
  • 5
#ETH跌5.5% #WCTCS9 This Ethereum drop was first driven by pressure from U.S. stocks and macro factors, then compounded by ETH-specific capital flows. ETH fell harder than Bitcoin, indicating heavier selling pressure of its own.

U.S. stocks and macro factors are the main causes
Rate hike expectations rise: The probability of a rate hike in December climbed to around 75%, reducing the appeal of non-yielding coins.
Tech stocks lead the decline: Confidence in the AI narrative wavered, risk capital pulled back, and the crypto market was sold off in turn.
GDP comes in strong: U.S. GDP grew 3.4% in t
post-image
ETH-1.26%
  • 2
  • 1
11.06 BTC Market Analysis

Short: 76500-77000 area, stop loss at 77300, targets 75600/75000.

BTC is currently at 76120. Although the market rebounded after dipping to 75184, it remains in a weak recovery phase following a sharp drop, with the moving averages aligned bearishly overhead and providing clear resistance.

The 76500-77000 range is not only a secondary consolidation platform along the previous decline, but also a key zone of short-term moving average resistance. In a broadly bearish environment, these technical rebounds often present opportunities to short at higher levels.
Wait for
post-image
BTC-0.65%
When can I own a coin like this?@elonmusk
post-image
11.6 Market Trend Analysis

ETH Strategy Reference Setup
Rebound zone: short around 2250--2270
Stop loss: 2310
First target: 2200, second target: 2150

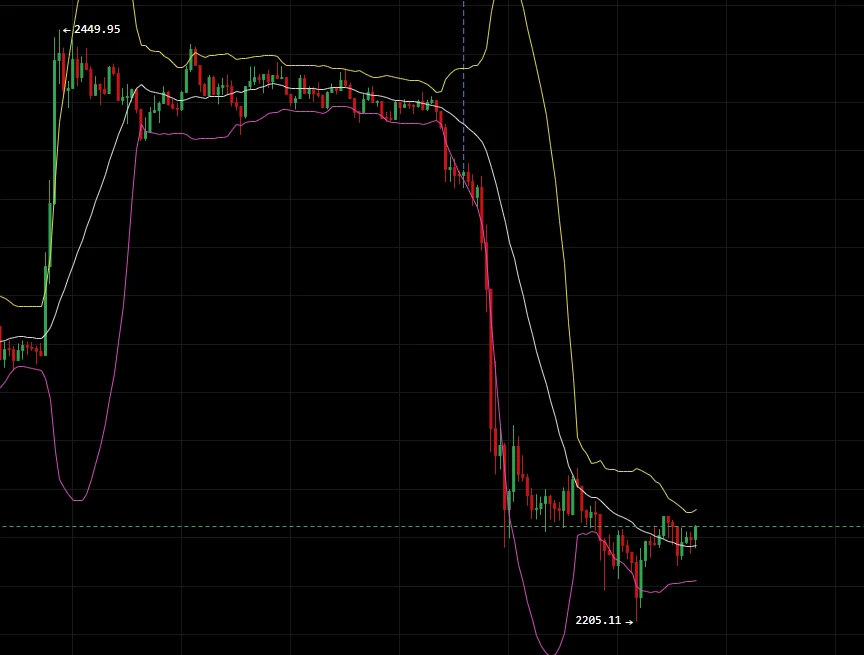
Dream of a surge shattered! A wave of heavy-volume selling directly reversed the short-term trend.

On the one-hour chart, after reaching a high of 2449.95, the market came under pressure and plunged. Heavy-volume long bearish candles successively broke through layers of key support, with the low reaching 2205.11 and the current price at 2238.32.
The previous bullish structure has been completely broken, with bearish selling pressure released i
post-image
BTC-0.65%
ETH-1.23%
#CLARITYActCouldBeDelayedUntil2028 #CLARITYAct The CLARITY Act Just Ran Out of Calendar: Why 2028 Is No Longer a Stretch
The bill that was supposed to give crypto a federal rulebook has now lost its easiest path. Democrats swept both chambers of Congress in the 2026 midterms, the Senate cloture vote failed 49 to 50 in September, and the current Congress ends on 3 January 2027. Analysts at TD Cowen say the bill could slip by as much as two years, and prediction markets now price passage before 2028 at roughly one in four.

What happened and what the numbers say

The House passed the Digital Ass
KALSHI+0.00%
BTC-0.67%
TOKEN-0.16%
GENIUS+1.22%
  • 5
  • 1
🧭 Day Two Summary: Building Your Own Web3 Risk Assessment Framework—from Understanding Mechanisms to Taking Action

Over the past six articles, we started with a specific question: Why might digital assets be restricted?

We then discussed step by step how to verify information using a blockchain explorer, understand blacklist and whitelist mechanisms in contracts, determine why a transaction failed, analyze administrator privileges and upgradeable contracts, and identify what ordinary users should check before taking on-chain actions.

Today, we bring these insights together.

Because what t
post-image
🔹Why Did U.S. Stocks Suddenly Plunge at the Open? Sell Orders Flood In While Buyers Struggle to Kee
live-cover
LIVE2,526
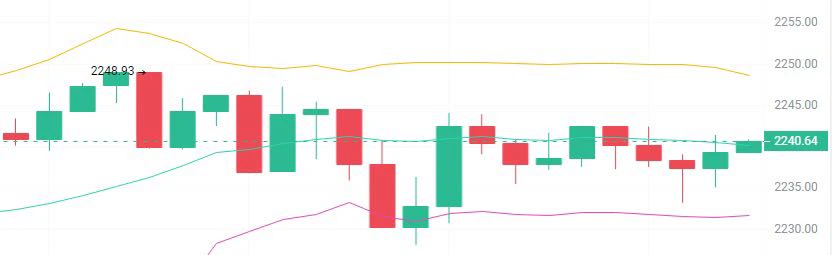
ETH Strategy This Morning

Trade:
Short around 2250-2270
First target: 2230-2210
Second target: 2190-2160
Use a stop-loss

ETH is in a downtrend, and the current move is only a weak recovery after a sharp drop. The rebound is meeting resistance at the middle band, while the weak MACD golden cross signals a continuation of the downtrend. The strategy is to firmly avoid chasing the drop and wait for a failed rebound, with gains stalling and a bearish close, before testing a short position with light size. Targets are the lower band and the previous low; keep the stop strictly above the previous
post-image
ETH-1.23%
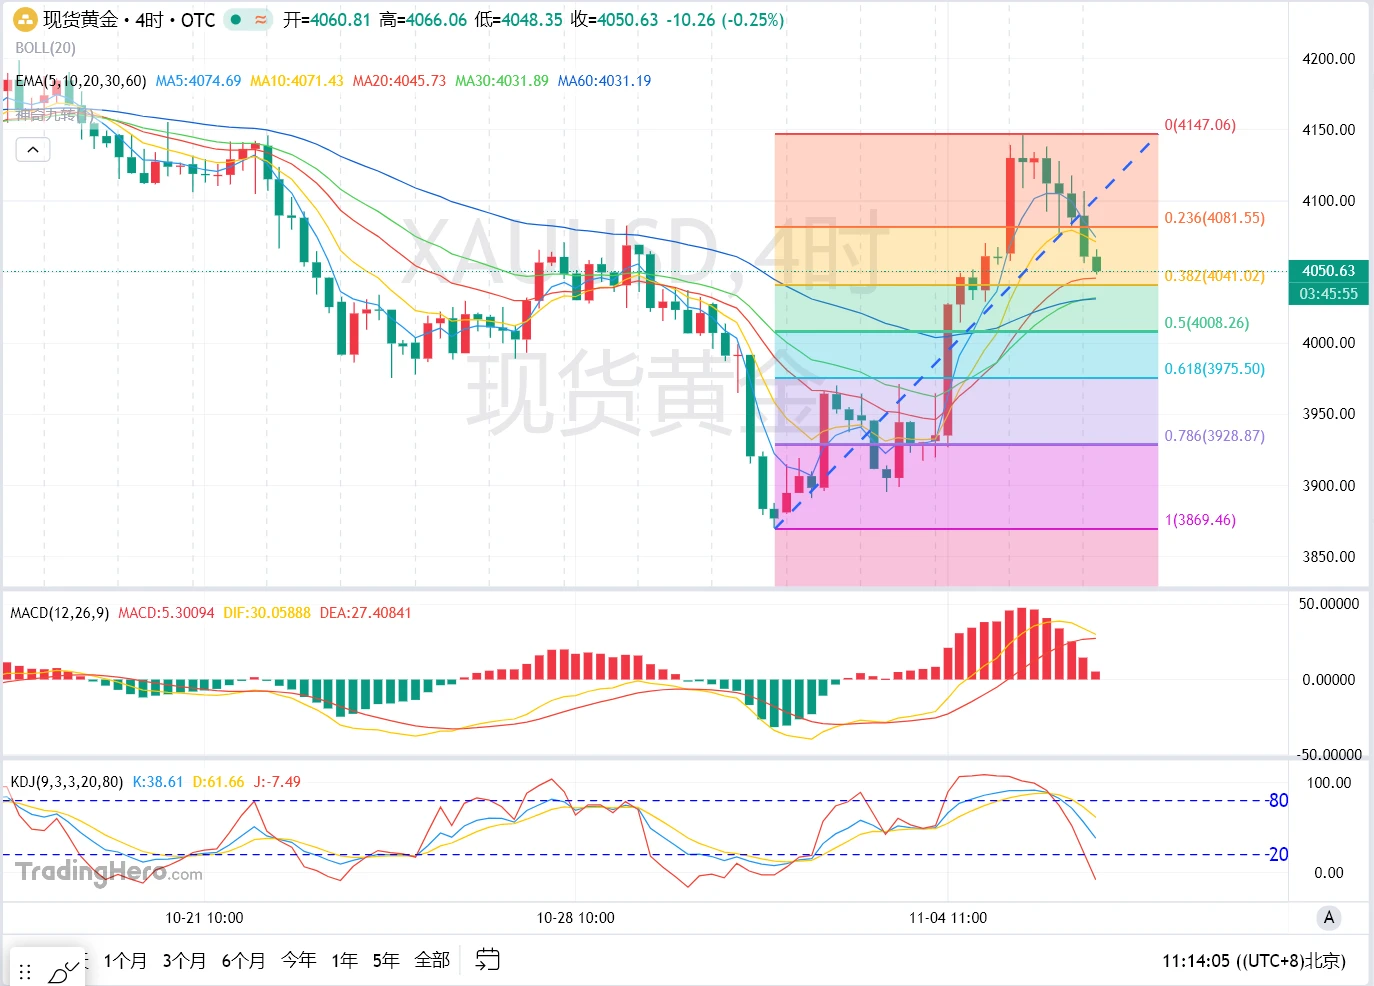
November 6: Gold enters a correction, pulling back sharply overnight

Yesterday, gold surged rapidly during the Asian session, with prices climbing to around $4,146. It then began to fluctuate lower during the European session, with the decline accelerating from session to session. Gold closed near $4,088. After opening slightly lower during today’s Asian session, prices continued yesterday’s weak trend, moving further down to test the $4,048 area.

The market logic has not changed, but the focus has shifted. With the midterm election results settled, expectations of a “blue wave” have been fu
post-image
XAUUSD-1.12%
NEW STREAMER(Market Update)
live-cover
LIVE1,574
What Is Statistical Arbitrage? How Can Historical Relationships Between Assets Reveal Trading Opportunities, and Why Might Historical Correlations Suddenly Break Down?

In the crypto market, some assets have long displayed similar price movements. When their historical relationship temporarily deviates, traders may try to use that divergence to identify opportunities. This is the basic idea behind statistical arbitrage, but historical patterns are no guarantee of future repetition.

First, what is statistical arbitrage?

Statistical arbitrage is a type of trading strategy that uses historical
post-image
#AsiaPacificStocksPlunge

Today is Friday and here we see Asia Pacific Stocks affected by American market crash , $SKHYNIX down and dropped almost $800 dollar ! This is really big happens … Now all market needs to recover !
post-image
SKHYNIX+1.41%
Trump personally responds to the US stock market plunge: He says he didn’t cause it. Who could have imagined Wall Street would lose $3.2 trillion in a single day!

Facing widespread criticism, Trump directly fired back: “Remember, we didn’t do this.”

Some have calculated that this is roughly equivalent to wiping out one-sixth of the A-share market. The American people chose this themselves. Such a massive loss in market capitalization will inevitably spill over, and global markets are watching nervously. #美股史诗级抛售

Is this the start of a new downturn, or a release of sentiment before a bull m
post-image
  • 1
$AKE Take enough profit for a pork trotter rice meal and get out, then keep shorting
post-image
AKE+6.07%
  • 4
#USStocksFaceHistoricSelloff
Wall Street just lived through one of its ugliest sessions in years.
On Thursday, November 5, 2026, the U.S. stock market suffered a brutal, broad-based selloff that erased the previous day’s strong post-midterm rally and then some. The S&P 500 plunged 4.4% — its worst single-day drop since the “Liberation Day” tariff shock in April 2025. The Dow Jones Industrial Average sank 1,833 points, or 3.4%. The Nasdaq Composite cratered 5.5% and officially entered correction territory, closing more than 10% below its October 6 record high.

The damage was concentrated in t
SPX500+0.19%
US30+0.38%
INDEX+0.00%
NVDA-9.33%
AMD-17.64%
  • 5
Nasdaq 100 Falls 6% | U.S. Stock Market Analysis: Election results are in—does AI’s tab need to be recalculated? Last night wasn’t an ordinary sell-off; politics knocked the anchor out from under AI valuations. The Dow closed at 51,523, down 3.44%; the S&P 500 closed at 7,353, down 4.36%; and the Nasdaq closed at 24,315, down 5.52%, retreating more than 10% from its October high and officially entering correction territory. The Nasdaq 100 lost $2.3 trillion to $2.4 trillion in market value in a single day, while the Philadelphia Semiconductor Index plunged 12.25%, its biggest one-day drop sinc
post-image
KORU-1.22%
SOXL-1.16%
SKHYNIX+1.41%
Load More

Join 40 M users in our growing community

⚡️ Join 40 M users in the crypto craze discussion

💬 Engage with your favorite top creators

👍 See what interests you

Trending Topics

USStocksFaceHistoricSelloff

586 Views3.47k Discussing

U.S. stocks suffered a sharp selloff on Thursday, with the Nasdaq closing down more than 5% and the Philadelphia Semiconductor Index falling over 12%. AI and chip stocks including $NVDA and $AMD were hit especially hard. Markets are reassessing AI valuations, data-center spending and future returns. Is this just short-term deleveraging, or the start of a deeper correction in the AI trade? Which sectors are you watching next?

GateLaunchesPoSECProofOfSecurity

11.51k Views569 Discussing

USNonfarmPayrolls

8.95k Views3.98k Discussing

View More