Square
Following
Hot
News
Notifications
Profile
Share your thoughts
placeholder
Article
gate expands its partnership with openpayd, adding gbp account and eur sepa capabilities to more of its operations. the integration strengthens fiat payments and fund management across gate money’s digital asset, equities, and payment services.
$GATE $OPENPAYD #FINTECH
post-image
I changed my mind. I used to believe the saying, “After a drop this deep, the bottom can’t be far away.” $MMT Today’s low was 0.2113, down from 0.2783, a 16.65% drop, with turnover still at 162.4M. That’s not a small figure. It shows buyers are stepping in, but getting buried one batch at a time.
A deep drop doesn’t mean it’s the bottom; it only means sellers are still on the move. What really matters isn’t how much it’s fallen, but whether volume contracts after the drop and the price holds steady in a certain range. This move looks more like the car is still going downhill, with no brake lig
MMT-2.35%
Trenches
FIONA
F
bade
b
FIONA
B34n...pump
Market Cap
$.
Change
.
24h Vol
$.
Holders
.
PIEVERSE
P
bade
b
PIEVERSE
0x0e...25a9
Market Cap
$.
Change
.
24h Vol
$.
Holders
.
IDOL
I
bade
b
IDOL
0x3b...ab07
Market Cap
$.
Change
.
24h Vol
$.
Holders
.
Singularity
S
bade
b
Singularity
7R4M...pump
Market Cap
$.
Change
.
24h Vol
$.
Holders
.
PUNANI
P
bade
b
PUNANI
2Tng...pump
Market Cap
$.
Change
.
24h Vol
$.
Holders
.
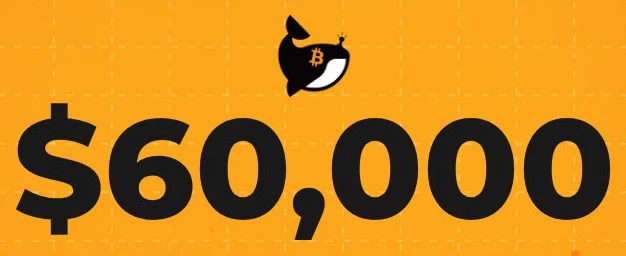
#BTCBreaksBelow60K

Bitcoin has once again entered a critical phase as BTC breaks below the $60,000 level, putting renewed pressure on the broader crypto market. The move below such a widely watched psychological and technical threshold is likely to attract significant attention from traders, investors, and market participants.

A break below $60K can signal that bearish momentum is strengthening, especially if Bitcoin remains below the level instead of quickly reclaiming it. Traders will now be watching price action closely to determine whether this is simply a temporary breakdown or the begi
post-image
BTC-0.65%
The 0.0% Pullback
📍 What if $SKYAI ‌ entry is already inside the demand zone?
Price: 0.03651. Demand zone: 0.03642–0.03657.
“Wait for a pullback” to where you’re standing.
Entry or déjà vu? 👇
$SKYAI ‌$ETH ‌
$MU ‌
SKYAI-7.69%
ETH-1.26%
MU-13.88%
The era of quietly making a fortune on prediction markets with insider information may be coming to an end.
Two U.S. lawmakers have introduced a new bill specifically targeting bets on prediction markets made using confidential information.
The rules directly cover major platforms such as Polymarket and Kalshi.
The bill would establish a whistleblower program at the Department of Justice, offering up to 30% of fines for actionable tips.
The reward money would come directly from the asset forfeiture fund, and anonymous submissions would be fully protected.
Guys, when betting on on-chain events,
post-image
KALSHI+0.00%
Go long at 4-hour support $QNT . Hold 141, next target 150. If it breaks below 136, I’ll abandon this idea. Rationale: - On the 4-hour timeframe, price is at 142; buyers need to defend this level to push the price higher. - The daily chart is above EMA200 (124), strengthening confidence in this trade setup. Long 141.3–142.0 Take profit 144.8 / 147.0 / 150.2 Stop loss 136.3 This is not investment advice; manage your position size yourself.
post-image
QNT+4.79%
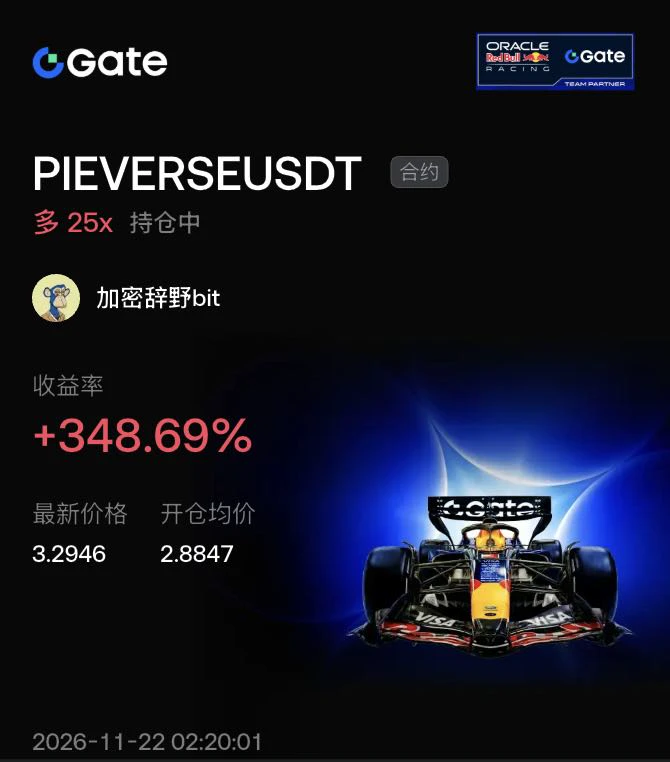
$PIEVERSE When trading, you have to learn to read resistance levels. Just below the previous high is where human nature is put to the test.

PIEVERSE has now reached around 3.29, with a solid ceiling at 3.63 above. Looking at the chart, the bulls are still pushing, but you can clearly feel their upward momentum fading. At a level like this, a double top or a false breakout can easily form.

I opened a long position around 2.88 earlier and rode it up to here. Facing this key resistance level, my strategy is simple: take profits in batches. I’ve already locked in 348% profit, and even if it brea
post-image
PIEVERSE+0.58%
BTC-0.65%
  • 2
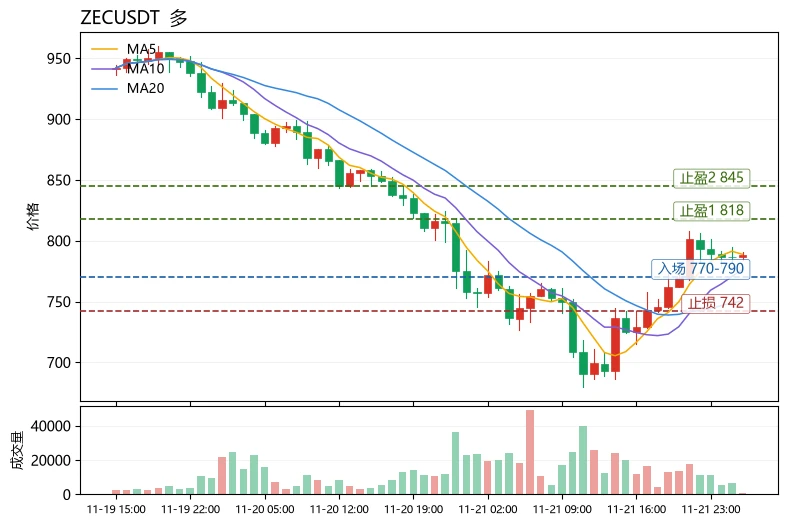
$ZEC Bottom line: Short-term bias is bullish, but this is a high-volatility long under extreme fear. Position size must be kept below half the usual amount, and the stop-loss is non-negotiable.

Volatility is the primary risk right now. The 30-candle range is 18.38%, with the Bollinger upper band at 818.585 and the lower band at 682.341. The exceptionally wide bands mean a single candle could hit the stop-losses of traders chasing highs. The Fear & Greed Index is just 12, in the extreme fear zone, yet the price is above MA5 (788.822) and MA20 (750.463); the MACD histogram remains bullish at +1
post-image
ZEC+1.29%
ENSO-2.90%
TRUMP-0.90%
The whole market is talking about the AI bubble about to burst, yet the giants keep pouring money in. Today’s new scoop: Amazon is reportedly ready to shell out $7.5 billion to acquire an AI startup called Decart, whose specialty is making models run faster and squeezing more out of chip compute.
Don’t dismiss this as just another high-stakes gamble. The destination of this money is telling: AWS wants to keep a firm grip on profits from compute and pay NVIDIA less in “tolls.”
So my view on NVIDIA’s latest drop hasn’t changed. It’s not that demand has collapsed, but that its moat is being breac
post-image
AMZN-3.90%
NVDA-13.84%
$TRB Possible reversal! The bulls are fighting back

Long trade plan

Entry: $12.25–$12.40
First target: $12.60
Second target: $12.90
Third target: $13.20
Stop loss: 11.85

TRB is making a strong recovery after rebounding from the 11.30–11.50 support zone. Buying momentum is returning, and a sustained break above $12.40 could push the price higher toward $13.20. Wait for confirmation before entering.

Buy and trade $TRB
post-image
TRB-2.27%
Finally, some movement. $XLM seems like it really wants to wake up from its nap. Take profit: 0.13478 Stop loss: 0.12439 Market movers: $ETH : Current price 1,683.33 - 24-hour change: +3.54%$SKYAI : Current price 0.03606 - 24-hour change: +29.85%
post-image
XLM-0.64%
SKYAI-7.58%
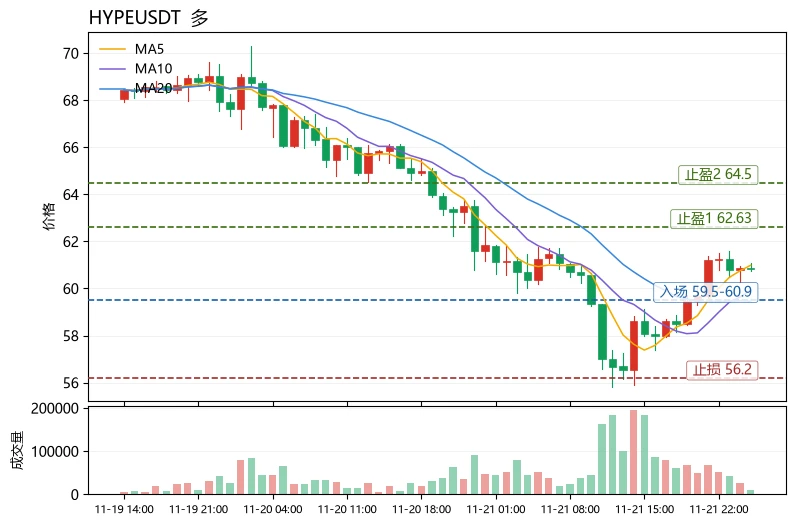
$HYPE Current price: 60.84. The first resistance overhead is the upper Bollinger Band at 62.63, while the first support below is MA20 at 59.46. The dividing line between bulls and bears lies between these two levels. I’m laying out the price levels first because this coin’s current structure is well suited to illustrating a reusable way to read charts: use moving average alignment to judge whether a trend is healthy.
First, the trend structure. MA5=60.98 remains above MA20=59.46, with the short-term moving average above the medium-term one—a nascent healthy bullish alignment. But the gap betw
post-image
HYPE+0.24%
DODO+11.43%
RENDER+0.47%
Market prediction
live-cover
LIVE242
BTC-0.67%
$PROM It has fallen to 4.36 five times, but has never broken below 4.3. If this coin breaks below 4.3, it will fall to 2. If it stabilizes here, it will soar to 5.5, 6, 6.5, 7.5, and 8.😎✋
post-image
PROM+0.45%
$BTC In that version, I wrote “outflows include basis-trade leg unwinds”; $ZEC this column is cleaner because it doesn’t have that leg.

ZCSH saw -46.25 million in October and another -54.69 million through November 18, with AUM shrinking to 497 million. The numbers look as bad as BTC’s, but the nature is opposite: no CME futures, no basis to lock in—these are pure one-way redemptions. The downside is nobody is there to hedge the buyback for me; the upside is that once unwound, it’s truly gone, unlike BTC, which still has to wait for basis positions to expire in batches.

The incremental com
BTC-0.65%
ZEC+1.29%
ETH-1.23%
  • 2
I haven't even had my coffee yet, and the timeline says Bitcoin is plunging hard $BTC
1. Bitcoin will have spent 11 months above $60,000
2. Ethereum will have spent 11 months above $1,500
3. And some coins are still far from their 2026 low
.. the lows haven't changed ..
And some coins have made a new low, 10% below the previous one
They still haven't had a sharp drop so far
post-image
BTC-0.67%
$BCH finally stopped acting like a dead battery and surged straight back to its intraday high. I think prices holding above those moving averages finally makes it feel like it's time to make a move. Glad to see some real action here for once, instead of the usual circus. Take profit: 207.59 Stop loss: 191.59 Notable: $SKYAI : Current price 0.03601 - 24-hour change: +29.35%$ETH : Current price 1,683.54 - 24-hour change: +2.73%
post-image
BCH+1.05%
SKYAI-7.58%
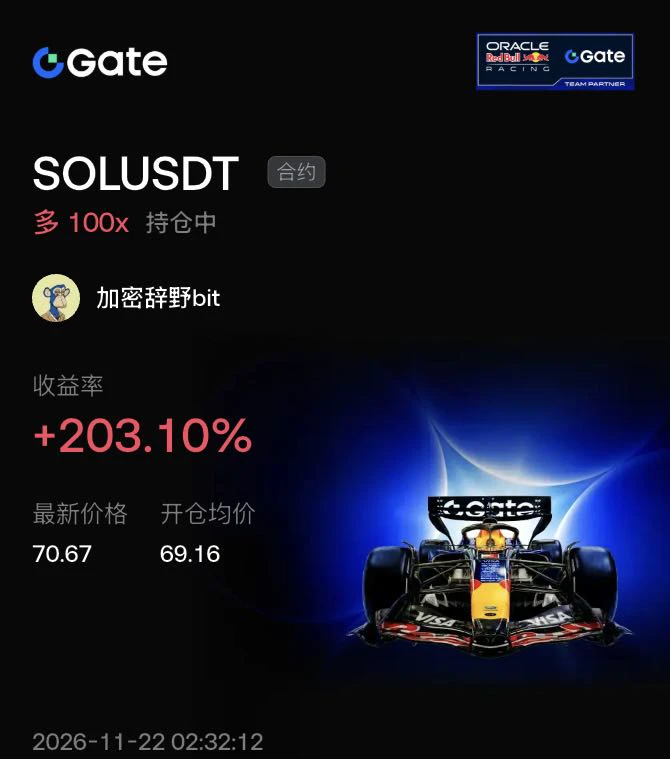
$SOL When trading, you must clearly understand the difference between higher and lower timeframes. The current rally in major coins after this sharp crash is basically just a brief recovery, so don’t mistake it for a reversal.

Look at this 1-hour chart: SOL plunged from 75 to 64.8—a brutal drop. After stabilizing at the bottom, it made a V-shaped rebound. I entered at 69, the right-side confirmation point, and went long with 100x leverage. I caught the profits from this sentiment-driven recovery, which pushed straight up to 70.67, netting 203%!

Why emphasize “brief recovery”? Because there’s
post-image
SOL-0.77%
BTC-0.65%
ETH-1.23%
  • 1
$EVAA The logic behind this rebound is very clear. I entered a 10x long position precisely at 4.1957, and the price climbed all the way to 6.2191, with unrealized gains exceeding 478%. A review of the chart: after stabilizing at the lows, trading volume expanded and the moving averages turned upward into a bullish alignment—a classic signal that a trend is taking off.

The chart shows strong bullish momentum, with the price continuing to rise without encountering significant selling pressure. 10x leverage amplified the gains, but the price has already risen substantially, and a pullback driven
post-image
EVAA-0.42%
BTC-0.65%
ETH-1.23%
Load More

Join 40 M users in our growing community

⚡️ Join 40 M users in the crypto craze discussion

💬 Engage with your favorite top creators

👍 See what interests you

Trending Topics

BTCBreaksBelow60K

2.1M Views29.9K Discussing

BTC fell below $60,000 on November 20 for the first time since July, alongside a tech stock selloff and broader pressure on risk assets. Will $60K become resistance, or can BTC quickly reclaim it? What price or volume signals would convince you that selling pressure is easing?

GateDirectIPOPhase3ANTAllocates92100Shares

786K Views4.9K Discussing

NvidiaDropsNearly14Percent

329.2K Views7.6K Discussing

View More