Share your thoughts
placeholder
Article
Everyone’s chasing the bounce, but the 4h chart is quietly screaming a different name for FLOCK.

$FLOCK /USDT - SHORT

Trade Plan:
Entry: 0.07219 – 0.07477
SL: 0.08583
TP1: 0.06422
TP2: 0.05805
TP3: 0.04878

Why this setup?
Why now? The 1D trend is *range*, not reversal—so this isn’t a breakout. RSI 15m at 42.51 shows weak hands, not accumulation. With ATR 1h at 0.0051, volatility is compressing right under the 0.0735 resistance. The primary setup targets 0.0642 (-12%) and 0.0580 (-21%), with invalidation only below 0.0497. The alt (long) path is armed but lower probability—this is a short
FLOCK+30.88%
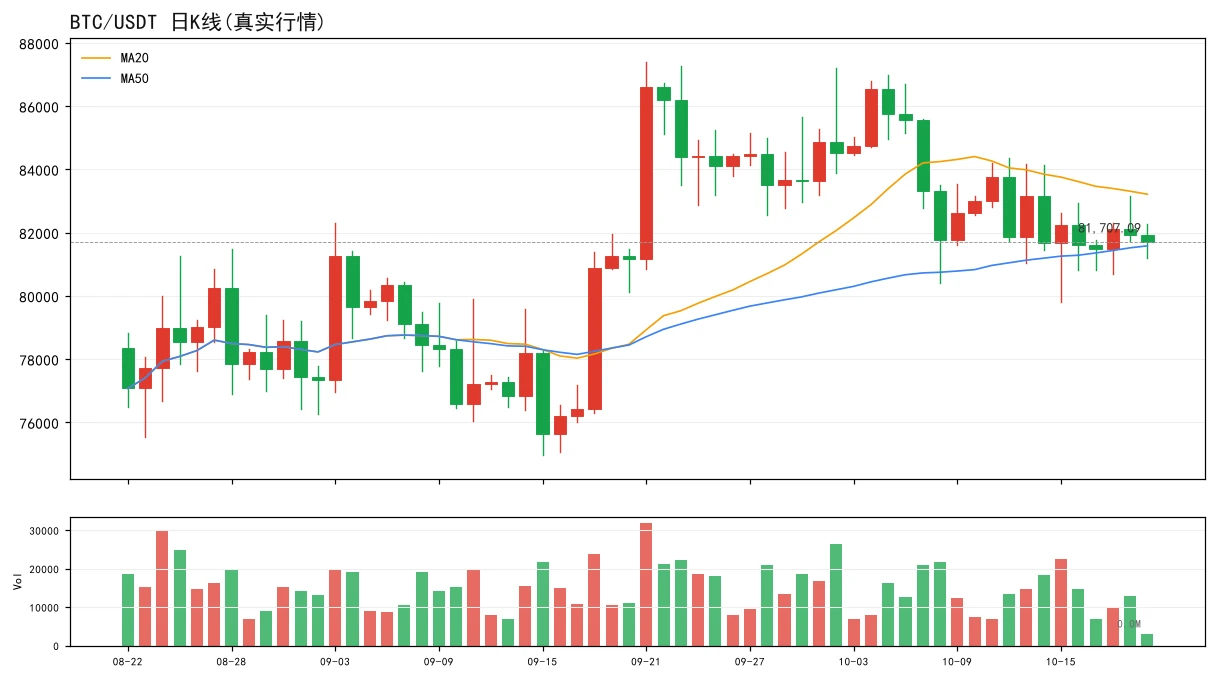
Everyone’s long BTC at 79.6K, but the 4h chart just whispered a secret nobody’s pricing in yet.

$BTC /USDT - SHORT

Trade Plan:
Entry: 79603.0 – 79707.2
SL: 80155.7
TP1: 79279.7
TP2: 79029.4
TP3: 78654.0

Why this setup?
Why now? The range-bound 1D trend is the tell—not a breakout.
- RSI 15m at 38.95 shows momentum already bleeding south.
- ATR 1h at 208 is tight; that’s a coiled spring, not a floor.
- Entry 79655 sits below the 4h pivot—price is rejecting, not absorbing.
Target TP2 at 79029 is a 0.8% drop, but the real move is the invalidation at 79194 acting as a magnet. Short bi
BTC-0.05%
Would you chase BTC at $80,000?
Look at the surface first: the rebound has reached its target, but the direction remains undecided.
BTC rose 25% from 63,000 to 80,000 in August. After surging to 82,280 on September 3, it pulled back and has traded in a narrow range of 79,400-80,200 for several consecutive days. September has historically averaged a 2.9% decline, while the probability of an FOMC rate hike has surged to 58%, making bulls nervous.
The price is 15% above the 50-day and 200-day moving averages, keeping the medium-term outlook bullish, but short-term momentum is fading and MACD has
post-image
BTC-0.03%
ETH+1.09%
SOL+3.00%
My hand trembled slightly when I set the stop-loss a few days ago, only to discover this morning that it was unnecessary filial piety.
When the screen was glowing green, I really did doubt myself, but the last thing I saw before bed was the pullback finding solid support right on cue, with volume still holding up—a textbook shakeout coming to an end.
So I went straight into a long position at the right level, with the price pinned at 1.540 and the bull-bear dividing line crystal clear. When I refreshed this morning, it had shot straight up to 2.072, with my position up +2452.93%. Watching the
post-image
SOL+3.02%
SNDK+0.68%
Layout for Bitcoin, Ethereum, and Dogecoin
live-cover
LIVE3,366
  • 1
If I miss it, I don’t chase—that’s the main thing I want to review today. The sharp early-session $ETH rally was indeed tempting, but by then it had already moved away from a reasonable entry point, and chasing it could have left me in a passive position if a pullback occurred. In the end, the market remained volatile and strong, and I didn’t feel frustrated about missing it. This is the approach I’ve come to favor recently.

There was an earlier position in my holdings. I initially judged it to be a breakout pattern, but after entering, it showed no major movement for quite some time. After
post-image
ETH+1.06%
ADA+0.70%
SOL+3.02%
[$COTI Signal] Long: Negative funding rate short squeeze + 4H breakout
$COTI 4H Bollinger upper band at 0.0177 was broken, with the current price at 0.017886. The funding rate is -0.0811%, with shorts continuously paying fees. OI is stable; the price has reached a new high while open interest has not followed, leaving ample fuel for a short squeeze. The 1H RSI at 63.24 has cooled significantly from 80.88 on the 4H, and short-term overheating has been absorbed. Order book depth imbalance is -21.44%, with sell orders suppressing price around 0.0185, while buying support remains at 0.0178.
🎯Dir
COTI+25.08%
BONK alltime high hype pump pump bigpump ATH let’s go
post-image
BONK+5.28%
PUMP-2.57%
BIGPUMP+5.82%
Sunday Evening Market Updates
live-cover
LIVE2,356
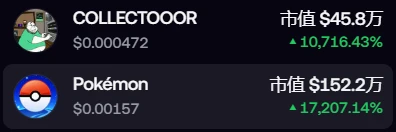
$COLLECT dropped 32% in a single day—are you still fantasizing about a rebound? From 0.0727 down to 0.0420, the entire 42M in trading volume was panic selling. I’m watching just one signal: if it stops falling on shrinking volume around 0.0443, I’ll dare to catch the falling knife; if 0.0420 breaks, I’ll remove it from my watchlist immediately—don’t fight the trend.
My discipline is simple: if it rebounds to 0.0480–0.0500, I’ll cautiously try a short, with a stop-loss at 0.0525 and take-profit around 0.0430; if it first tests 0.0420 without breaking and then recovers 0.0450 on increased volum
COLLECT-33.18%
Everyone’s watching $ETH /USDT sideways—but the 4h tape is quietly loading a trapdoor.

$ETH /USDT - SHORT

Trade Plan:
Entry: 2496.36 – 2502.06
SL: 2526.56
TP1: 2478.69
TP2: 2465.02
TP3: 2444.50

Why this setup?
Why now?
- 1D trend is *range*, not bull—so rallies are sellers’ gifts.
- RSI 15m at 49.23 = zero momentum, just waiting for direction.
- ATR 1h at 11.39 means volatility is coiled; the 2499.21 ref is the pivot.
- Short setup armed: TP1 2478.69, TP2 2465.02—risk to SL 2526.56 is only ~1% for a 1.4% move down.

Debate:
If price taps 2499.21 again, do you fade it or wait for
ETH+1.06%
$BULLA closes with a doji today, then surges past 0.1 after midnight. Did the whales see this script? Thank you for sparing me.
post-image
BULLA+28.66%
#MU just crossed back above $1,000 — but the interesting part isn't the number itself. It's what has changed underneath the stock.
Micron closed the latest session at $1,016.59, gaining about 6.1% and finishing the week roughly 9% higher. The move came alongside a broader semiconductor rally, but MU had its own fundamental reason to attract buyers: the AI memory cycle is getting stronger.
Micron's latest quarter was unusually strong.
Fiscal Q3 revenue reached $41.46B, while GAAP net income came in at $28.24B. Even more important for the forward outlook, Micron guided fiscal Q4 revenue to appro
MU+5.89%
  • 1
- Wait for rebound resistance: 2495–2497 (concentrated short-term EMA resistance)

- Condition: If the price fails to rise in this range and closes bearish under pressure, consider shorting

- Stop-loss: 2501

- First target: 2482 (key support)

- If 2482 breaks below support decisively, the next target is 2472
Will the long position at #龙虾 0.066 finally break even?
post-image
龙虾-15.91%
STONKFun’s STONK briefly tops $150M mkt cap, up ~449% in 24h with $61.3M in volume; volatility reminder for Solana ecosystem tokens. $STONK
post-image
SOL+3.00%
$FLOCK #FLOCK / USDT - 0.07259 (+33.44%)
Live Data: 0.07259 | 24h High 0.08200 / Low 0.05092 / Vol 129.09M / Turnover 8.50M | EMA5: 0.07136 | EMA10 0.06557 | EMA30: 0.05292 | MFI: 90.07 | Today +18.11% | 7d +108.29% | 30d +156.59% | 1y -75.04%
Market Overview
The token moved from 0.03011 on Aug 26 to 0.07259, representing significant price appreciation over the last 10 days. The 30-day performance remains strong, while the 1-year performance reflects a broader historical decline.
Technical Snapshot
EMA5 (0.07136) remains above EMA10 (0.06557), while EMA10 stays above EMA30 (0.05292), indic
post-image
FLOCK+32.71%
  • 6
  • 2
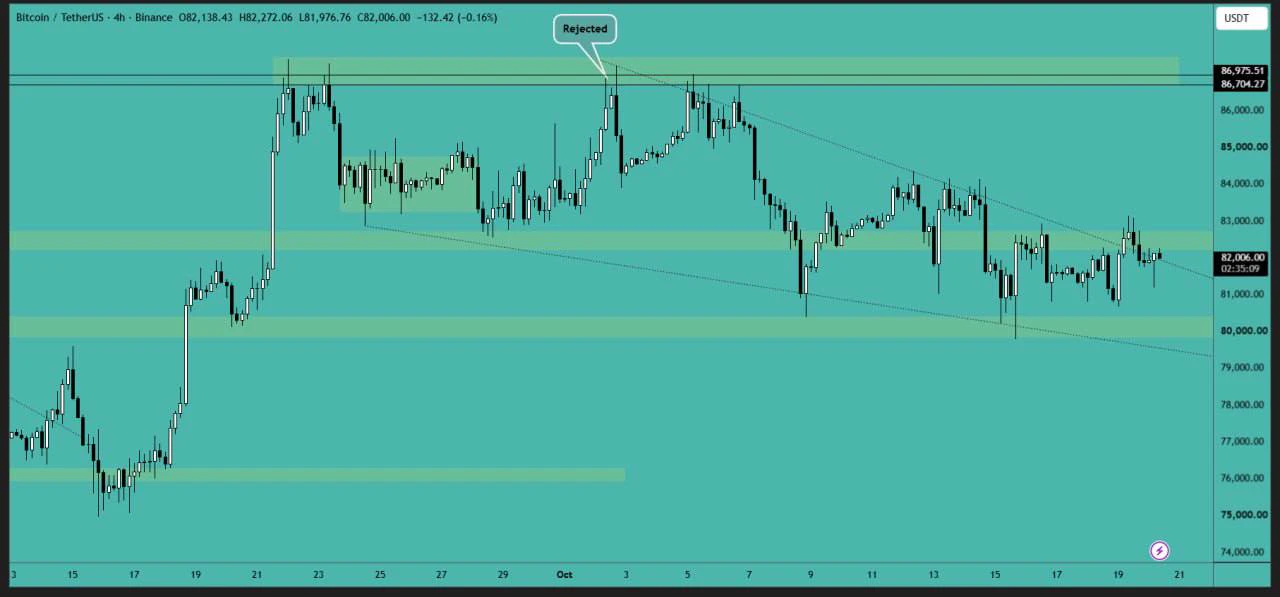
BTC’s broader trend is bullish
It will rise; it is currently in the lowest green zone, which is very likely the end of the pullback
A breakout above the upper green zone would confirm the bullish trend. Wait for the signal and let the flowers bloom
$BTC
post-image
BTC-0.05%
#ALTSEASON 2026 💸
Shill me your 100x gems! 👀💎🚀
👇
post-image
GEMS+1.15%
Load More

Join 40 M users in our growing community

⚡️ Join 40 M users in the crypto craze discussion

💬 Engage with your favorite top creators

👍 See what interests you

View More