Square
Following
Hot
News
Notifications
Profile
Share your thoughts
placeholder
Article
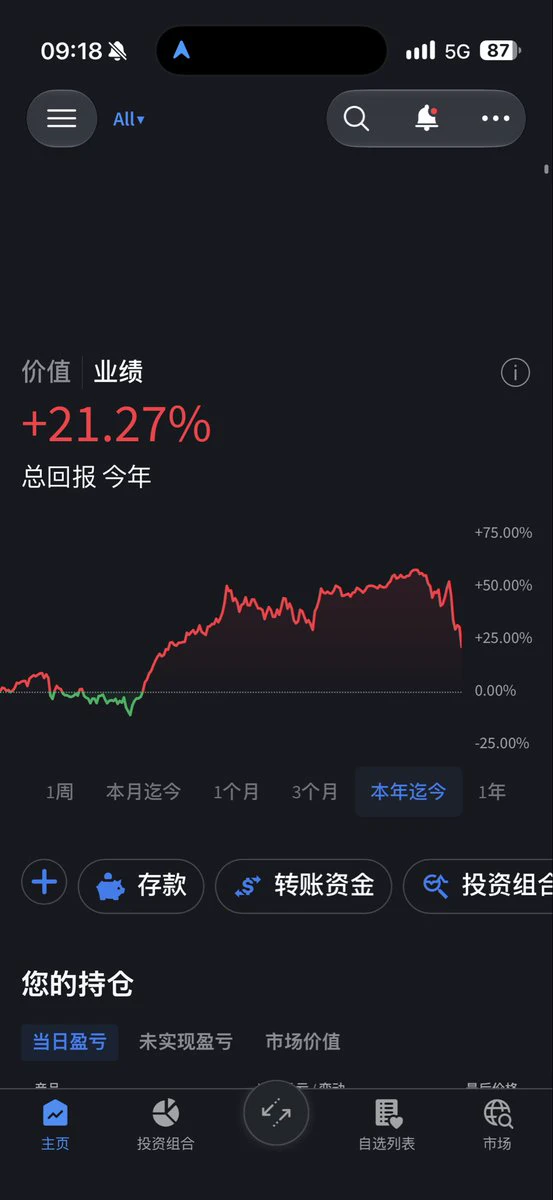
My U.S. stock account’s YTD return has pulled back from 60% to 21%, basically wiping out this year’s gains. But I want to say that the U.S. stock market has one or two major crashes like this every year. Whether it’s a trade war, the war in Iran, or even a black swan like the COVID-19 pandemic, it has always bounced back sharply afterward. Times of market panic are the best opportunities.
AI development is an inevitable trend, and the Democrats are just engaging in political posturing. Even if data center construction is delayed, they can build in Canada or Mexico instead. In the long run, it
post-image
BTC-0.67%
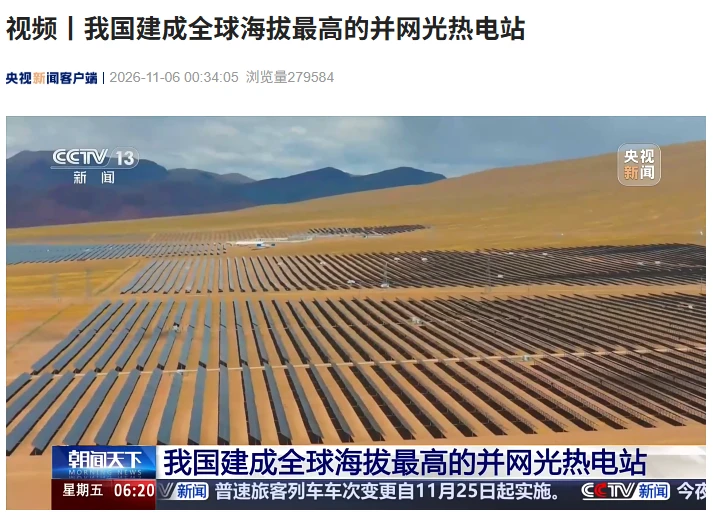
The 100 MW Ali photovoltaic project was connected to the grid at the end of 2022. The part connected this time is the 50 MW concentrated solar power component. The project has a total investment of 2.78 billion yuan and supported employment for more than 500 local herders during construction. Once fully completed and operational, it is expected to generate about 270 million kWh of electricity annually and reduce carbon dioxide emissions by about 168,200 tonnes per year.

Photovoltaics cover daytime demand, while concentrated solar power takes the night shift. It accounts for only one-third of
post-image
BTC-0.67%
Trenches
fxUSD
f
bade
b
fxUSD
0x08...d8f6
Market Cap
$.
Change
.
24h Vol
$.
Holders
.
ZIG
Z
bade
b
ZIG
0x8c...1145
Market Cap
$.
Change
.
24h Vol
$.
Holders
.
BTC
B
bade
b
BTC
C5xp...pump
Market Cap
$.
Change
.
24h Vol
$.
Holders
.
CORLA
C
bade
b
CORLA
0xba...7777
Market Cap
$.
Change
.
24h Vol
$.
Holders
.
STONK
S
bade
b
STONK
6GmA...UNgx
Market Cap
$.
Change
.
24h Vol
$.
Holders
.
11.6 Market Analysis

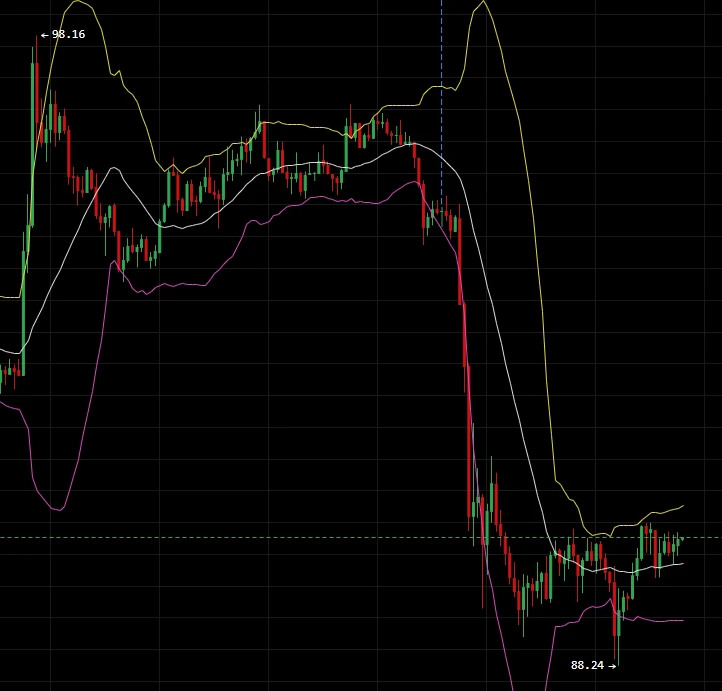
SOL rebound: Scale into shorts in the 91.5–92.5 range,
Defense level: 93.2;
First target: 90.0, second target: 88.24

The rally came to an abrupt halt! SOL’s reversal signal is now unmistakable.
On the one-hour chart, SOL came under pressure and plunged after reaching an interim high of 98.16. Long bearish candles on heavy volume broke through multiple key support levels in succession, with the price hitting a low of 88.24. The current price is 89.93. The previous uptrend structure has been broken, and concentrated selling pressure from bears has been unleashed. For now,
post-image
SOL-0.74%
BTC-0.65%
ETH-1.23%
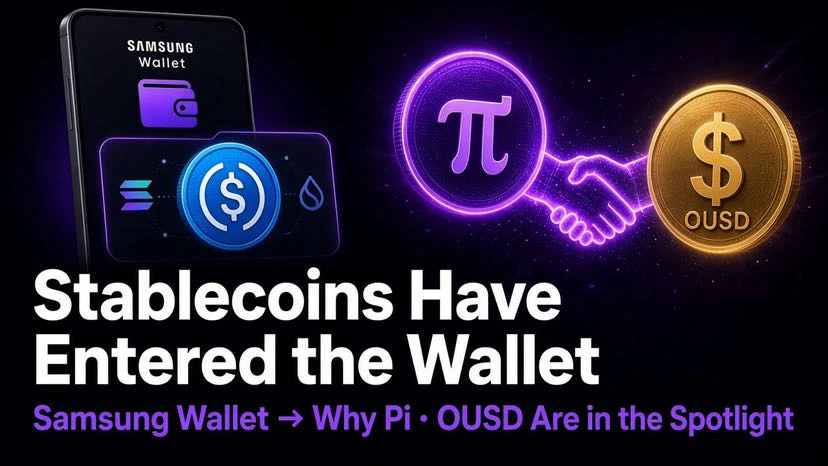
🚨 Samsung has added USDC to its wallet.
And the reason Pi chose OUSD now seems clearer.

Flash: Samsung Wallet is launching USDC stablecoin accounts based on Solana·Sui on about 82 million Galaxy devices in the US.
Users can buy, hold, and send USDC, and even make remittances to more than 60 countries.
Crypto is no longer “just another app,”
but is integrated into the wallets we already use 🚀
This is more than just a simple feature addition.
👉 It signals that “stablecoins are becoming everyday payment infrastructure.”
━━━━━━━━━━
💜 That makes Pi × OUSD even more significant
post-image
USDC+0.01%
PI-0.60%
SOL-0.77%
SUI-1.05%
solana:EJAxERvKU4kEn3NarjvRtgaMaJyP9ZuMeKA7JJpump
In a nutshell: capital from outside the crypto world is flowing into it.
This is a narrative that has never happened before.
EJAxERvKU4kEn3NarjvRtgaMaJyP9ZuMeKA7JJpump
post-image
SOL-0.77%
Are these 100-plus points being saved up to send red envelopes in the family group chat for Lunar New Year?
post-image
$AIN $AIN 50% in one candle—this will definitely make up for this drop
post-image
AIN+3.85%
$AVAX A long opportunity has emerged in the 8.240–8.271 range on the 4-hour chart. I’m watching to see whether buyers enter here. As long as the price holds above 8.24, the long thesis remains valid. Key levels: • On the 4-hour chart, the price has stabilized near 8.26 but remains below the EMA50 at 8.63• Stop-loss risk is 2.3%, while the TP3 target offers 3.6% upside, making for a decent risk-reward ratio• The 1-hour RSI is at 38 and has retraced sufficiently, potentially paving the way for a rebound🟢 Long entry: 8.240–8.271Take profit: 8.367 / 8.441 / 8.552Stop loss: 8.069Will buyers defen
post-image
AVAX-0.10%
Gold has formed an upward structure. How much farther can this rebound go?🔹 BTC is approaching $82,
live-cover
LIVE1,147
The U.S. Job Market Suddenly Springs Back to Life! ADP Adds 86k Jobs—Will the Fed Have Another Headache?

The U.S. job market has delivered another surprise to the markets! The latest ADP data show that the private sector added 86k jobs in October 2026, well above market expectations of 69k. It seems U.S. companies’ appetite for hiring has not completely faded.
What does this report mean? Simply put, the U.S. economy has not yet seen the steep jobs downturn many feared. Companies are still hiring, and the labor market remains somewhat resilient.
However, the Fed may not be celebrating. If the
PEPE+1.05%
  • 1
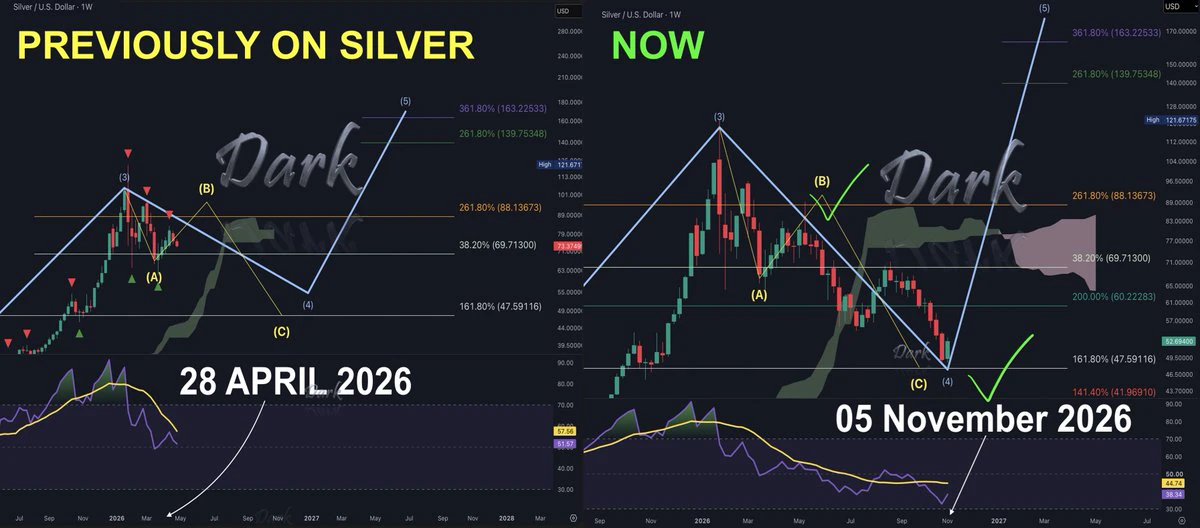
What we expected on the left,
what #Silver did on the right. 🎯
#XAG followed the B Wave exactly to $88, then followed the exact C Wave path right on our Fib level at $47 and bounced.
Precision matters. Wave 5 is being prepared.
post-image
XAG+0.47%
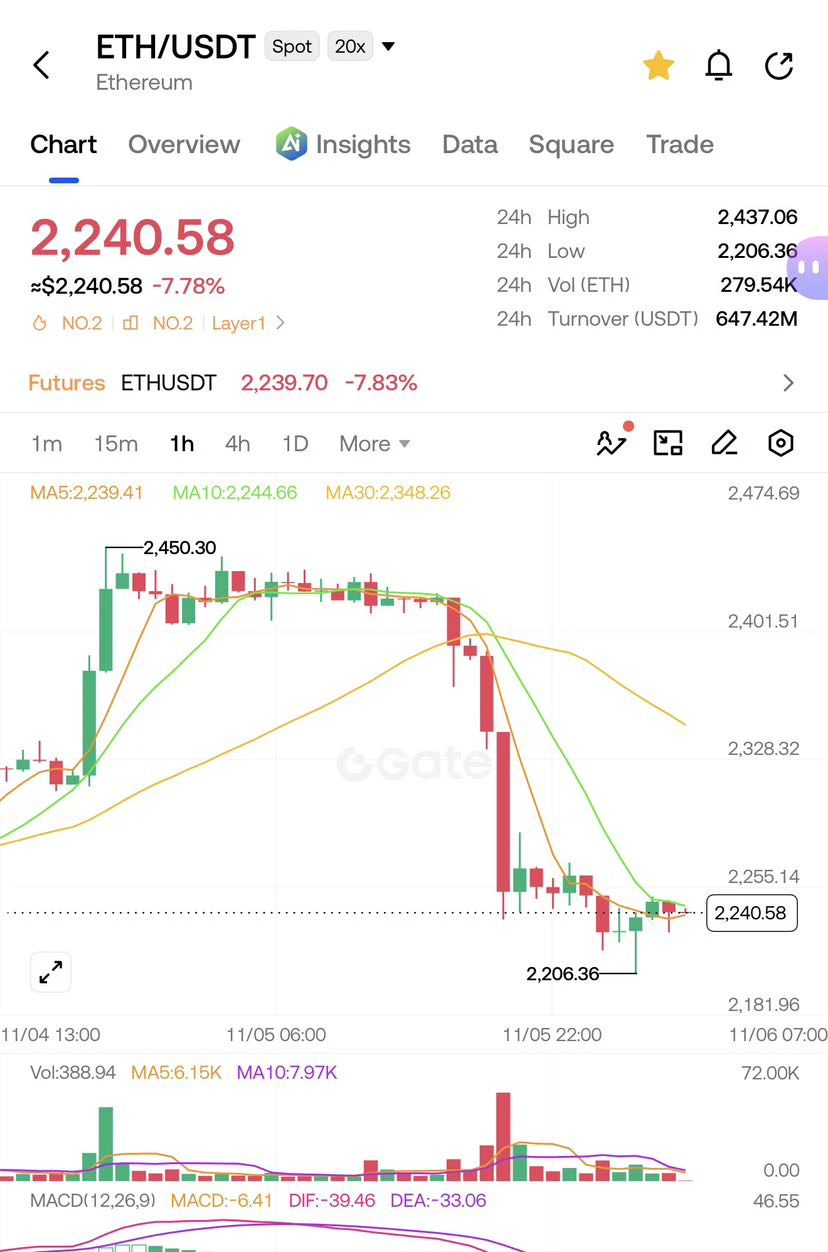
Ethereum is currently trading at $2,240.58.

$ETH is holding around the $2,240 level as traders watch for the next major move. A breakout could build bullish momentum, while continued selling pressure may bring further downside.

Stay alert and watch key support and resistance levels!

#Ethereum #ETH #Crypto #Bitcoin #Trading
post-image
ETH-1.26%
  • 7
  • 1
Are U.S. stocks doomed? Why did they fall so hard? Last night’s U.S. stock sell-off had the feel of a crash, with the Magnificent Seven losing $1.04 trillion in a single day. The irony is that just the day before, the Dow had surged 1,569 points to celebrate the election results. The market first celebrated the “removal of uncertainty,” then realized the uncertainty had simply shifted direction—from “who will govern” to “whether AI can keep burning through this much money.” Three factors converged: ① Democrats didn’t just win both chambers; they also won the Texas and Georgia gubernatorial rac
post-image
BTC-0.65%
NAS100-0.07%
ETH-1.23%
ADP+1.21%
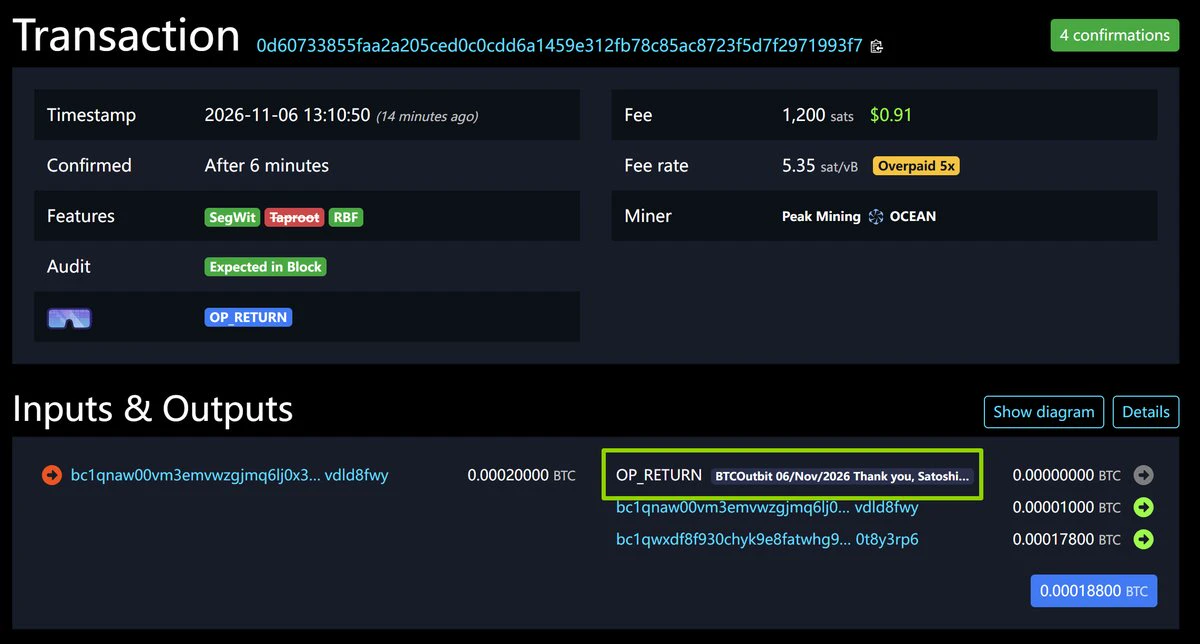
On Jan 3, 2009, Satoshi left a message in Bitcoin's first block.
Today I left one in block #974735: the hash of a letter on what I'm giving back to Bitcoiners.
You'll read it on Thanksgiving. Until then, nobody can change a word. Not even me.
Day 1/21
post-image
BTC-0.67%
BTC PREDICTION MARKET UPDATE
live-cover
LIVE2,139
Intel's wealth-growth target of 54.44 has been reached. Without strong positive news of its own, it will move toward the next target. $INTC ‌
INTC+0.05%
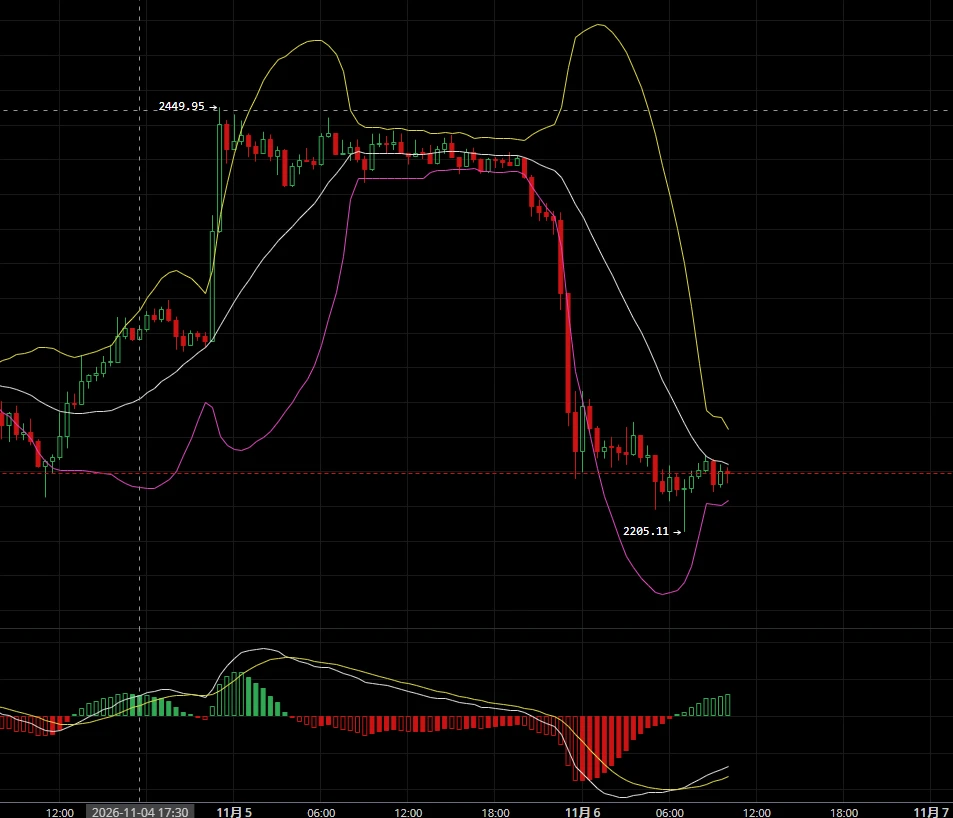
11.6 ETH Setup Strategy

  ETH is in an oversold, oscillating recovery phase following a sharp drop after a spike. The Bollinger Bands are opening downward overall, with price trading between the lower and middle bands. Short-term selling pressure has been largely released, but the broader downtrend remains intact. Key support is concentrated around 2200, the previous low and a sentiment support zone. Secondary support is at 2220-2230, the lower edge of the current trading range. Initial resistance is at 2280-2300, where the Bollinger middle band and short-term moving averages converge. Strong
post-image
ETH-1.23%
#USNonfarmPayrolls Preview: What to Watch as the October Jobs Report Drops Today**
The most market-moving U.S. economic release of the month arrives this morning. At 8:30 a.m. ET on Friday, November 6, 2026, the Bureau of Labor Statistics will publish the Employment Situation report for October. Markets, the Federal Reserve, and traders across asset classes are laser-focused on one number above all: nonfarm payrolls.

**Consensus expectations**
- Nonfarm payrolls: +65,000 (FactSet median; some surveys around +62,000). Range of estimates roughly 40k–125k.
- Unemployment rate: 4.2% (expected
ADP+1.21%
NFP-6.17%
  • 5
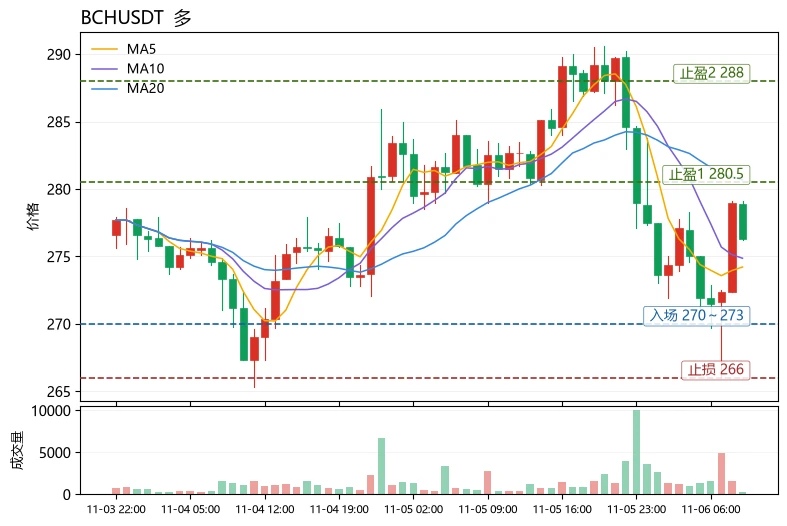
$BCH is currently in a weak consolidation phase, which does not yet constitute a healthy trend. In the short term, focus on buying dips near the range lows and exiting quickly; avoid chasing longs.
First, the method: To judge whether a trend is healthy, look at two things. First, the moving average alignment: the relationship between MA5 and MA20 determines the direction of short-term momentum. Second, price’s position within the Bollinger Bands combined with RSI: if price is near the lower band while RSI remains above 30, it is usually a low-volume pullback rather than a trend breakdown. BCH
post-image
BCH+1.05%
XTZ-2.61%
ENA+8.04%
Bitcoin morning outlook

Trade:
Short around 765-770
First target: 760-755
Second target: 750-740
Set a stop-loss

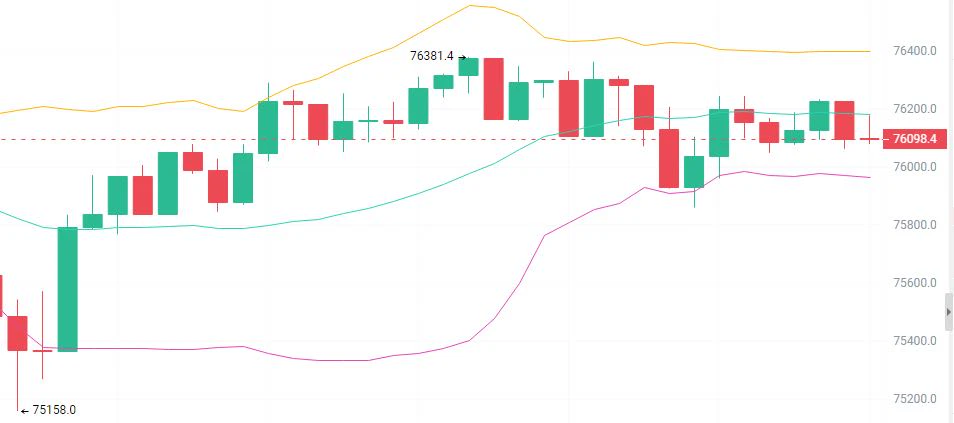
After a sharp drop, Bitcoin is recovering from lows. The broader structure remains bearish, but the momentum indicator has just formed a golden cross, so chasing shorts now could easily get stopped out by a rebound. The strategy is to patiently wait for price to rebound into the resistance zone above, then try a small short position after a clear sign of stalling and a bearish candle appears. Target the middle-band support, with the stop firmly above the previous high. In my view,
post-image
BTC-0.65%
Load More

Join 40 M users in our growing community

⚡️ Join 40 M users in the crypto craze discussion

💬 Engage with your favorite top creators

👍 See what interests you

Trending Topics

USStocksFaceHistoricSelloff

1 Views3.44k Discussing

U.S. stocks suffered a sharp selloff on Thursday, with the Nasdaq closing down more than 5% and the Philadelphia Semiconductor Index falling over 12%. AI and chip stocks including $NVDA and $AMD were hit especially hard. Markets are reassessing AI valuations, data-center spending and future returns. Is this just short-term deleveraging, or the start of a deeper correction in the AI trade? Which sectors are you watching next?

GateLaunchesPoSECProofOfSecurity

10.9k Views559 Discussing

USNonfarmPayrolls

8.57k Views3.96k Discussing

View More