Square
Following
Hot
News
Profile
Share your thoughts
placeholder
Article
crypto market update
live-cover
LIVE1,900
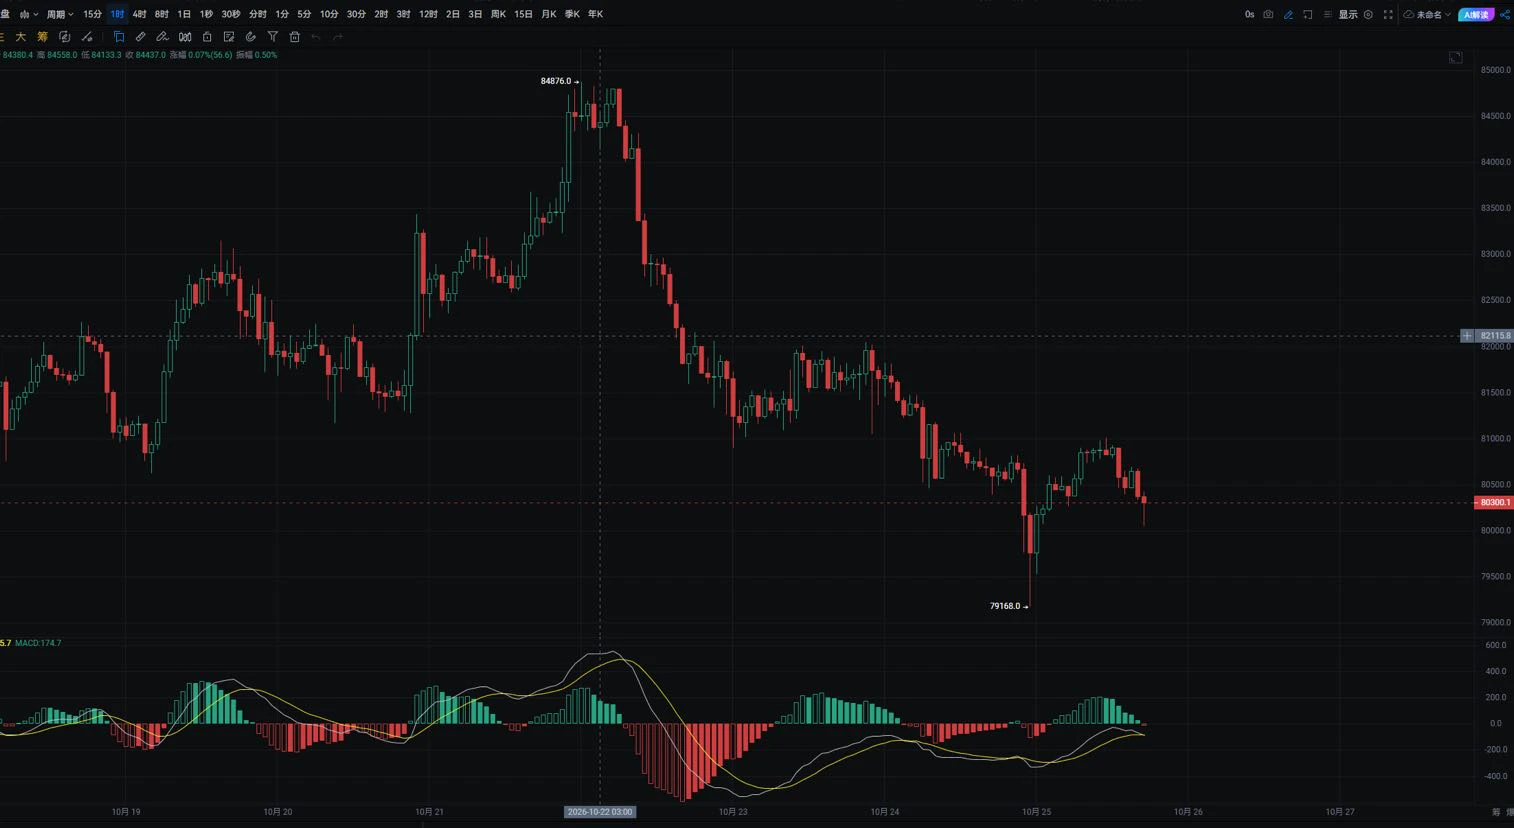
#BTC回调触及81000美元
BTC Retests $81,000: A Rebound Is Here, but a Bottom Still Needs Proof
Bitcoin pulling back from around $87,000 to briefly touch $81,000, followed by a recovery toward $82,000, creates an important decision point. My view is that the rebound deserves attention, but it does not yet settle the debate between a temporary recovery and a lasting bottom. A market can bounce because sellers pause, short positions close, or buyers begin testing support. Those forces do not all produce the same outcome. What matters next is whether buyers can defend the recovery when selling pressure r
GateSquare
📉 BTC retests $81,000, rebound underway—is the bottom in?
Just a few days ago, the market was still discussing 90K, but BTC quickly pulled back from around 87K, briefly touching $81,000 before rebounding to around 82K.
The market rhythm has suddenly changed, and the divide between bulls and bears is becoming increasingly apparent.
Some believe the area around 81K is an opportunity to build positions in a new round, while others worry this is merely a brief rebound amid a downtrend.
Several key questions now deserve attention:
📊 Can the 81K support hold, or will 80K be tested next?
💰 After outflows from spot BTC ETFs, can buying demand return?
🏦 With the Fed remaining hawkish and CPI due to be released soon, will macro pressure continue to affect the market?
Bring #BTC回调触及81000美元 to Gate Square to share your market outlook, trading strategy, or position review.
Whether you are bottom-fishing, waiting on the sidelines, or reducing your position, you are welcome to share your reasoning.
👉 https://www.gate.com/post
Keep and eye on EGY/USDT before it explode. The project is at its early stage with low mcap
After testing the daily-chart support and rebounding, it is now at 823 (“duō” as written), with the 84–86 range in sight. #btc
post-image
BTC-0.37%
$BTC As I said, it is developing exactly as expected, friends!
BTC is following the path I previously pointed out. After falling toward the $80,500 support zone, Bitcoin rebounded and climbed back above $81,700, as expected. The reaction at the support level is progressing smoothly. Next, watch the $82,000–$82,500 range and wait for the next move; according to my chart, the upside target is $83,138. Patience and proper analysis are important. Let the chart speak for itself. Buy and trade $BTC
post-image
BTC-0.37%
📢 LIVE STREAM ANNOUNCEMENT: Ethereum (ETH) Falls Below 2,700 USDT
⏰ Starting Time: 10:06 AM
🎙️ Today's Topic: Ethereum (ETH) falls below 2,700 USDT, with its 24-hour gains narrowing to just 0.20%.
🔗 Join the Livestream:
https://gate.com/live/video/e85d9480386845d8a01f7cce667e394b?type=live&stream_id=e85d9480386845d8a01f7cce667e394b&session_id=e85d9480386845d8a01f7cce667e394b-1791522235&ref=VFBHUV8LVQ&ref_type=104
📊 What Will We Discuss?
Ethereum's movement below the 2,700 USDT level raises important questions about market momentum, trading activity, and investor sentiment.
🔹 Key Discussio
post-image
ETH-2.87%
☀️ GM! The market is a bit bumpy—have you fastened your seatbelt? 🎢
The market could shift gears at any moment. Is your trading plan keeping up?
📌 Today's featured topic: Facing market volatility, what is your “seatbelt”?
🛡️ How do you manage your positions?
👀 What risk signals are you watching most closely right now?
📝 Have you made any trades recently that are worth reviewing?
Seize opportunities, but manage risks too.
Come to Gate Square to share your trading strategies and reviews. High-quality content may receive featured recommendations and additional traffic support.
👇 Share your
post-image
Many people rush to buy the dip as soon as they see the price fall 2%, yet never check whether the moving-average alignment is healthy—this is the most common source of losses. Today, using $ETH , I’ll explain a reusable assessment method: moving-average entanglement.
Currently, $ETH ’s price is 2495.71, with MA5=2487.89 and MA20=2488.41 almost completely overlapping, differing by only 0.5 points. This indicates that long and short cost bases are highly overlapped, and that the trend is in a compressed state before choosing a direction rather than a healthy one-way trend. RSI=45.6 is in the ne
post-image
ETH-2.87%
DOT+4.73%
AMP+20.06%
Multi-Market Trading Challenge Phase 4: Advance Across Four Tracks and Earn Up to 95 USDT https://www.gate.com/campaigns/6436?ref=VLARBF1YAG&ref_type=132&utm_cmp=2I73WcnM
post-image
  • 4
$AIN Breakout imminent! All technical indicators have formed golden crosses—have you gotten on board? Where is the next target?#Gate.io 🔥🚀 #每周来晒
AIN+30.35%
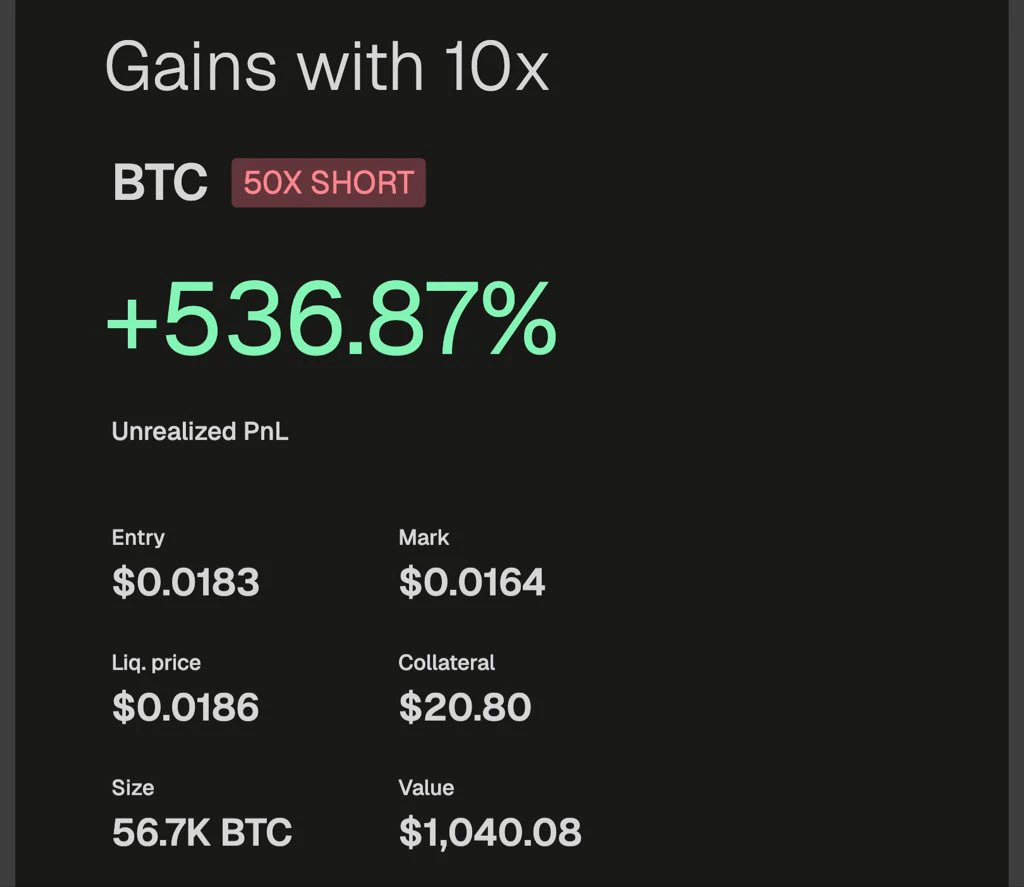
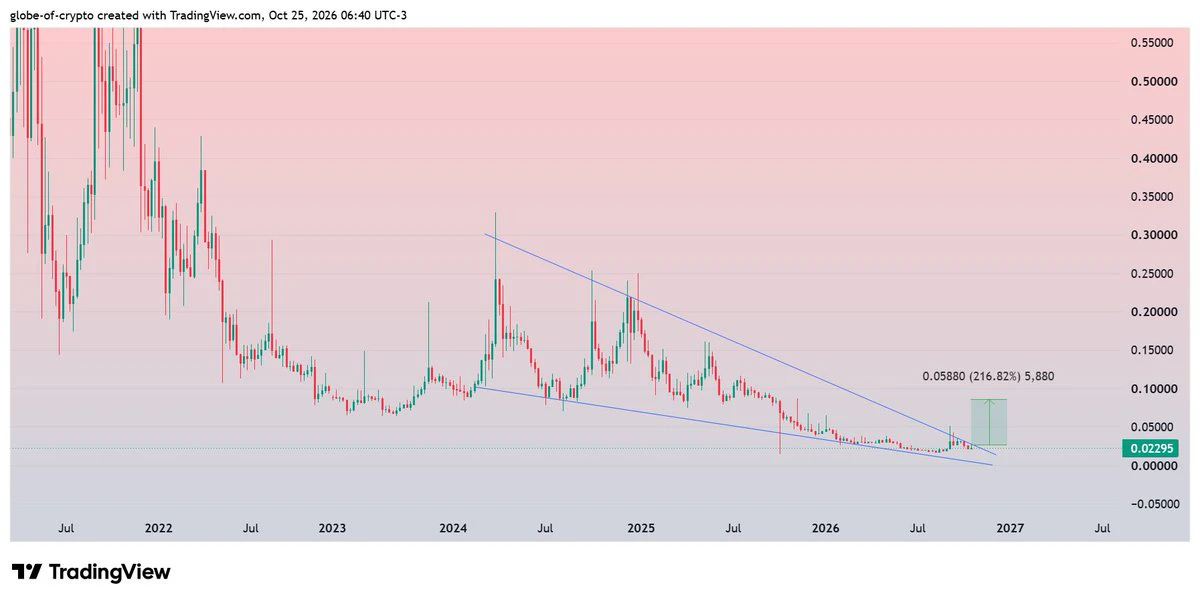
No big-picture thinking, can't hold on; the profit on this move is as thin as paper, but I love it to death. While everyone is still waiting and watching, $US is consolidating sideways at high levels without breaking, with insufficient buying support and a weak rebound. I flagged it as bullish; the opportunity to short is right overhead.
The prerequisite for compounding is staying alive; the shortcut to getting rich overnight is often going to zero.
For trades you're not confident in, taking a look is clear-headed, but opening a position is foolish.
From 0.020880 to 0.016823, +381.63%—enough
post-image
US+20.86%
LAB+4.66%
ADA-7.34%
In the past, when using AI, it was often enough as long as it could provide an answer.
But if AI Agents start doing real work for us in the future, such as writing code, analyzing data, and handling business operations, things will be different.
Suppose you pay an Agent to write a program, and it does submit the code—but the code cannot run at all. What do you do?
If you ask another Agent to help analyze data, but the final deliverable contains obvious errors, what should you do then?
At that point, simply judging how intelligent the Agent is is no longer enough. You also need to know whether
post-image
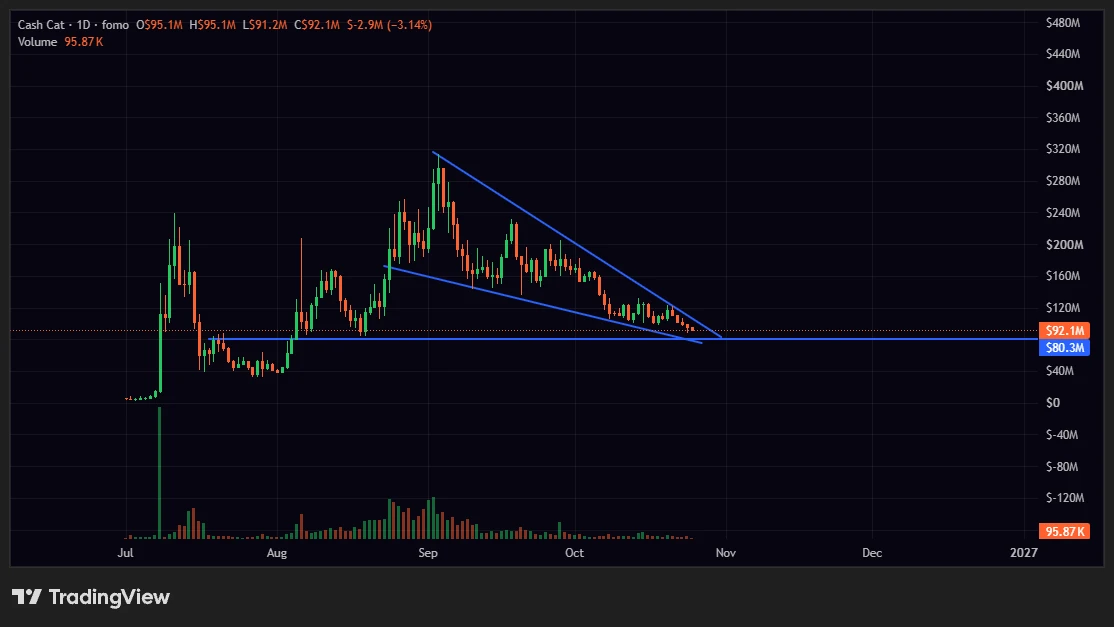
Everyone is missing the real short setup forming right now in $CL /USDT.

$CL /USDT - SHORT

Trade Plan:
Entry: 90.06 – 90.38
SL: 91.76
TP1: 89.07
TP2: 88.30
TP3: 87.15

Why this setup?
Why now? The daily trend is range, which means price is coiling for a directional break and the 1h ATR of 0.640054 shows enough volatility to fuel a move. The 15m RSI at 34.75 confirms bearish momentum without being overextended, giving the entry zone of 90.06 to 90.38 a high-probability trigger. If price reacts from there, the first target sits at 89.07, with the second target at 88.30 offering a clean risk
post-image
CL+0.28%
  • 2
  • 2
Trade Worry-Free: Get 100 USDT Loss Protection and Win Up to 666 NEAR https://www.gate.com/campaigns/6449?ref=VLARBF1YAG&ref_type=132
post-image
  • 1
$STRK Current price: 0.06691. Overhead resistance is at the Bollinger upper band of 0.06613 and the round-number level of 0.068; downside support is MA5 at 0.06336 and MA20 at 0.05897. It surged 35% in 24h, with the price now above the Bollinger upper band. RSI 74.2 has entered the overbought zone, while the MACD bullish bars are still expanding. The trend remains intact, but the short term is overheated.
The key factor is the funding situation: the funding rate is -0.0007%. The price has surged while the rate remains negative, indicating that shorts are still holding passively and longs are
post-image
RLC+37.48%
How can I compliment my girlfriend’s cooking without sounding awkward?
post-image
[New Streamer] Market Prediction
live-cover
LIVE1,711
Another day of getting our faces washed by a waterfall.
According to CoinGlass, liquidations totaled $1.204 billion over the past 24 hours, including $1.053 billion in long positions and $150 million in short positions. A total of 194486 people were liquidated.
The largest single liquidation occurred on Hyperliquid - ETH, valued at $19.9817 million.
Another victory for the bears. The bulls really are having a difficult journey, with so many forks in the road!
post-image
HYPE-1.76%
ETH-2.91%
  • 4
  • 2
in this market #ShareX $Sharex hit 1$
Gave it from 0.20$ to 1$
post-image
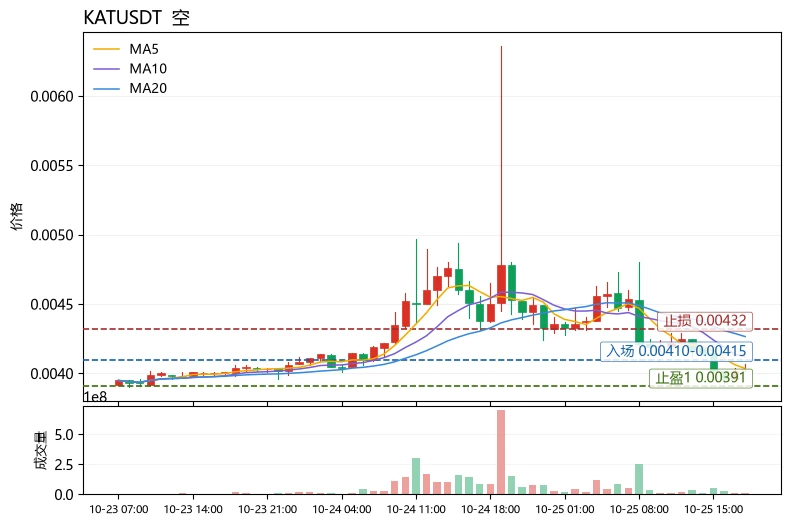
I originally wanted to cut my losses as a sacrifice to the heavens, but the sacrifice never happened—the meat roasted itself. When I checked the chart after lunch, the short had already moved down quite a bit, and my mood went straight from cloudy to sunny.
During the intraday plunge, I saw $EACC struggling to rebound, with clear resistance overhead, strong selling pressure, and relatively low trading volume. The bears got their timing right, so the move down was simply riding the momentum.
From 0.002189 to 0.002066, +55.73% gave the answer outright—feels really good. It was truly sluggish at
post-image
EACC-43.73%
XRP-0.83%
BTC-0.37%
Load More

Join 40 M users in our growing community

⚡️ Join 40 M users in the crypto craze discussion

💬 Engage with your favorite top creators

👍 See what interests you

Trending Topics

GateAtTOKEN2049

35.2k Views20.79k Discussing

Gate brought a series of major events to TOKEN2049 Singapore! From the official launch of Gate Money to the F1 Red Bull driver meet-and-greet and the Gate Gala, we witnessed a new chapter of "One Gate, Borderless Finance." Which moment from TOKEN2049 stood out most to you?

BTC Pulls Back to 81000

25.41k Views35.68k Discussing

AIStocksFallALABDropsOver9%

24.61k Views550 Discussing

View More