





Share crypto content and earn up to 60% commissions through content mining.
placeholder
gatefun
💰 $EDEN   /USDT
🔼 LONG
✳️ ENTRY (Use DCA STRATEGY) : 6500 - 6100
🎯 TARGETS - 6800 , 7250 , 7800 , 8500 , 9800
🀄️ LEVERAGE -  cross 10x
🔴 STOPLOSS - 5900
⚠️ My chart doesn't control the market. This is just my personal view, and I can be completely wrong. Do your own research, manage your risk, and don't blame me if the market chooses violence.
EDEN15.40%
post-image
  • Reward
  • Comment
  • Repost
  • Share
He’s already 41—what love could there be?
If you want to turn things around, use your words to stay in frequent contact with that person you once knew. As long as that person steps in, Sun Ge’s troubles will definitely never end.
You even need three days to think over being threatened for 80k yuan. The most important thing now is to hold on to the 35 million yuan and find a way to get that person to help you put Sun Ge on an Interpol Red Notice. By then, it won’t be as simple as $50 million—you could very well get $500 million.
You have to remember what his ex-girlfriend once said: taking his
View Original
post-image
  • Reward
  • Comment
  • Repost
  • Share
#CryptoMarketRecovery
Crypto Market Recovery: How Much Ground Has Been Won and What Comes Next
The word recovery has been on every traders lips this week, and for good reason. Let me break down the numbers first. You gave Bitcoin at 81,450 dropping to 80,150, and on Gate the flagship coin is holding right around 80,000 in the same zone, briefly touching 81,473 as the intraday high while finding its low near 78,600. In the last 24 hours Bitcoin is up about 1.4 percent, and the daily candle closed near 80,500. So against your own reference the dip from 81,450 to 80,150 is only a shallow 1.6 perc
post-image
post-image
HighAmbition
#CryptoMarketRecovery
Crypto Market Recovery: How Much Ground Has Been Won and What Comes Next
The word recovery has been on every traders lips this week, and for good reason. Let me break down the numbers first. You gave Bitcoin at 81,450 dropping to 80,150, and on Gate the flagship coin is holding right around 80,000 in the same zone, briefly touching 81,473 as the intraday high while finding its low near 78,600. In the last 24 hours Bitcoin is up about 1.4 percent, and the daily candle closed near 80,500. So against your own reference the dip from 81,450 to 80,150 is only a shallow 1.6 percent pullback, which is less a breakdown and more an ordinary pause inside an already strong move. The real story is bigger than that single bar. Bitcoin fell from a January high near 95,000 all the way down to a brutal 21 month low of about 57,950 on July the first, spending most of June below 60,000 as leveraged positions were wiped out. From that cycle low the price has climbed back above 80,000, which works out to a recovery of roughly 38 percent from the bottom. If you measure it differently, Bitcoin has now won back about 60 percent of everything it lost between the January peak and the June low, and it is sitting at about 84 percent of its January level. In simple terms, the market has clawed back well over half of the damage from the bear stretch, and that is a genuine recovery, not a dead cat bounce in my view.
Ethereum is moving in the same rhythm but with a slightly heavier step. You have it at 2,510 which matches the live picture closely, the daily close came in near 2,512 with a high around 2,547 and a low near 2,500, and the last 24 hours show only a marginal negative change of about 0.2 percent. Ethereum is essentially flat on the day, holding the 2,500 support after its own bounce, and technically it is flagged bullish on the daily with an RSI that has pushed into overbought territory around 55 on the shorter frames and climbing. Solana you placed at 106, and the tape shows it around 106.35 after printing a high near 110.6 and a low just above 100.7, up strongly about 4.9 percent in 24 hours and a standout performer of the session. Solana also stands out for a different reason, funding turned negative at roughly minus 0.7 percent and open interest jumped almost 15 percent in 24 hours, which tells me shorts are being squeezed and fresh longs are stepping in, a classic signature of a momentum recovery catching leveraged bears off guard.
The rest of your table tells the same constructive story. XRP around 1.43 is up about 1.6 percent on the day with the daily high near 1.47, ZEC near 780 is roughly flat after touching an intraday low around 772, HYPE at 83.4 is up almost 2.8 percent printing a high near 86.8, and Dogecoin at 0.087 is up about 0.7 percent with a high near 0.090. On the precious metals side your gold figure of 4,584 and silver of 68.9 line up with a market that has seen gold recover about 14 to 15 percent from its June low near 4,000 and reclaim roughly 86 percent of its January high around 5,300, while silver has been the lightning rod, surging roughly 20 percent in August toward the low to mid 70s and igniting mining equities. Everything across both crypto and metals is participating, which is the hallmark of a broad risk asset recovery rather than a narrow meme squeeze.
Liquidity and volume back this up with real money. Total crypto market capitalisation is about 2.8 trillion dollars, up 1.7 percent in 24 hours, while combined 24 hour volume sits near 98 billion dollars. Bitcoin alone shows taker buys of roughly 35.8 billion against taker sells of about 34.7 billion over the same window, so buyers are outbidding sellers and the tape is mildly bid. Open interest on Bitcoin aggregates to around 57 billion dollars, funding is modestly positive near 0.45 percent and the long to short ratio sits just above one, so positioning is not yet overcrowded to the long side, which means there is still room for this move to extend without being threatened by a wall of crowded longs. Notably, spot Bitcoin ETFs brought in about 232 million dollars in net inflows on the latest session, holdings across the funds total roughly 98.6 billion in assets, and since launch BlackRock fund alone has stacked about 765,000 Bitcoin worth around 60 billion, comfortably the fastest growing ETF in any asset class. Institutional money is flowing in, not out, and that is the single most important liquidity signal for a durable recovery.
Now the part that requires honesty and care, because the story around the Federal Reserve is the opposite of what most people assume right now. The market you are trading is not recovering because the Fed is cutting rates, because the Fed is not cutting. The current federal funds target range sits at 3.50 to 3.75 percent, and under the new Fed chair Kevin Warsh the committee has been holding, with the July meeting leaving rates unchanged and prediction markets having priced that pause at better than 90 percent before it happened. More striking, J.P. Morgan strategists have actually flipped their base case from on hold to a 25 basis point rate hike at the September meeting, citing slower than expected supply chain recovery tied to the Middle East conflict and higher inflation expectations. Kalshi currently prices the September decision at about 71 percent for a hold, and Polymarket splits a 2026 hike at essentially a coin flip of roughly 50 percent. So the honest framing is that the market is debating whether the Fed holds or hikes, not whether it cuts, and any narrative saying rate cuts are the fuel for this rally is factually wrong.
The real drivers of this recovery are therefore elsewhere, and they are worth naming precisely. First, there was a violent short squeeze in mid August when Bitcoin broke above 67,000 with an 8 percent overnight surge toward 71,500, and a Treasury related move that saw the dollar sell off sharply as investors rotated into hard assets like Bitcoin and gold, blowing up a crowded set of shorts that had bet on the market staying stuck below 67,000. Second, the bond market repricing and a weaker dollar have lifted inflation hedges across the board, which is exactly why gold and silver are flying in the same window as crypto. Third, and most durable, institutional adoption is accelerating, treasury buybacks, continued ETF inflows, and infrastructure deals like BitGo acquiring NYDIG trading business as the industry positions for a rebound all point to money preparing for the cycle to turn.
What does that mean for the road ahead? There are two genuinely interesting catalysts on the immediate calendar. Friday brings Fed chair Warsh keynote at the Jackson Hole conference, and analysts broadly expect him to take a tough line on inflation, which could inject a short term bout of volatility into an already stretched rally. Right after that, the week ahead is heavy with data, with the August PCE reading, and into September the non farm payrolls report, the CPI print, and the crucial FOMC meeting with its Summary of Economic Projections on the 15th and 16th. The consensus view from Wall Street shops is that Warsh will hold rates steady at least until after the November midterm elections even if he keeps a hike on the table, and ING believes the Fed will not start actually cutting until 2027 if at all, which is a much more hawkish backdrop than the 2026 rate cut narrative that circulated earlier this year. So the macro tailwind that powered the 2024 and early 2026 bull runs is simply not present, and this recovery is being built on liquidity rotation, dollar weakness and institutional flows rather than on monetary easing.
My own read, and I will give it to you straight, is that this recovery is real but it is being led by a squeeze and a dollar move rather than by a fundamental easing cycle, and that distinction matters enormously for how you manage risk. The technical structure is genuinely constructive, Bitcoin daily RSI is in overbought territory near 64 with a bullish trend anchor across the 3 day and 4 hour frames, Ethereum and Solana are both flagged bullish on the daily, funding is not overextended, and the squeeze argument still has room because positioning was so defensive into August. That combination can carry prices higher, and I would not be surprised to see Bitcoin test toward the mid 80,000s before the FOMC, with gold and silver staying bid on the same dollar weakness trade. But the flip side is that everything now trades on the two data weeks ahead, and with a hawkish Fed chair and respectable odds of a hike being debated, the risk is asymmetric into the September meeting, meaning downside gaps are wider than the upside if the data comes in hot. So my honest advice in a single line, let the recovery work for you while positioning is not crowded, respect the 80,000 to 78,600 support zone as the near term line in the sand for Bitcoin, watch the 2,500 level for Ethereum as its own pivot, and above all do not treat this as a green light to chase leverage, because the market is healing but the Fed has not yet given it permission to sprint.
#CryptoMarketRecovery
repost-content-media
  • Reward
  • Comment
  • Repost
  • Share
JUST IN: BlackRock notes Bitcoin’s safe-haven/anti-devaluation narrative returning as macro risk signals lift demand; BTC moved toward $80k+ amid concerns on debt and dollar durability. $BTC
BLK-0.60%
BTC0.18%
post-image
  • Reward
  • Comment
  • Repost
  • Share
📊 Day 28 live trading log.
Total account assets: 3,755 U, with today's unrealized profit at +39 U. SNXX pulled back 13% today, but overall profits are still intact. A follower's account grew from 500 U to 650 U, with realized P&L of 118 U—holding steady.
That's the benefit of going long and short at the same time—no panic when prices fall, as short positions make up for it; no greed when prices rise, as long positions take profits in batches. Letting both sides take turns keeps drawdowns under control and allows compounding to build gradually.
Only two days left. Just protect the profits. As
SNXX-14.82%
View Original
post-image
post-image
波动率猎人 多空策略
1/50
Futures
30D ROITrader PnL
+42.16%
+1,167.38
Win Rate
--
AUM
658.98
Copiers PnL
--
  • Reward
  • Comment
  • Repost
  • Share
#HYPEContinuesToHitAll-TimeHighs
HYPE Is Still Near Its Record High
HYPE is trading around $83.59 after recently reaching a fresh all time high of $86.77 on August 27. From $86.77 the token is currently only about 3.7% lower which shows that buyers have not given up after the record breakout. More importantly HYPE has climbed from around $59.46 just seven days ago. That represents a massive weekly gain of roughly 40.6%. A move of this size normally creates profit taking but HYPE is still holding close to the top which is a strong sign of market confidence. The recent sequence of higher highs
HYPE3.01%
USDC-0.02%
post-image
post-image
  • Reward
  • 2
  • Repost
  • Share
QueenOfTheDay:
To The Moon 🌕
View More
topic NVIDIA
gate liveLIVE
1,607
live-coin
  • Reward
  • Comment
  • Repost
  • Share
🔥@Friday Free Strategy Levels👇
🔥@Long Entry Levels (see the pinned subscription post for the second entry level, short entry level, and take-profit level; spot setups for both long- and short-term trades are also in the pinned post)@
===========
77800 long, 77500 long, Sun 76100
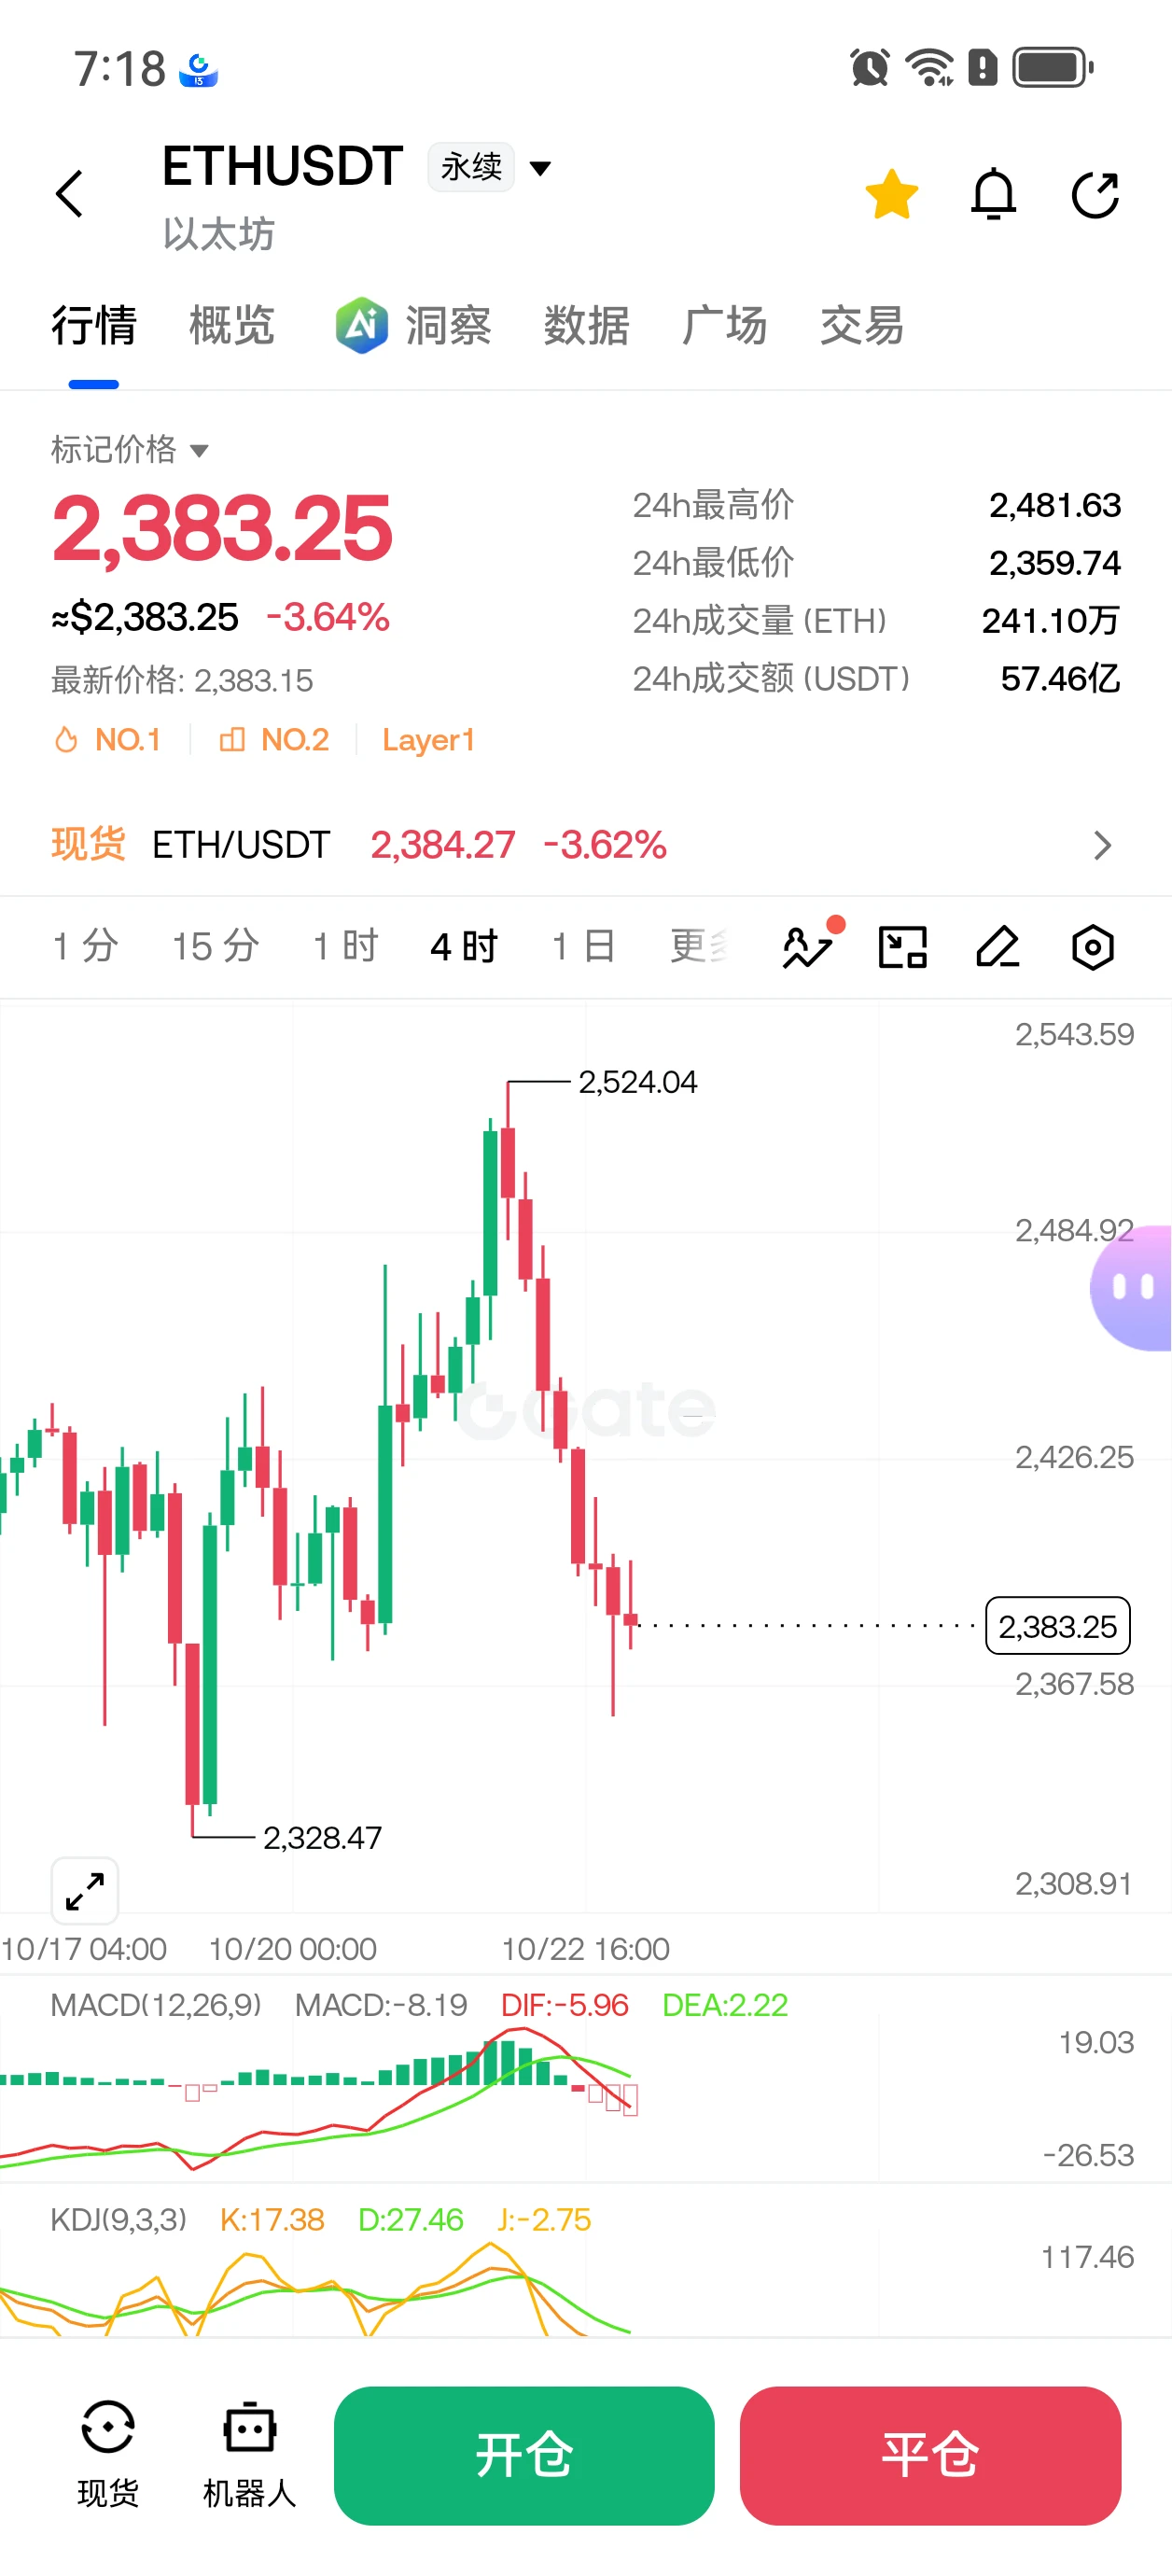
2485 long, 2465 long, stop-loss 2420
#Gate7天净流入全球Top3
View Original
post-image
post-image
  • Reward
  • Comment
  • Repost
  • Share
On the Eve of LINK Breaking Down, Have the Bears Already Taken Positions?

$LINK /USDT - SHORT

Trading Plan:
Entry: 11.673 – 11.733
SL: 11.994
TP1: 11.485
TP2: 11.339
TP3: 11.121

Why Watch This Setup?
- 4-hour SHORT signal, with 55.4 confidence and a clear direction.
- Current price is 11.703, closely tracking the EMA, but RSI (15m) has already fallen to 38.64, clearly showing weakness.
- The 1D trend is ranging, but ATR (1h) is only 0.121. Volatility is narrowing, and a shift is imminent.
- Why now? The price is repeatedly testing the lower boundary of the range. Once it breaks below 11.
LINK-0.07%
View Original
post-image
post-image
  • Reward
  • Comment
  • Repost
  • Share
$LAB /USDT 4-hour bearish signal, 80% win rate—are you brave enough to follow?
$LAB /USDT - SHORT
Trading plan:
Entry: 0.07627 – 0.07703
SL: 0.08134
TP1: 0.07313
TP2: 0.07079
TP3: 0.06727
Why pay attention to this structure?
- The 1D trend is clearly bearish, with 4-hour-level confluence for a short, indicating strong directional consistency.
- The 15-minute RSI has reached 71.9, showing short-term overbought conditions and creating an ideal entry window.
- The current price is 0.07665. TP1/TP2/TP3 below are 0.07313/0.07079/0.06727 respectively, with a risk/reward ratio of nearly 1:2.5.
- Why
LAB7.05%
View Original
post-image
post-image
  • Reward
  • Comment
  • Repost
  • Share
Gold prices consolidated in a low range early today, with downside pressure gradually easing and support at lower levels strengthening. On the daily chart, prices are undergoing a high-level pullback and repair; the hourly and four-hour charts are slightly weak in the short term, but downside momentum is weakening, making sustained declines unlikely. Around 4600 has turned into short-term resistance; watch 4615-4635 for resistance above, and 4570 for support below. 4550 is the key lifeline for bulls, so downside room is expected to be limited.
The previous initial jobless claims data drove the
XAU0.06%
View Original
post-image
  • Reward
  • Comment
  • Repost
  • Share
#NVIDIAEarnings NVIDIA Earnings have once again shown why the AI infrastructure story remains one of the most important themes in global markets.
NVIDIA delivered an outstanding fiscal Q2 2027 performance, generating approximately $96.2 billion in quarterly revenue, up more than 100% year over year. Adjusted earnings reached $2.22 per share, beating market expectations and demonstrating that demand for advanced AI computing remains extremely strong.
The biggest highlight was the Data Center business, which generated around $89 billion in revenue. This shows how quickly AI infrastructure spendi
NVDA8.55%
post-image
  • Reward
  • Comment
  • Repost
  • Share
Live trading - Analysis crypto coin
gate liveLIVE
1,454
live-coin
  • Reward
  • Comment
  • Repost
  • Share
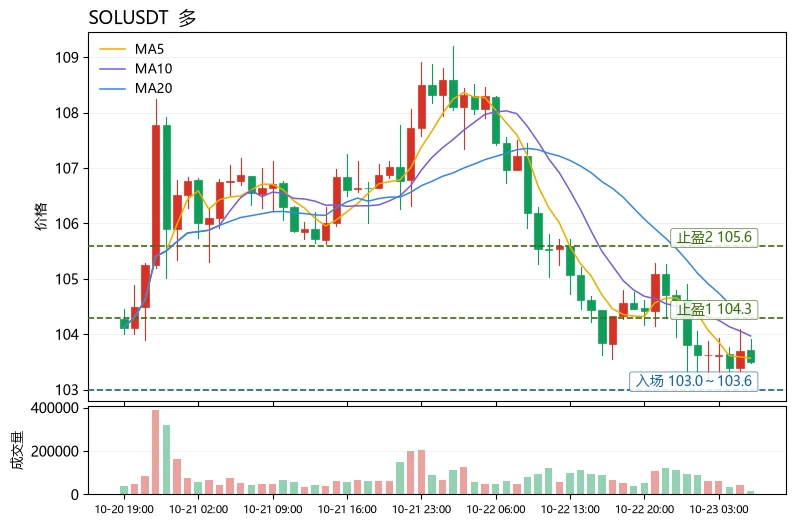
Lurking at 106.87 on SOL—is this wave a fake breakout or a real pullback?

$SOL /USDT - SHORT

Trading plan:
Entry: 106.50 – 107.24
SL: 110.42
TP1: 104.21
TP2: 102.43
TP3: 99.76

Why watch this setup?
- The 4H direction is clear: SHORT, with 55.4% confidence. It is not a high-probability trade, but worth trying.
- Key levels: 106.87 is the current reference price, with TP1 at 104.21 and TP2 at 102.43 below, leaving sufficient room.
- The 15m RSI is at 50.75, not considered oversold, indicating further downside momentum and that this is not catching a falling knife.
- The 1D trend is range,
SOL3.45%
View Original
post-image
post-image
  • Reward
  • Comment
  • Repost
  • Share
Recently, I’ve been selling calls and selling puts on Hong Kong and U.S. stocks.
Based on my experience, compared with the flexibility of A-shares, options are a useful tool for users holding Hong Kong and U.S. stocks.
In this market, learning more and making whatever preparations are within your means already puts you ahead of many others. Accumulate coins, hold your positions, and wait for the bull market!
View Original
post-image
  • Reward
  • Comment
  • Repost
  • Share
#StrategySharesBreak135ForFirstTimeIn12Weeks 🚀
Bitcoin is showing renewed strength as it climbs back above the $81,000 level! 📈 This move highlights the continued confidence and momentum in the crypto market, attracting attention from traders and investors worldwide.
Will Bitcoin maintain this bullish momentum and push toward new levels? The market is watching closely! 🔥
BTC0.18%
post-image
  • Reward
  • Comment
  • Repost
  • Share
$BTC Midday Market Brief
Bitcoin has been wicking back and forth around the 80k mark today, with another classic shakeout liquidating both longs and shorts.
The early-session push into the 81500-82000 resistance zone was immediately slammed back by selling pressure, showing that sell orders are heavy at this level and the bulls cannot break through for now.
Tonight's real highlight is the Fed chair's first public speech since taking office. This will set the direction: a hawkish tone could mean a top followed by a pullback, while a dovish tone could trigger an explosive rally.
Those looking t
BTC0.18%
View Original
post-image
post-image
  • Reward
  • Comment
  • Repost
  • Share
This rally came too suddenly—I hadn’t even had time to add to my position before it took off. 🚀 $CAP During the session’s repeated fluctuations, I kept an eye on trading volume and noticed that every push higher was followed by buyers, with solid support and pullbacks holding firm. Isn’t this a typical pullback holding steady? The patience during the bottoming process wasn’t wasted.

I signaled to open a long position, entering at 0.02038. It’s now at 0.0662, with 80% banked. The wait was worth it, and congratulations to those who got in. 🎯

Don’t lose patience in a range, only to try to r
CAP-6.33%
XRP-0.77%
BNB-0.23%
View Original
post-image
  • Reward
  • Comment
  • Repost
  • Share
#TopFiveLeaguesPreMatchPredictor
Bayern Munich host Stuttgart tomorrow at 02:30 UTC+8 and this looks like one of the cleaner home fixtures of the weekend. Bayern have started the season with strong control in midfield and a direct threat in the final third. Stuttgart will try to stay compact and hit on the break, but they have struggled to contain high-pressing sides so far.
I am predicting a 3-1 win for Bayern. The home side should score first, force Stuttgart to open up, and then add two more before the final whistle. Kane’s movement and the wide players’ ability to stretch the defence give
post-image
post-image
post-image
Bayern vs. Stuttgart
FC Bayern München
1.25x
80%
Draw
7.69x
13%
VfB Stuttgart
12.50x
8%
$445.8K Vol
  • Reward
  • Comment
  • Repost
  • Share
This line is so realistic....
View Original
post-image
  • Reward
  • Comment
  • Repost
  • Share
Load More

Join 40 M users in our growing community

⚡️ Join 40 M users in the crypto craze discussion
💬 Engage with your favorite top creators
👍 See what interests you
  • Pinned