Square
Following
Hot
News
Notifications
Profile
Share your thoughts
placeholder
Article
$TAO Short thesis update: 186 is a resistance zone on the 4-hour chart. Price has already hit my take-profit target, so I’m watching closely now. If a 4-hour candle closes above 189, I’ll abandon the bearish view.
The current 4-hour price is 185, below the EMA50 (193), and bears still control the momentum. The stop-loss distance is about 1.8%, with 2.9% room to the third target. If TP3 is reached, the risk-reward ratio would be around 1.6R.
Short entry range: 185.2–185.6. Staggered targets: 183.4 → 182.1 → 180.1. Structural invalidation: 188.7
Where would you place your stop loss? This is not
post-image
TAO+0.41%
$BTC ‌The sea of red we saw on our screens may have sent a shiver down all of our spines for a moment. Bitcoin dipped below $60,000 for the first time since July, even falling as low as $55,130 at one point. Some of you might have wondered, "Is something even worse on the horizon?" Yet, markets sometimes offer a bit of breathing room, even in their darkest moments. That is precisely what happened: as the weekend approached, Bitcoin staged a recovery, climbing back to the $60,279 level.

So, what fueled this rapid rebound? In essence, the crypto market was purging its own internal excesses. Ac
BTC-0.67%
  • 5
  • 3
Trenches
IDOL
I
bade
b
IDOL
0x3b...ab07
Market Cap
$.
Change
.
24h Vol
$.
Holders
.
PIEVERSE
P
bade
b
PIEVERSE
0x0e...25a9
Market Cap
$.
Change
.
24h Vol
$.
Holders
.
FIONA
F
bade
b
FIONA
B34n...pump
Market Cap
$.
Change
.
24h Vol
$.
Holders
.
Singularity
S
bade
b
Singularity
7R4M...pump
Market Cap
$.
Change
.
24h Vol
$.
Holders
.
CLAUDIA
C
bade
b
CLAUDIA
2j5S...W2ZM
Market Cap
$.
Change
.
24h Vol
$.
Holders
.
Good evening fam! 😎
On that bring again.
Half way done.
post-image
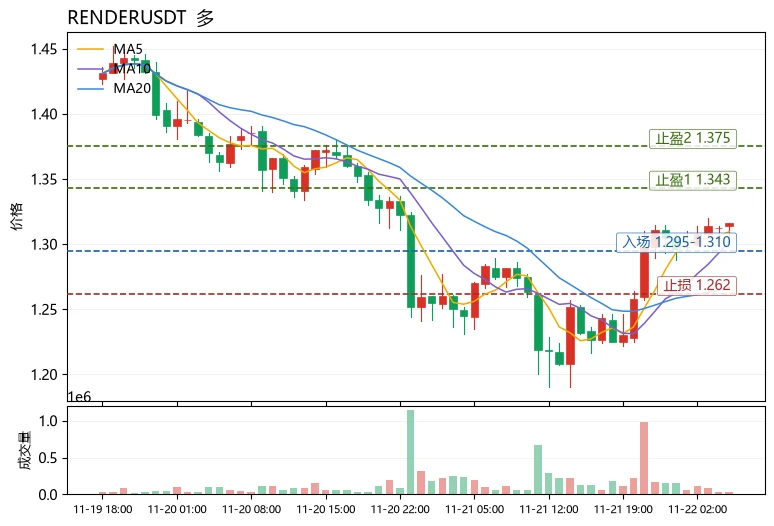
Fear and Greed Index is only 12, and the market is in the extreme fear zone, yet $RENDER bucked the trend and rose 3.62%—this divergence is the most unusual detail in today's market. Funds are not pulling out amid fear, suggesting bulls are quietly accumulating.
Technically, $RENDER is currently at 1.316, with MA5=1.3096 above MA20=1.2666, indicating a bullish short-term moving average alignment; RSI=59.0 is strong but not overbought, while the MACD histogram at +0.009781 maintains bullish momentum. The upper Bollinger Band at 1.34351 is the immediate resistance, and the price is trading near
post-image
RENDER+0.47%
DODO+11.43%
RARE-0.89%
Goizzzzzz $IDOL All take-profit targets have been successfully hit, securing a huge victory 🥳🥳🥳🥳🥳🥳🥳 Making history! Every target has been successfully hit. • TP1: 0.028 ✅• TP2: 0.030 ✅• TP3: 0.032 ✅• TP4: 0.034 ✅Congratulations to everyone who caught this move! 🥂 From the initial entry to TP4, the entire move unfolded perfectly according to plan. You believed in the plan, and it paid off. Missed the whole move? Don’t worry. The next move is here: Final push: 0.045 🧲• Entry: 0.0330 – 0.0345 (current range / slight pullback)• Target: 0.045• Stop-loss: 0.0290 (protect profits)Execution
post-image
IDOL-6.71%
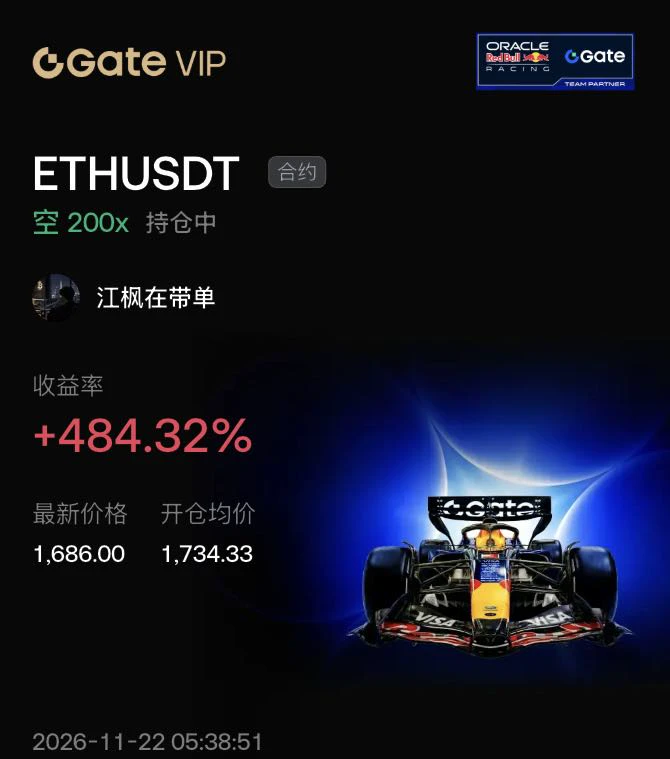
$ETH This Ethereum bounce has eaten away more than half the unrealized profit on this trade.

Early in the morning, it fell to 1578, and the unrealized profit was still over 1,300%; now, at 1686, it’s down to just 484%. The price has only risen 5%, but the return has dropped by more than 800 points—that’s how 200x leverage works.

The bounce isn’t surprising. After falling more than 7% in a day and breaking below 1600 for the first time, shorts are taking profits, while dip buyers are coming in to test the waters. With more than 400 million worth of long positions liquidated, the downward pres
post-image
ETH-1.23%
BTC-0.65%
  • 1
GT is dropping like crazy, screaming, screaming, screaming aoaoj
post-image
GT-2.41%
  • 1
Fear Grips Global Markets as Wall Street Approaches a Critical Point
live-cover
LIVE12
BTC-0.67%
ETH-1.26%
USDC+0.01%
XRP-1.15%
#BTC跌破6万美元关口 Post a valid post to get some boosts
post-image
BTC-0.67%
  • 2
$KOR 305.2 million tokens unlocking on December 4,
post-image
  • 2
Where else but the UK would I hear “I love your outfit” five times a day?
Especially when I’m wearing my Gryffindor scarf and my red boots.
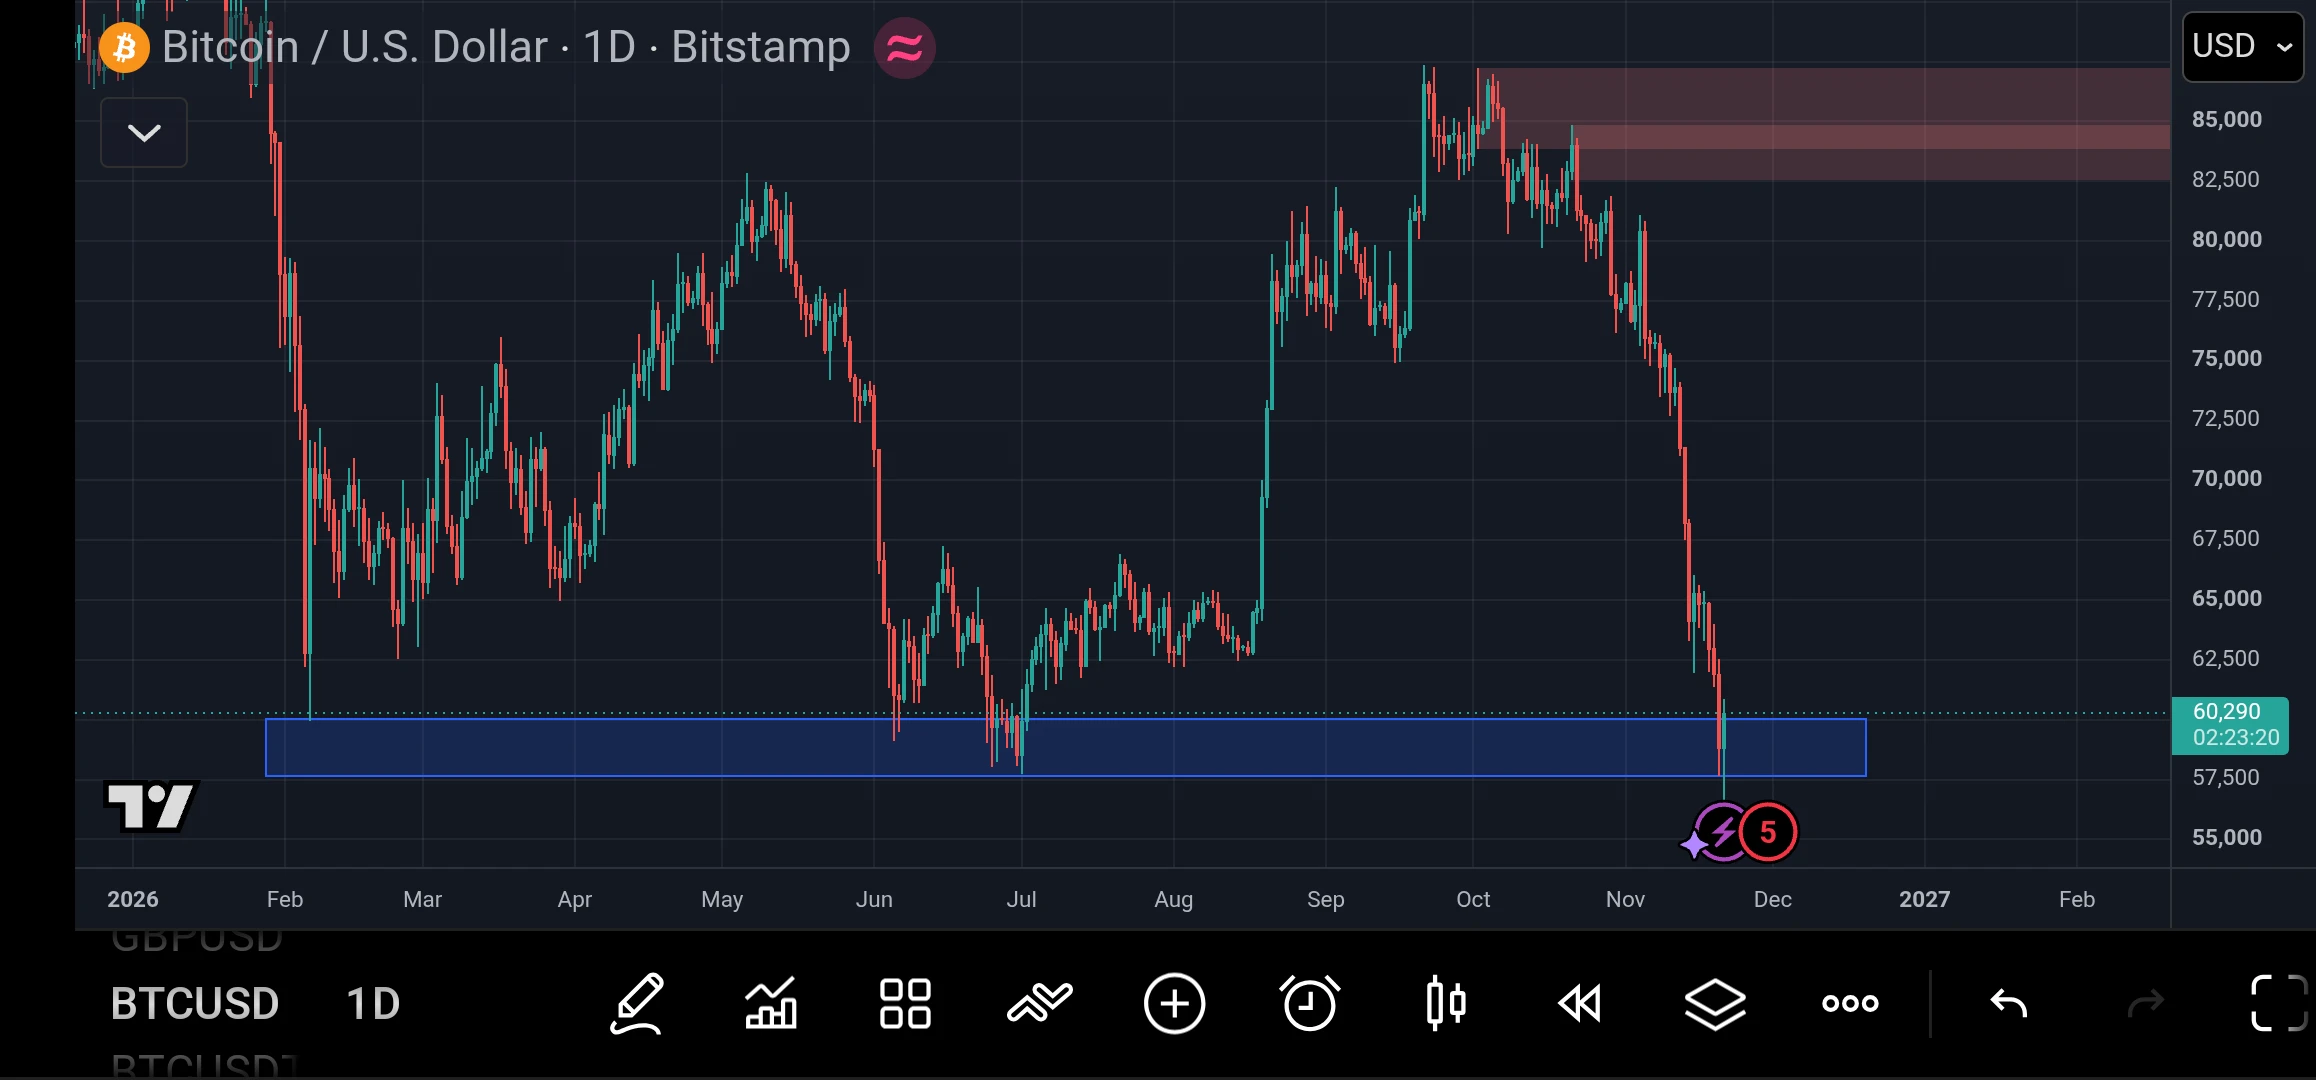
$BTC dipped below $57.5K and bounced to $60.3K. Buyers defended this zone in June and July, but the daily chart still shows lower highs.

I’m watching the daily close. Holding $60K would put $62.5K in play, while reclaiming $65K would give the recovery more weight. A close below $57.5K would leave $55K exposed.

#Bitcoin #BTCAnalysis
post-image
BTC-0.67%
  • 2
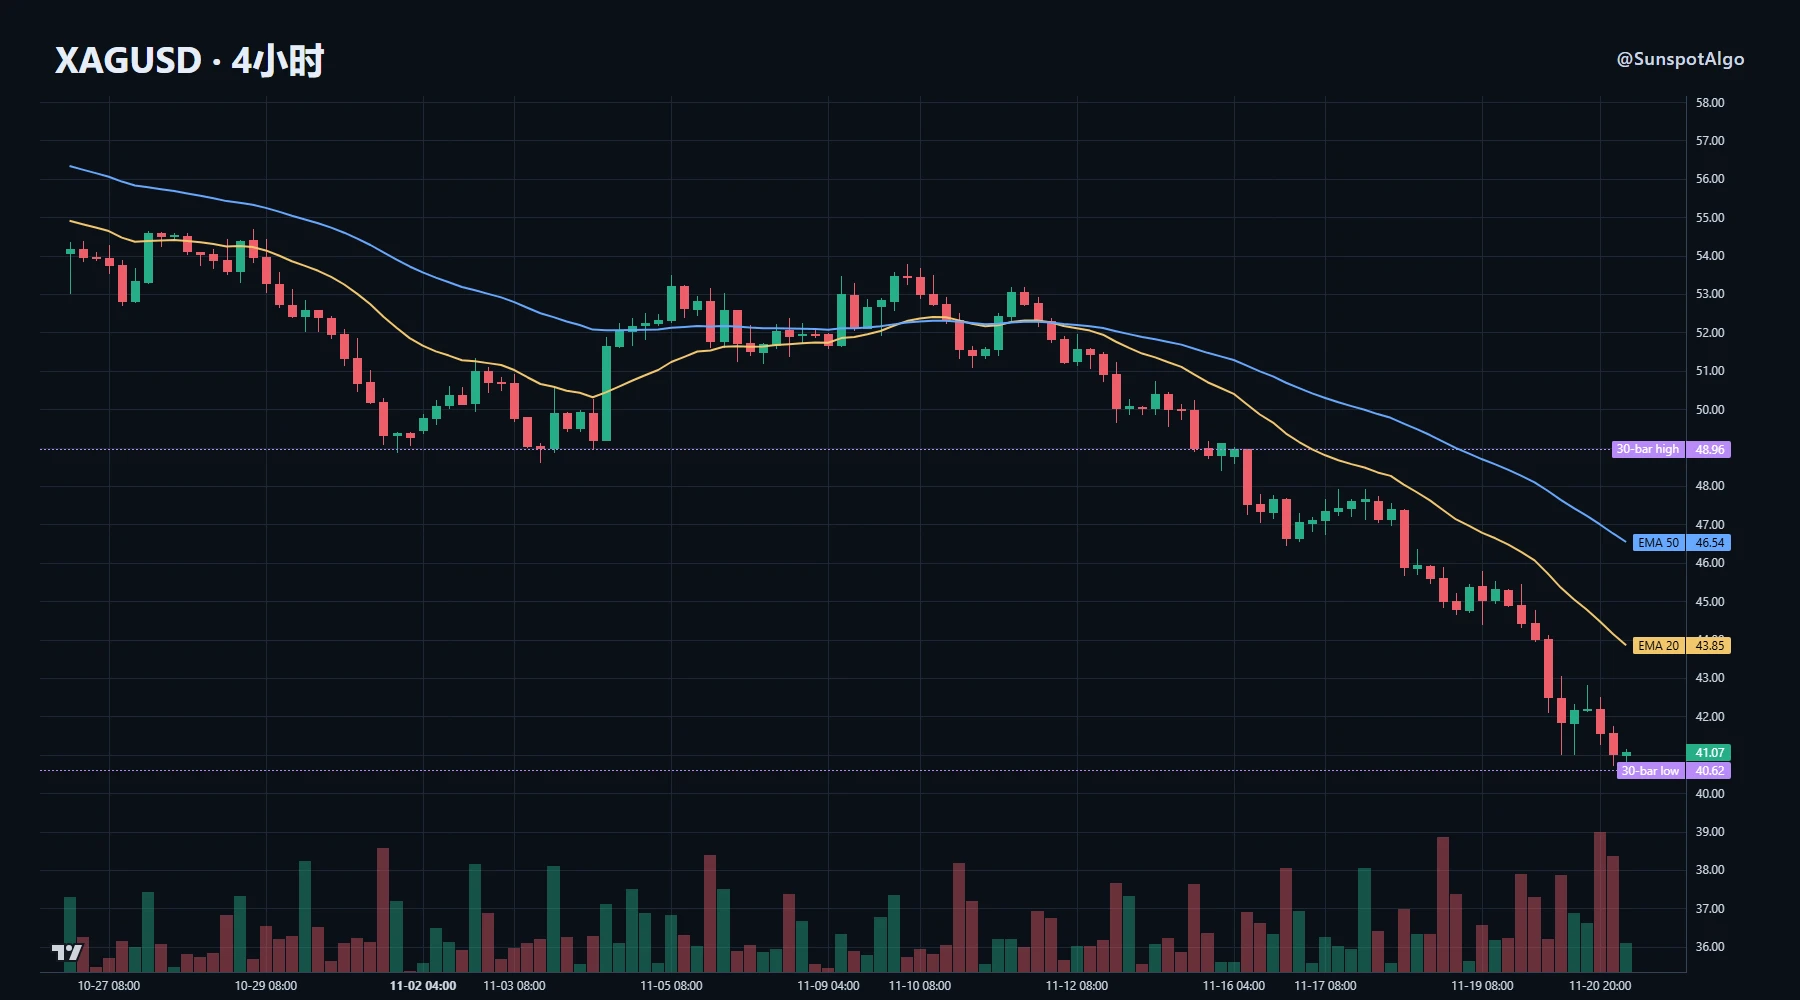
The rhythm of this silver sell-off is more noteworthy than its magnitude.

A roughly 16% drop over 5 days pushed silver to the bottom of its 30-day range at 40.9, while gold fell less than 10% over the same period. The chart’s rhythm has three notable details: the 4H 20-period moving average is at 43.9, while price is at 41.1, a deviation of over 6%; the volume ratio is 1.76, clearly indicating elevated volume; and ATR is at the 92nd percentile of the past 60 candles. The long lower wick around 40.6 was a classic stop-loss sweep: after breaking below that level, price failed to reclaim it, and
post-image
XAG+0.47%
XAU+0.38%
🔹 BTC falls below 58,000 USDT, down 7.75 in 24 hours
live-cover
LIVE45
NVDA-13.84%
TSLA-7.56%
SPCX-7.38%
MU-13.88%
SNDK-15.99%
#NvidiaDropsNearly14Percent

Nvidia shares fell 14%, losing $491 billion in value
Nvidia shares closed Friday down 14.01% at $125.53. News that the SEC is reviewing its accounting practices and selloffs spreading across AI stocks led to a loss of approximately $491 billion in the company's market value in a single day.
The selloff was not limited to Nvidia
Double-digit losses were also seen in semiconductor companies such as AMD and Broadcom during Friday's session. The sharp decline in the Nasdaq showed how vulnerable stocks tied to the AI theme have become to shared risks. Therefore, interp
post-image
NVDA-13.84%
AMD-13.27%
AVGO-12.23%
NDAQ-0.95%
$EVAA Almost 7x now, keep holding and wait for 10x
EVAA-0.49%
Okay, $SKHYNIX , we understand—the resistance level is hard to break through today. You’ve worked hard enough, and it’s time to catch your breath. Let’s see whether you have the strength to keep going or whether it’s time to call it a day. TP: 734.06SL: 796.72Other coins: $ZEC : Current price 786.23 - 24-hour change: +6.28%$PIEVERSE : Current price 3.4076 - 24-hour change: +14.87%
post-image
SKHYNIX+1.41%
ZEC+1.16%
PIEVERSE+0.58%
$SOL Under pressure—is $68 the next target???$SOL It has broken below the rising wedge, suggesting the price could fall further to $70.20; if selling pressure continues, it could even drop to $68. Will bulls defend these levels, or will the price continue to fall???
post-image
SOL-0.77%
Price on MAGMA continues to edge upward on noticeably subdued turnover. Quiet advances like this often struggle to carry through once they test heavier overhead supply.$MAGMA — LONGEntry: 0.2543TP1: 0.2569TP2: 0.2594Stop: 0.2441
post-image
MAGMA-0.57%
  • 1
Open a short position on $SUI . Trade setup: Entry 0.6459 - 0.6491, targets 0.6160 and 0.591, stop loss 0.6686. SUI failed to reclaim local moving-average resistance; price is expected to quickly move lower and retest support below. Note: A strong 1-hour rebound trend could invalidate this short if price reclaims 0.6500. Don't go all in, bro. Position size should suit your own account.
post-image
SUI-1.05%
Load More

Join 40 M users in our growing community

⚡️ Join 40 M users in the crypto craze discussion

💬 Engage with your favorite top creators

👍 See what interests you

Trending Topics

BTCBreaksBelow60K

2.1M Views30K Discussing

BTC fell below $60,000 on November 20 for the first time since July, alongside a tech stock selloff and broader pressure on risk assets. Will $60K become resistance, or can BTC quickly reclaim it? What price or volume signals would convince you that selling pressure is easing?

GateDirectIPOPhase3ANTAllocates92100Shares

794.1K Views4.9K Discussing

NvidiaDropsNearly14Percent

332.6K Views7.6K Discussing

View More