Square
Following
Hot
News
Notifications
Profile
Share your thoughts
placeholder
Article
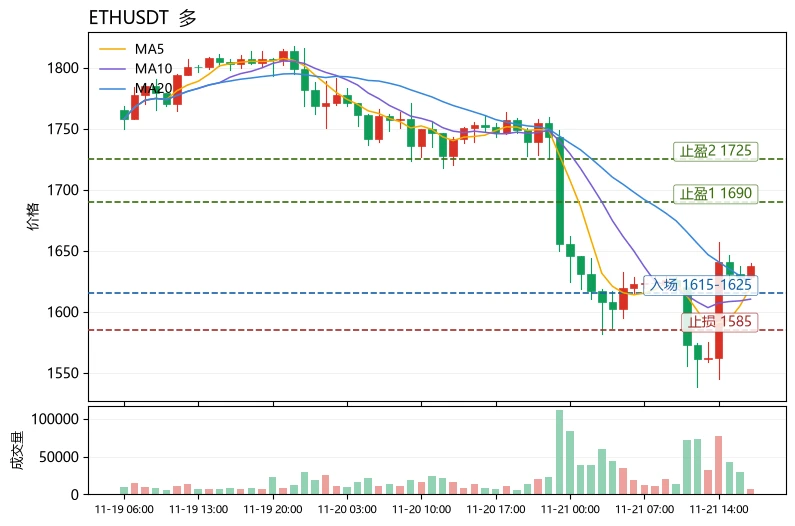
$ETH Short-term bullish, but this is a fragile rebound amid extreme fear and positive funding rates; only buy dips within the range, and don't chase prices higher. Rationale: The current price of 1637.91 is above the MA5 (1619.83), and the MACD histogram at +7.582 remains bullish, but the MA5 is still below the MA20 (1623.51), so the medium-term moving averages have yet to recover; RSI is only 46.6, nowhere near overbought; the Fear & Greed Index at 12 is in the extreme fear zone, with crowded bearish sentiment, which instead makes a short-covering rebound more likely. The key contradiction is
post-image
PEPE+0.97%
DODO+11.43%
Manual laborers these days really have it rough. Working to earn a living is exhausting enough, and then their wives complain about them and put them on blast online. So sad...
Trenches
FIONA
F
bade
b
FIONA
B34n...pump
Market Cap
$.
Change
.
24h Vol
$.
Holders
.
PIEVERSE
P
bade
b
PIEVERSE
0x0e...25a9
Market Cap
$.
Change
.
24h Vol
$.
Holders
.
mihao
m
bade
b
mihao
4Cxj...pump
Market Cap
$.
Change
.
24h Vol
$.
Holders
.
CLAUDIA
C
bade
b
CLAUDIA
2j5S...W2ZM
Market Cap
$.
Change
.
24h Vol
$.
Holders
.
IDOL
I
bade
b
IDOL
0x3b...ab07
Market Cap
$.
Change
.
24h Vol
$.
Holders
.
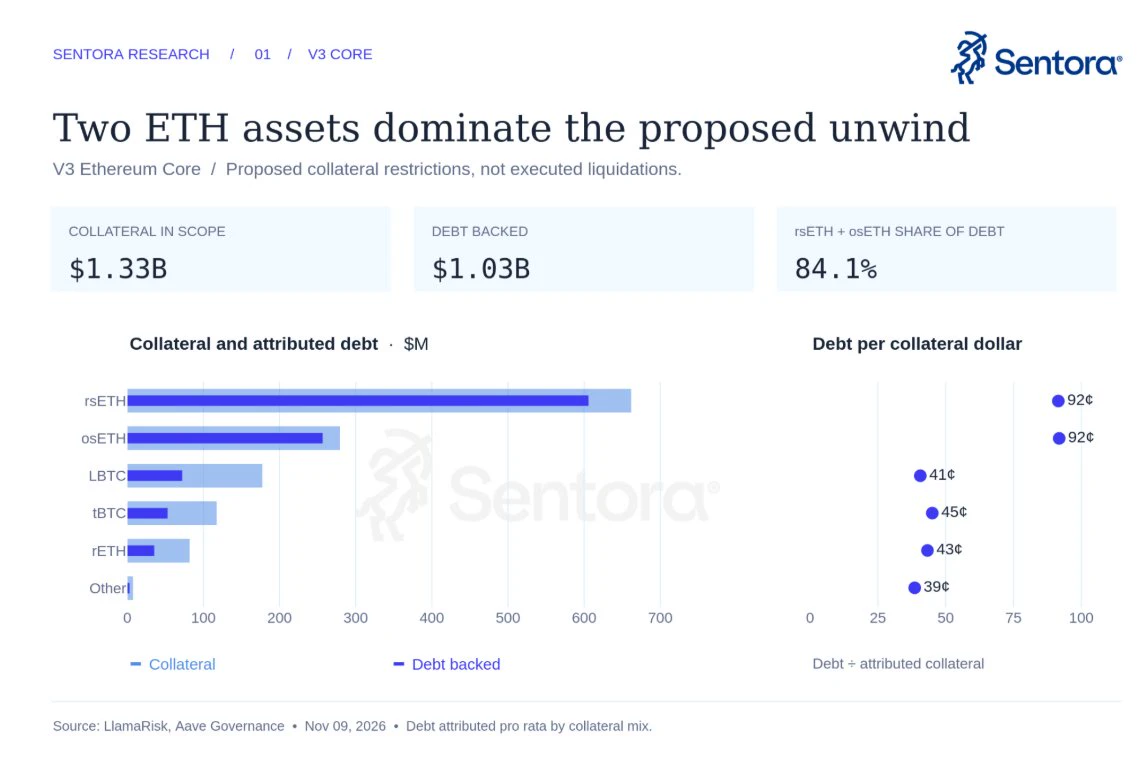
On November 19, Aave voters backed a plan to narrow V3 Core's collateral list.
The assets in scope back $1.03B of debt, and rsETH and osETH account for 84.1% of it. Each carries about 92 cents of debt per collateral dollar, against 39 to 45 cents for the others.
post-image
AAVE-1.22%
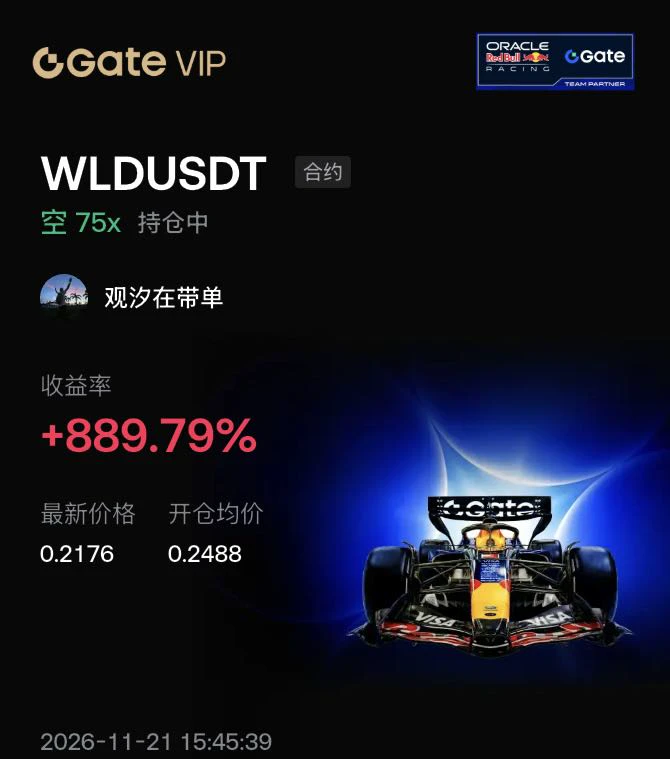
WLD fell below 0.23 to a new all-time low, but that red line on the screen is still laughing—75x short, unrealized profit +889.79%.
$AKE
Nothing fancy in the order book: WLDUSDT is currently at 0.2176, and my average entry price is 0.2488. After stepping down from 0.30, the 20-day and 50-day moving averages are acting as resistance at 0.26–0.28. The MACD death cross below the zero line is widening, and every rebound comes on lower volume—the bearish trend is undeniable.
$SNDK
Entry logic: At the 1-hour candle where the price rebounded to 0.2488, the 5-period and 20-period moving averages had
post-image
AKE+6.39%
SNDK-0.18%
ETH-1.23%
  • 1
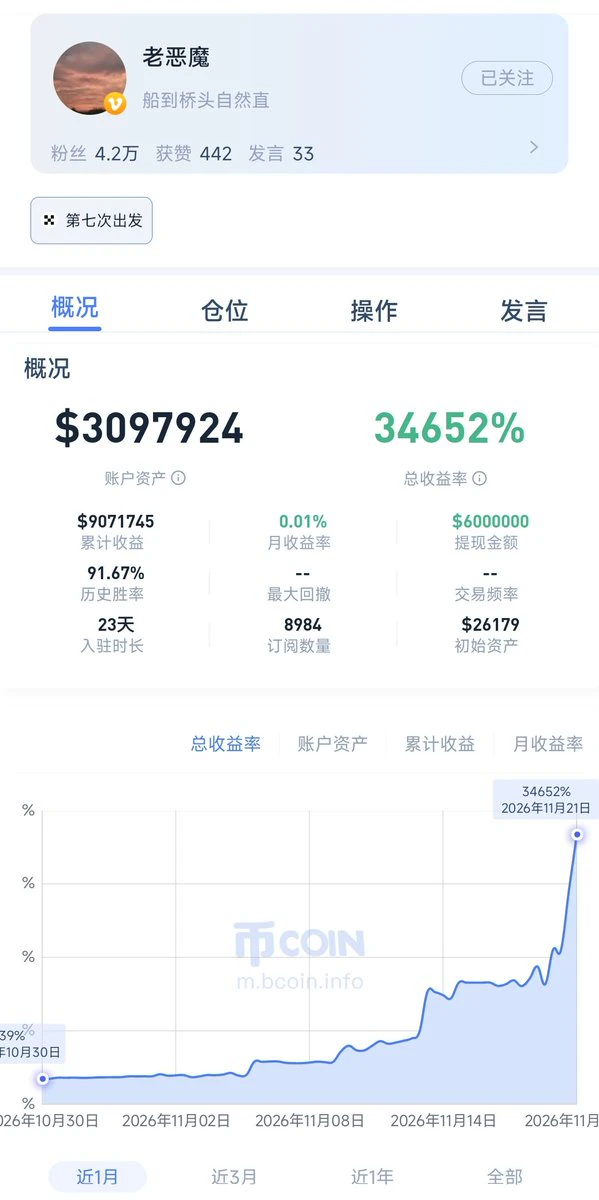
🚀 23 days, 280x.
Starting capital: $26k; account assets now stand at $5.67 million. 💰
Cumulative profits of $7.34 million, with $1.7 million already withdrawn and locked in. ✅
Historical win rate: 75%; 8,496 subscribers. 👀
This isn't a simulated account—it's a live one. 🔥
Making this much comes down to two things:
First, daring to bet. 💪 Shorting all the way down, adding to the position as the price fell, and sticking firmly to his direction. 📉
Second, a favorable market. 🍀 There was barely any meaningful pullback; prices kept plunging, moving perfectly in line with his position. 📉
Ple
post-image
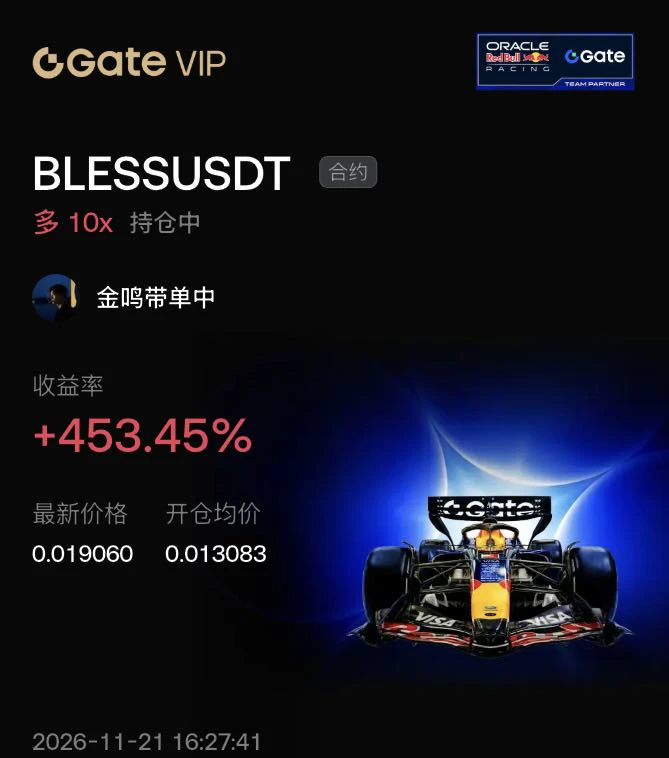
$BLESS Do you understand the outsized profits from a post-breakout supply vacuum?
Let me break it down: At 0.013083, it moved above the previous high, with very little overhead supply from underwater holders. A small amount of aggressive buying pushed it to 0.019060, for a 453% gain.

Prices rise fastest through a supply vacuum. Do you check the overhead supply before trading?$ETH #BTCETF连续三日净流出
post-image
BLESS-2.03%
ETH-1.23%
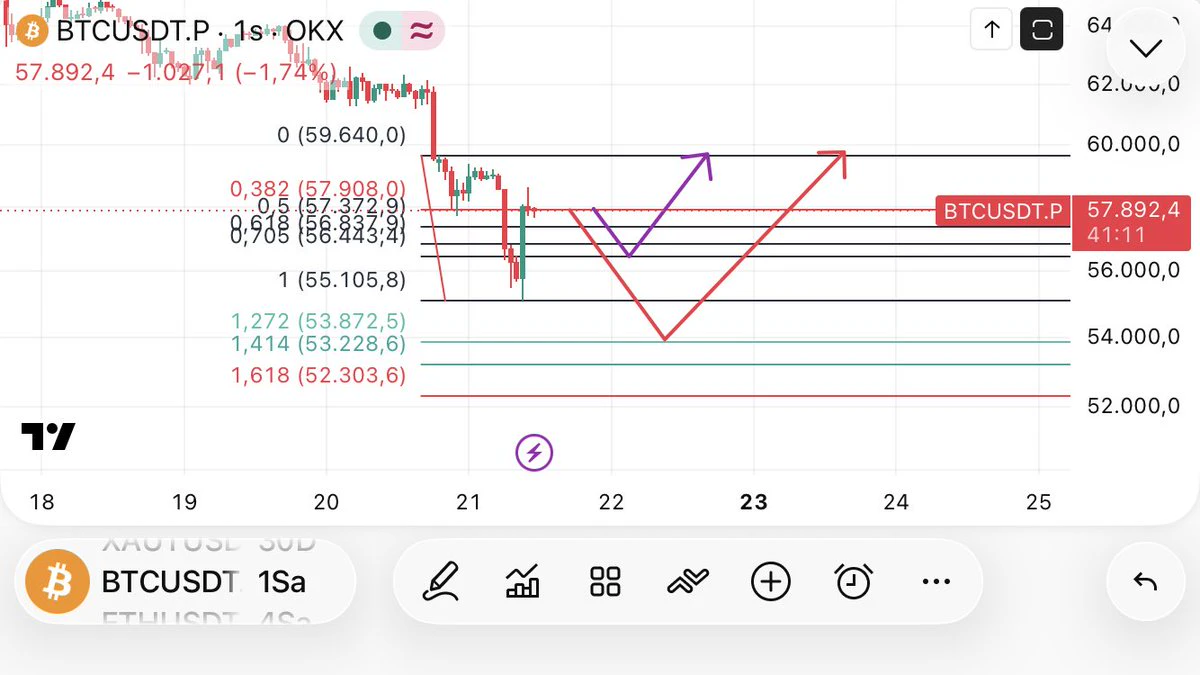
#Btc I indicated the return points in case the potential sale continues.
#Bitcoin #Eth #Ethereum
post-image
BTC-0.67%
ETH-1.26%
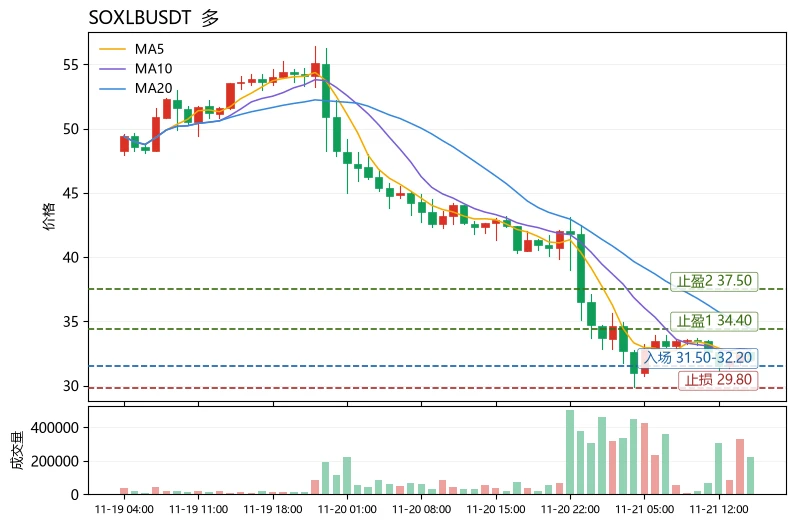
The most unusual detail in today’s market is not the size of the drop itself, but its “character”: $SOXLB$SOXLB plunged 25.30% in 24 hours, with a 44.83% range across 30 candlesticks, yet the MACD histogram has turned positive at +0.2829, and the price of 32 sits precisely between the Bollinger lower band at 27.99 and MA5 at 32.13. In a cross-sectional comparison within the same sector, $SOL fell just 7.02%, with a 12.33% range and a funding rate of -0.0130%, while short crowding is far lower than here;
$EUR fell 0.35%, with a 0.49% range, and was nearly motionless. In other words, $SOXLB c
post-image
eur
eureur
Gate.Fun
MC:$5.55KHolders:3
0.06%
SOL-0.77%
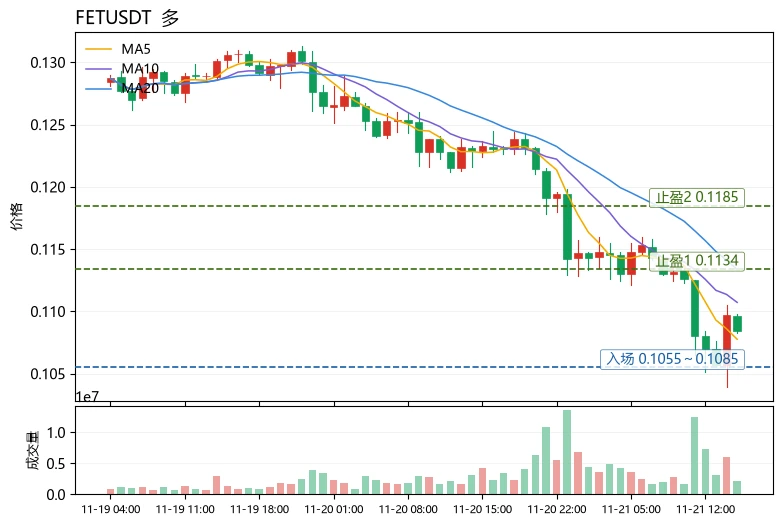
Bottom-fishing when moving averages are in a bearish alignment: opportunity or trap? The answer depends on whether you’re betting on a “deviation” or a “trend”—$FET now offers a textbook case.
First, the method: To judge whether a downtrend is healthy, look at three things. First, moving average alignment: when MA5 is below MA20 and both are trending down, the structure is bearish, and bounces near MA5 often encounter selling pressure. Second, the RSI level: only a drop below 30 counts as oversold; the 30–40 range is merely weak, not a reversal signal. Third, the funding rate: a negative rate
post-image
FET-1.52%
ZRO-2.59%
ADA-1.48%
WHALE ADD 10.2 MILLIONIN LONG SLIVER POSITION
live-cover
LIVE2,736
BTC-0.67%
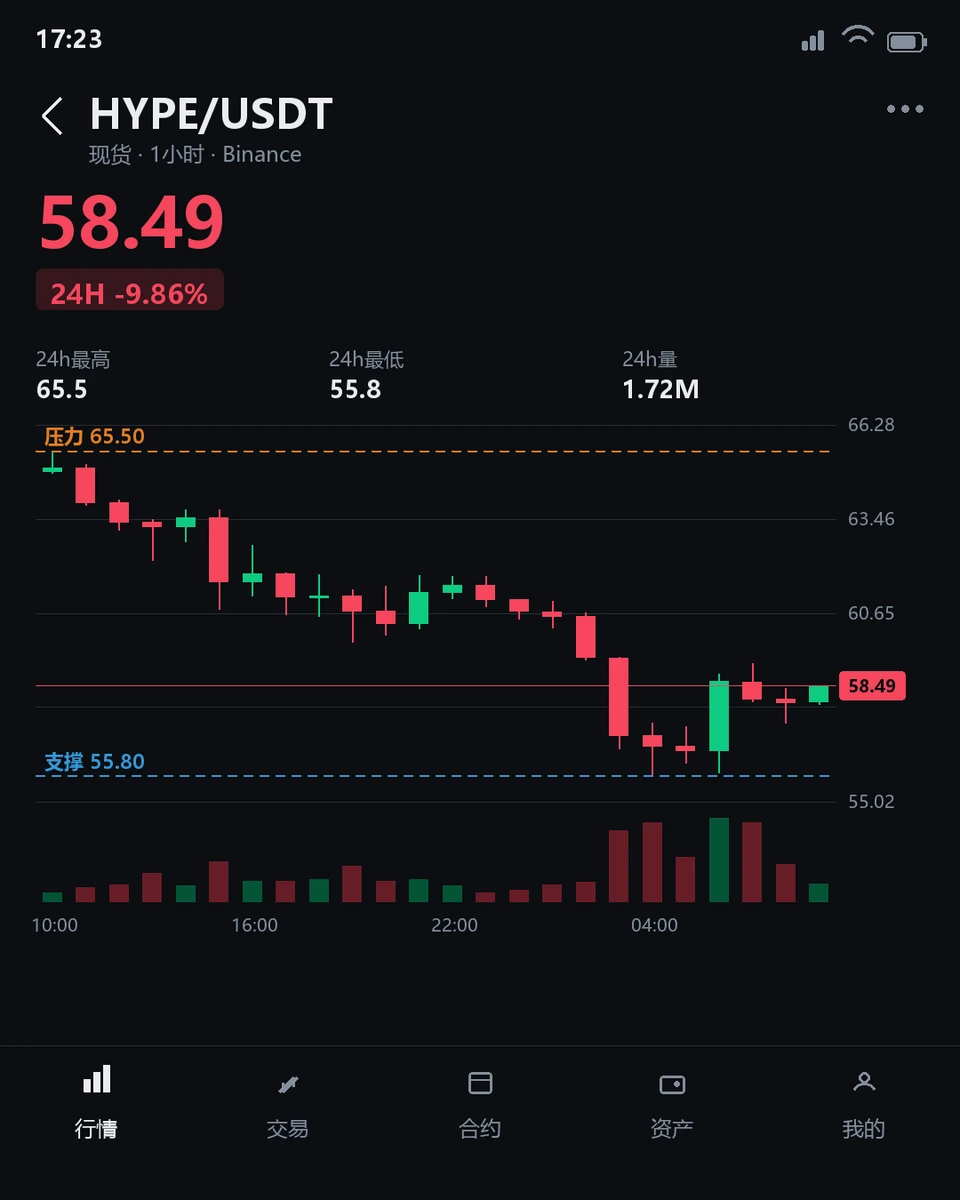
$HYPE Oversold ≠ Bottom: A Clash Between Rebound Demand and Structural Weakness

$HYPE is currently trading at $58.34, down 10.90% over the past 24 hours, with an intraday range of 55.8 to 65.55. The 1-hour RSI14 is 37.51 (neutral to weak), while the 4-hour RSI14 is just 19.99 (deeply oversold), showing a clear divergence between the two timeframes. This structural contradiction reveals the core tension in the current market: the battle between fading short-term momentum and an intermediate-term trend that has yet to bottom.

The key point to watch is that support on both the 1-hour and 4-hour
post-image
HYPE+0.24%
I’ve changed my mind. I used to think a sharp drop meant something was cheap. Now, looking at this chart $SOXL , the 25.4% drop isn’t the point; the point is that it plunged from 43.27 to 29.88 without stopping.
Compare it with assets that slowly grind down, and there are three things to consider. In terms of the drop, losing a quarter in one day is a one-off release of sentiment, not a slow bleed. In terms of volume, the trading value of 8.19 billion shows that some people are buying while others are fleeing; it’s not dead water. In terms of holders, everyone who bought near the top is now un
  • 2
  • 2
$BLESS Now aggressively going long, buying later at $0.052323. Entry price: $0.020642. Long $BLESS 👇
post-image
BLESS-2.00%
  • 1
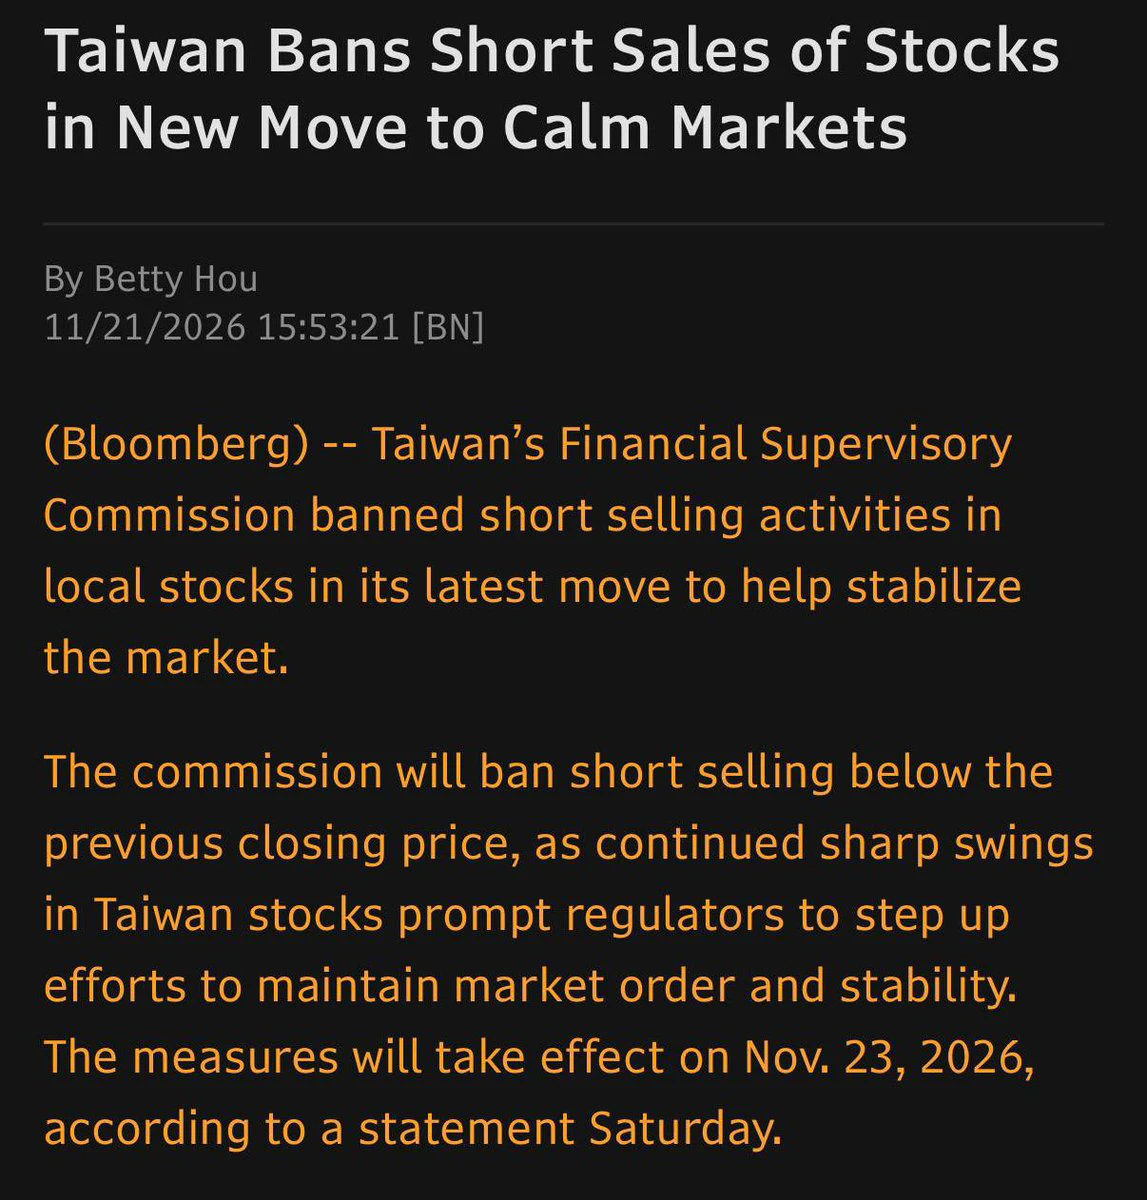
Lol Taiwan is banning all short selling.
post-image
🤖 Delcy Rodríguez ordered efforts to lift the AI ban in Venezuela: full access to ChatGPT, Copilot, and Claude, which are currently restricted for people connecting from the country.
The order was given to Foreign Minister Oliver Blanco: open formal discussions so major artificial intelligence platforms stop displaying the message “not available in your region.” The official demand is access “without any kind of restriction or block,” so Venezuelan youth can develop their own products with these tools and not fall behind the rest of the region.
Here’s the detail few people explain: these bloc
post-image
BTC Falls Below 58,000 USDT, Down 7.75 in 24 Hours
live-cover
LIVE1,541
BTC-0.67%
SOL-0.77%
ETH-1.26%
XRP-1.15%
USDC+0.01%
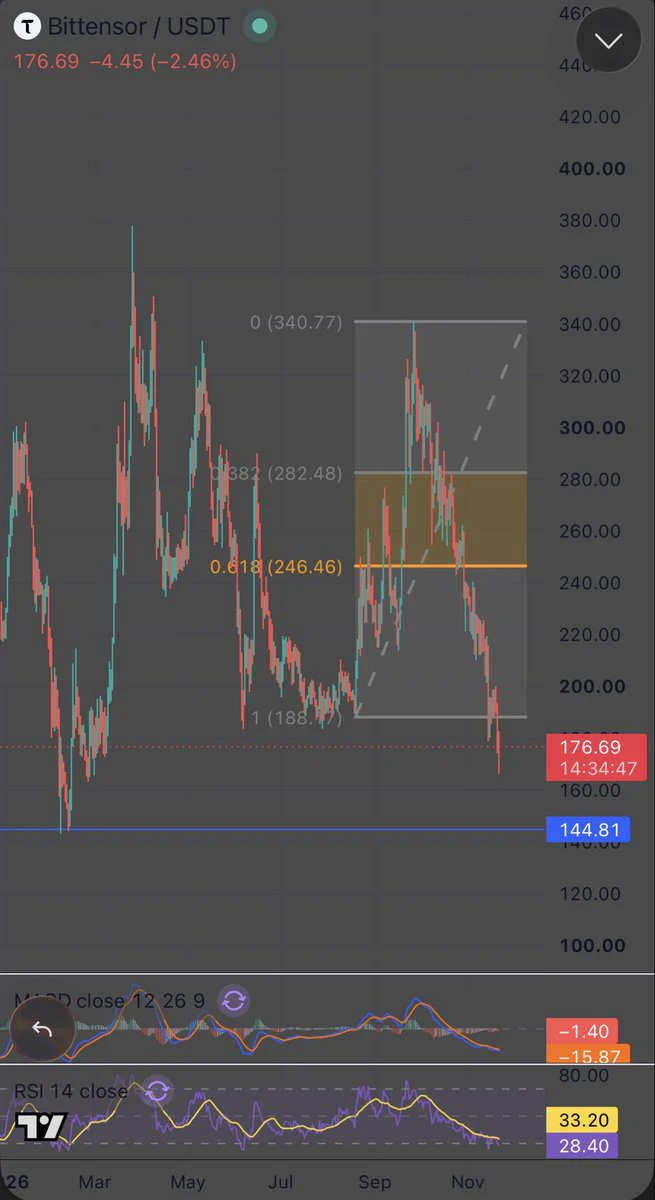
Every $TAO holder who refused to sell at $340 is now asking the same quiet question at $176.
Were you early, or were you just wrong? The chart is about to answer, and it comes down to one level.
$TAO trades near $176 this morning.
The August low that launched the run to $340 sat at $188.
Price is now trading below it, which erases the entire September move.
Here is what most people miss.
A broken floor does not vanish. It becomes the ceiling.
So $188 is no longer support. It is the first wall bulls have to climb.
The map I am working from:
Resistance to reclaim: $188
Target if reclaimed: $246
post-image
TAO+0.41%
‌This week, I chose to observe rather than trade. That is because the market is no longer pricing in direction, but rather pressure. In the latest session, the Nasdaq fell 2.25% to 23,879, while the S&P dropped 2.03%. There isn’t a single piece of news behind this crisis; interest rates, AI-related factors, and liquidity are all tightening simultaneously.

My focus this week has been on metals.

For me, gold is the primary indicator. It is currently hovering around $3,550—down 9% in November and reaching a 14-month low. Silver is trading near $42, having fallen 22% in November. Copper is in
post-image
SPX+0.33%
XAU+0.38%
XAG+0.47%
XCU+0.20%
BTC-0.67%
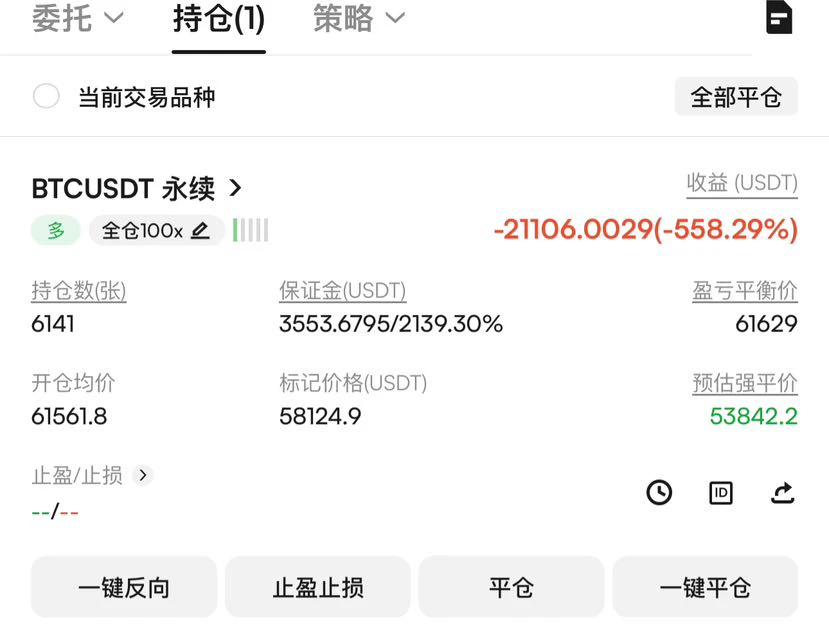
Had to urgently move USDT to save the position; longs are toast.
Let’s see where the weekly candle closes. Today’s volatility has pretty much shaken everyone out.#BTC跌破6万美元关口 #Gate直通IPO第三期ANT配售92100股 #英伟达单日重挫近14% $BTC ‌$ETH ‌
post-image
BTC-0.67%
ETH-1.26%
Long & Short candidates, check the details below ☕️⚠️🐣
#BTCFallsToLowestSinceSeptember
$BTC ‌
BTC-0.65%
  • 1
Load More

Join 40 M users in our growing community

⚡️ Join 40 M users in the crypto craze discussion

💬 Engage with your favorite top creators

👍 See what interests you

Trending Topics

BTCBreaksBelow60K

2.1M Views29.3K Discussing

BTC fell below $60,000 on November 20 for the first time since July, alongside a tech stock selloff and broader pressure on risk assets. Will $60K become resistance, or can BTC quickly reclaim it? What price or volume signals would convince you that selling pressure is easing?

GateDirectIPOPhase3ANTAllocates92100Shares

746.9K Views4.8K Discussing

NvidiaDropsNearly14Percent

313.5K Views7.5K Discussing

View More