Square
Following
Hot
News
Notifications
Profile
Share your thoughts
placeholder
Article
Stake USDT, GT, or XAUT to earn a share of 36 XAUT

https://www.gate.com/share/act/cf2f3f29
post-image
GT-2.41%
XAUT+0.30%
$LIT Long, 3.25 is a key level on the 4H chart 👀 buyers need to defend this area. If it rebounds cleanly, I’ll consider entering; if it closes below, I’ll stay on the sidelines for now. Why this price level matters: - Price on the 4H chart is 3.26, above the EMA50 at 3.24, so the trend is on this side - Daily price is above the EMA200 at 2.77, and the daily trend also supports this view - Stop-loss distance is 3.4%, and the distance to TP3 is 5.5%; if the market continues rising, the risk/reward ratio is about 1.6R🟢 Long entry: 3.248–3.266Take profit: 3.324 / 3.369 / 3.436Stop loss: 3.145No
post-image
LIT-4.56%
Trenches
牛逼
牛
bade
b
牛逼
0x96...7777
Market Cap
$.
Change
.
24h Vol
$.
Holders
.
PIEVERSE
P
bade
b
PIEVERSE
0x0e...25a9
Market Cap
$.
Change
.
24h Vol
$.
Holders
.
STONK
S
bade
b
STONK
6GmA...UNgx
Market Cap
$.
Change
.
24h Vol
$.
Holders
.
BTC
B
bade
b
BTC
C5xp...pump
Market Cap
$.
Change
.
24h Vol
$.
Holders
.
ON
O
bade
b
ON
0x0e...1d48
Market Cap
$.
Change
.
24h Vol
$.
Holders
.
RITUAL Launches CandyDrop, Offering 5,000,000 RITUAL

https://www.gate.com/share/act/3fac150d
post-image
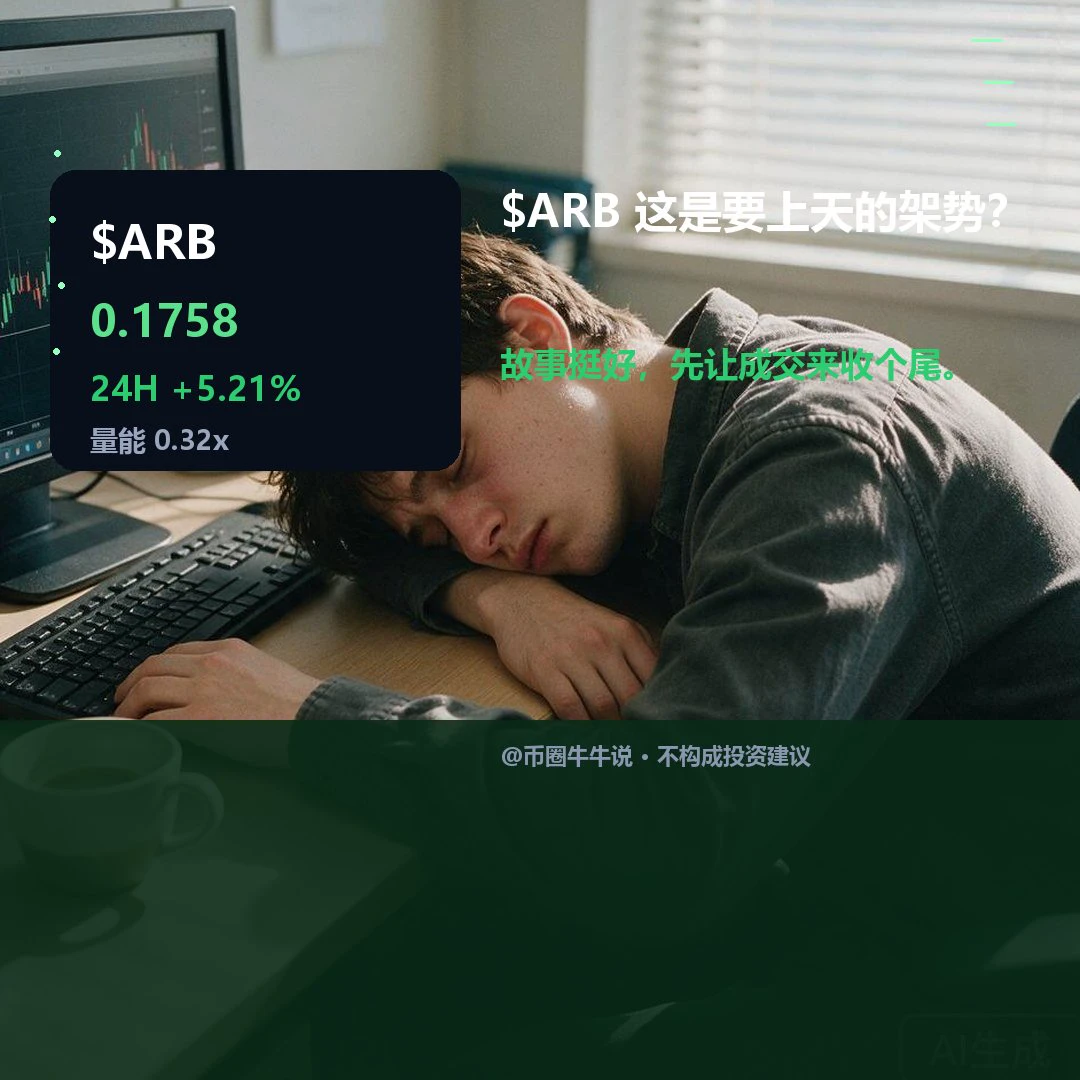
$ARB Currently trading at 0.1758, up 5.21% over 24H. The 1H trend is weak while the 4H trend is strong, showing divergence between the two timeframes. Volume is 0.32x. Holding above the 0.188 resistance could be bullish; a break below the 0.1598 support calls for caution about a pullback. The key point to review is whether holding above 0.188 is valid. The setup is invalidated if the price breaks below 0.1598 support and fails to reclaim it. The market is volatile; for observation only.
post-image
ARB+1.17%
$SOL is currently at 86.74, down 2.59% over 24H. 1H/4H trends are weak, and the 4H RSI is oversold. 1H resistance is 88.46, with support at 85.14; 4H resistance is 91.62, with support at 85.02. If price holds above 88.46 or breaks below 85.14, watch whether volume reaches 0.07 times the 20-candle average. In the review, assess whether the hold above 88.46 is effective and whether price can recover after losing 85.14; volume confirmation is key. Market volatility is high; for observation only.
post-image
SOL-0.77%
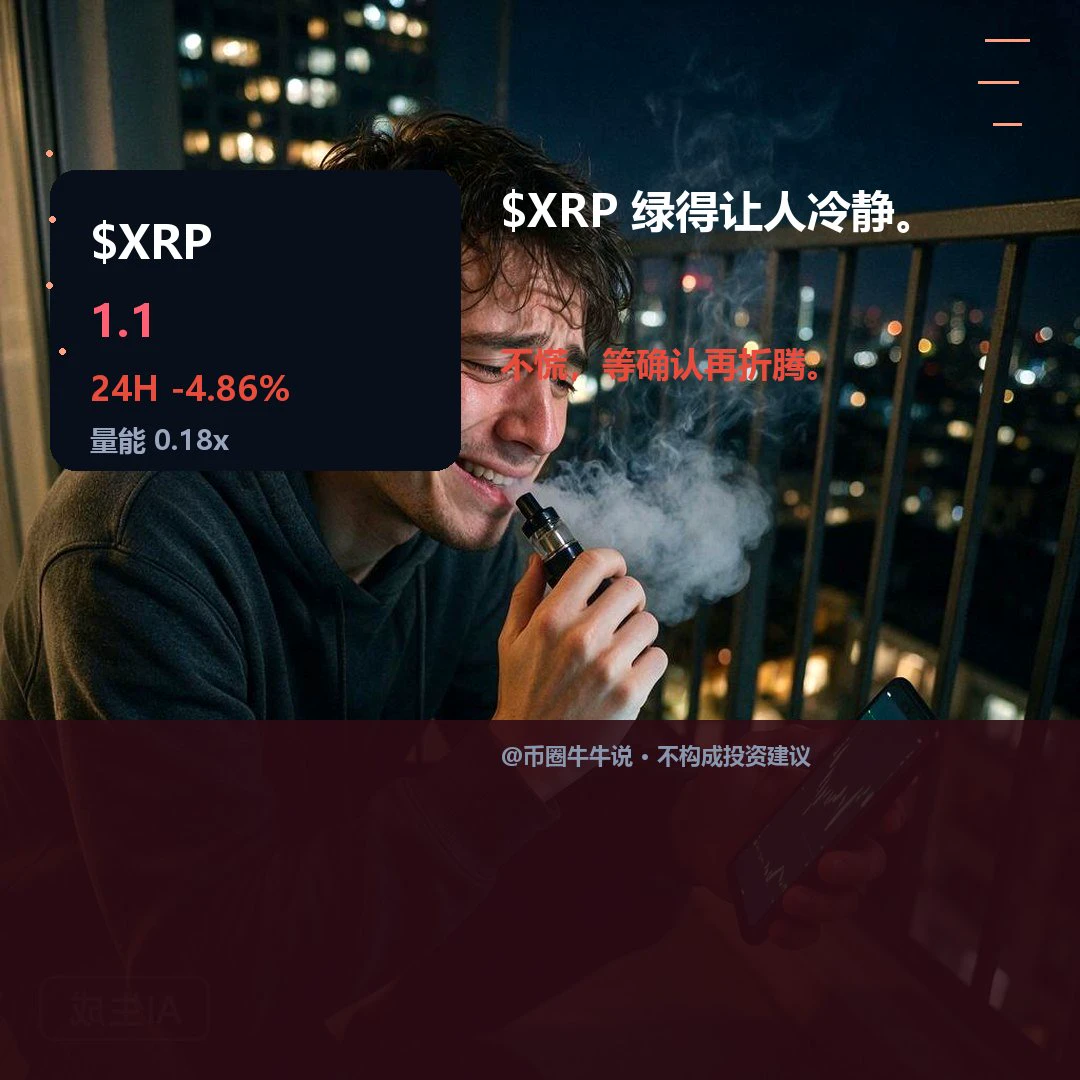
$XRP Currently at 1.0957, down 4.86% over 24H. The 1H and 4H charts are both weak; the 4H RSI is oversold, and moving averages are acting as resistance. Volume is only 0.18x. Holding above 1.1542 could signal a rebound; a break below 1.0764 would indicate further weakness. In review, watch for a failed hold above 1.1542 and a reclaim of 1.0764, with volume confirmation. Market volatility is high; for observation only.
post-image
XRP-1.15%
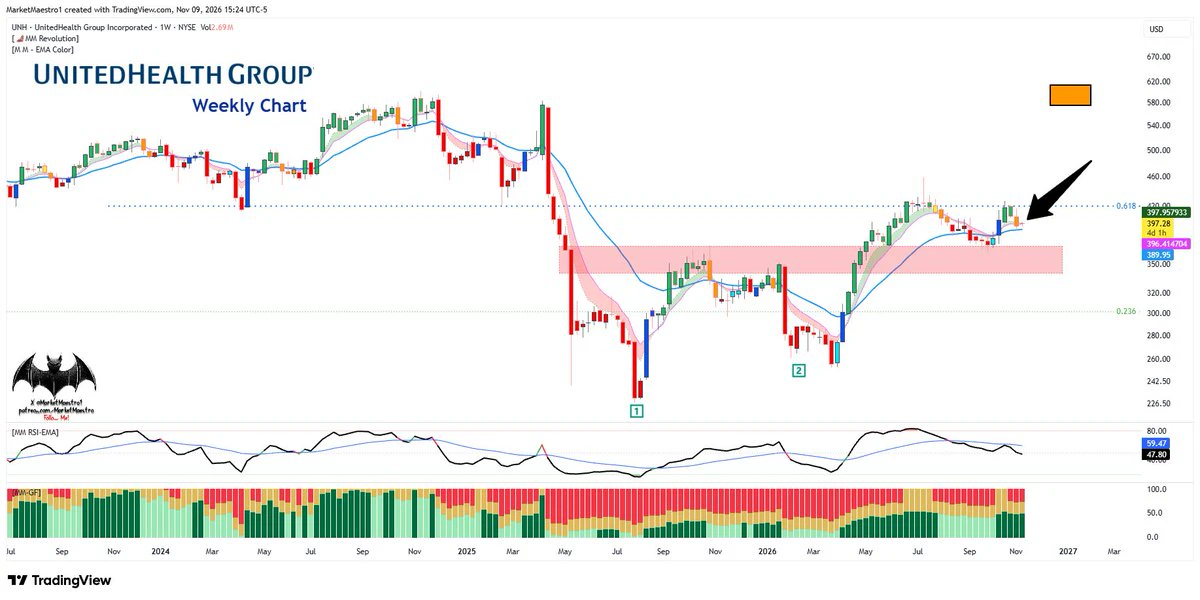
$UNH
Will it form a double top here and go into another correction, or will it form a handle and keep going? I think it could form a handle and continue higher
post-image
UNH+0.86%
$STAMP — Oracle BUG dumped the price by 93% for a WHOLE MINUTE and wiped out my 1x long! 🚨
​Look at this orderbook anomaly: while $STAMP was trading safely at 0.00014, the oracle glitched and locked in a 0.000013 price point right inside the orderbook for about a minute!
​That’s a 13x collapse (−93%) that completely froze and instantly liquidated my 1x LEVERAGE LONG for $2,200. The moment it cleared, the price popped right back to normal!
​Support literally claims: "It's just low liquidity and normal market risks."
​Real traders, look at the screenshot and tell me:
​1. How can a price d
STAMP+52.30%
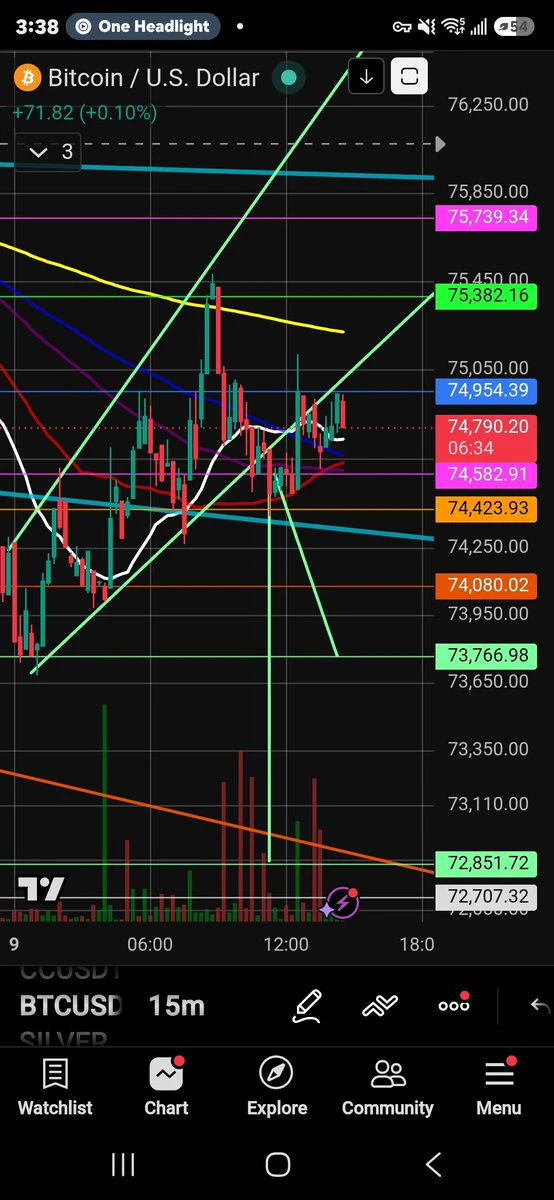
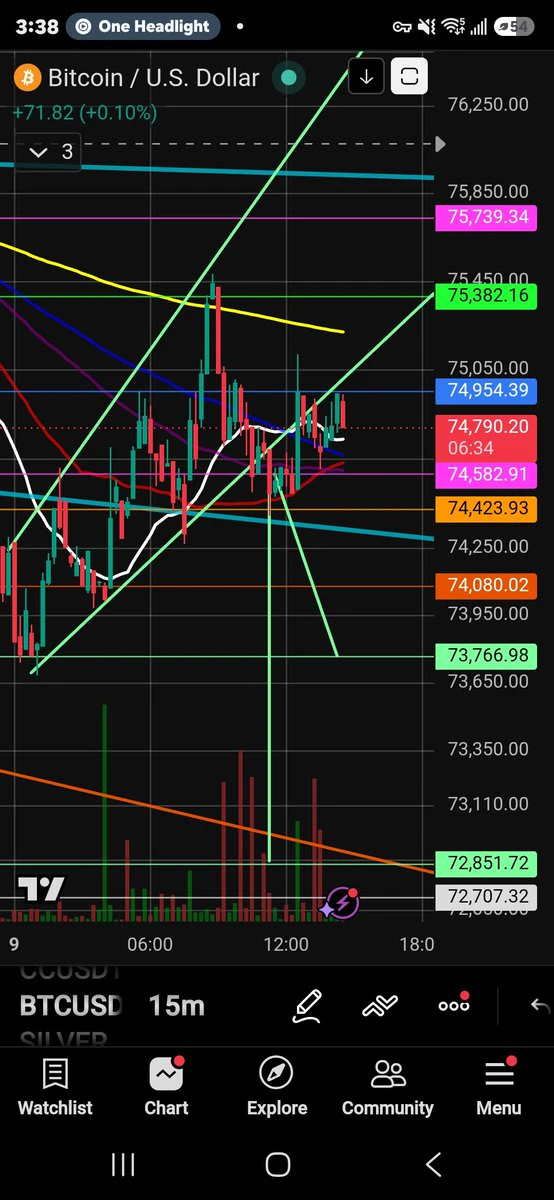
$BTC 1st Bearish Restest Of The Green Rising Wedge Completed 👀
Remember, all of these patterns and meqsured moves in all of the different time frames are going to work together.
So now we're waiting for a retest of the yellow 15 minute 200MA.
We could see a quick move up and back down again. If price action hits the orange trend line and gets rejected.
That could signal a nice, short opportunity back to the bottom of the pattern.
Patience is key.
You don't want to rush your entry. Let the trade come to you.
NFA, DYOR ⚠️
#Crypto #Trading #BTC
post-image
BTC-0.67%
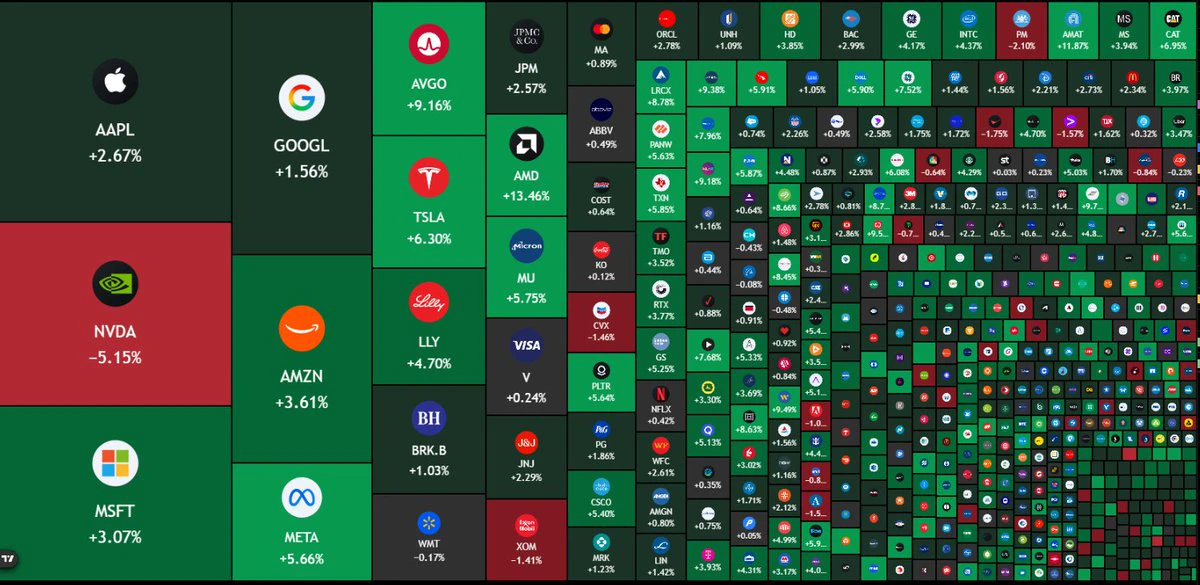
The US stock market added $2,000,000,000,000, $2T today. 🔥🚒🧑‍🚒
Brent -6.41% to $94.5
US Oil $86
BTC 74.8K and Altcoins +1.34%
Soon you will be able to fill up the gas tank and eat meat again.
Do you think a peace deal is close?
post-image
BTC-0.67%
$ETH U.S. stocks are rebounding, U.S. stocks are rebounding, hurry and buy the dip, hurry and buy the dip
ETH-1.26%
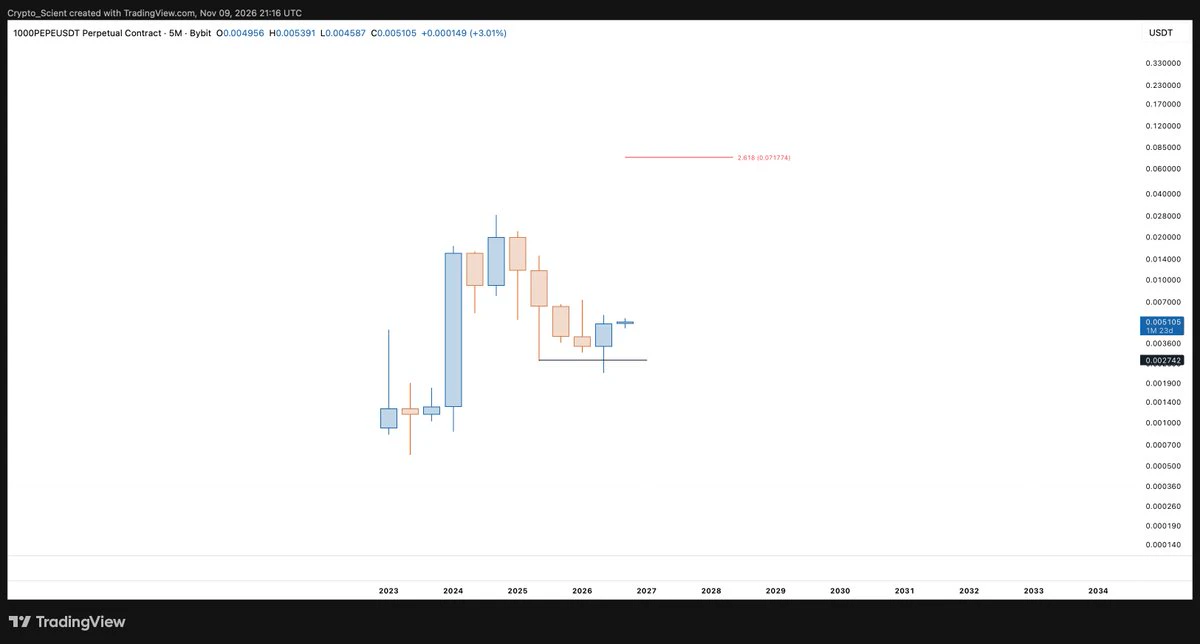
$PEPE , Amidst chaotic charts across the board among altcoins, this one is look very beautiful on macro.
post-image
PEPE+0.97%
With the same 1000U, the outcomes can be worlds apart. Are you getting on the $MVLL ride now or not? It hit a low of 7.94 yesterday and is now at 10.45, with a 24-hour range of 35%. This isn't a candlestick chart—it's a spring-loaded meat grinder.
First, the bulls' case: the current price is 10.45, up 19.84%, with a trading volume of 50.4M. The volume is there, but note the 24-hour high of 10.73—the price is now just 2.7% below the ceiling. That means anyone chasing the rally has the lid that just slammed down right over their head. The bulls' logic is that volume-backed momentum has broken th
AIOT | Long 🟢 | Bullish | 15-minute 24-hour: +1.73% | Volume: 109.7M USDT. Long rationale: Price is above EMA200; EMA20/50/200 are in bullish alignment; RSI14 is 60.1; MACD histogram is positive; ADX14 is 11.4; volume is 0.72 times the 20-candle average; trend pullback/continuation. Entry: 0.16746 Stop-loss: 0.159397 Take-profit 1: 0.177538 | Take-profit 2: 0.183586 | Take-profit 3: 0.191648 Entry price is for reference only; do not chase the price. The strategy is invalidated if the stop-loss level is reached. Technical analysis only; this is not investment advice. $AIOT
post-image
AIOT-2.28%
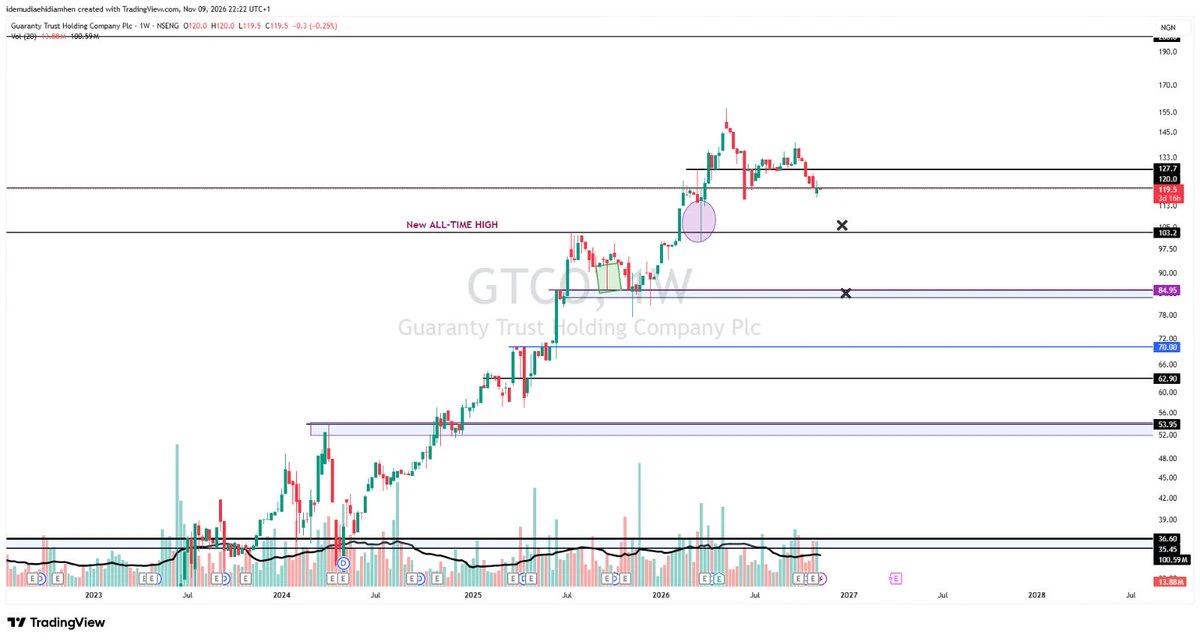
GTCO
I will still leave my GTCO chart unchanged.
All I can say is that it is not looking good for GTCO despite the cross deal from Q2-Q3 2026.
Anyways, the marked zones are the regions investors should keep in mind
#NFA
post-image
$BTC 1st Bearish Restest Of The Green Rising Wedge Completed 👀
Remember, all of these patterns and measured moves in all of the different time frames are going to work together.
So now we're waiting for a retest of the yellow 15 minute 200MA.
We could see a quick move up and back down again. If price action hits the orange trend line and gets rejected.
That could signal a nice, short opportunity back to the bottom of the pattern.
Patience is key.
You don't want to rush your entry. Let the trade come to you.
NFA, DYOR ⚠️
#Crypto #Trading #BTC
post-image
BTC-0.67%
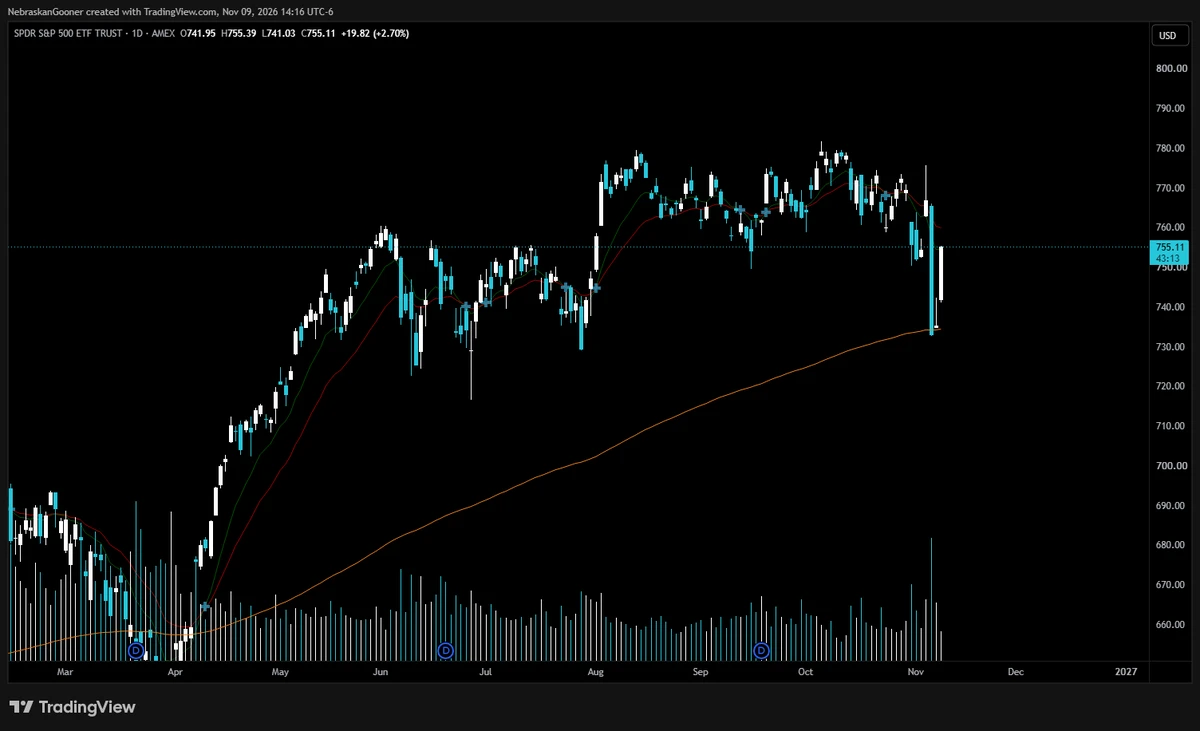
This is exhausting. The stock market just going to bounce then?
$SPY hit key support and bounced hard.
Lots of majors have already reclaimed their breakdowns.
Stocks just go up forever? (Don't get me wrong I'm happy we're bouncing I'm just tired of the chop lmao)
post-image
Democrats Sweep Congress: Is a Major Shift Coming for Crypto? Tighter SEC Oversight and Prediction M
live-cover
LIVE81
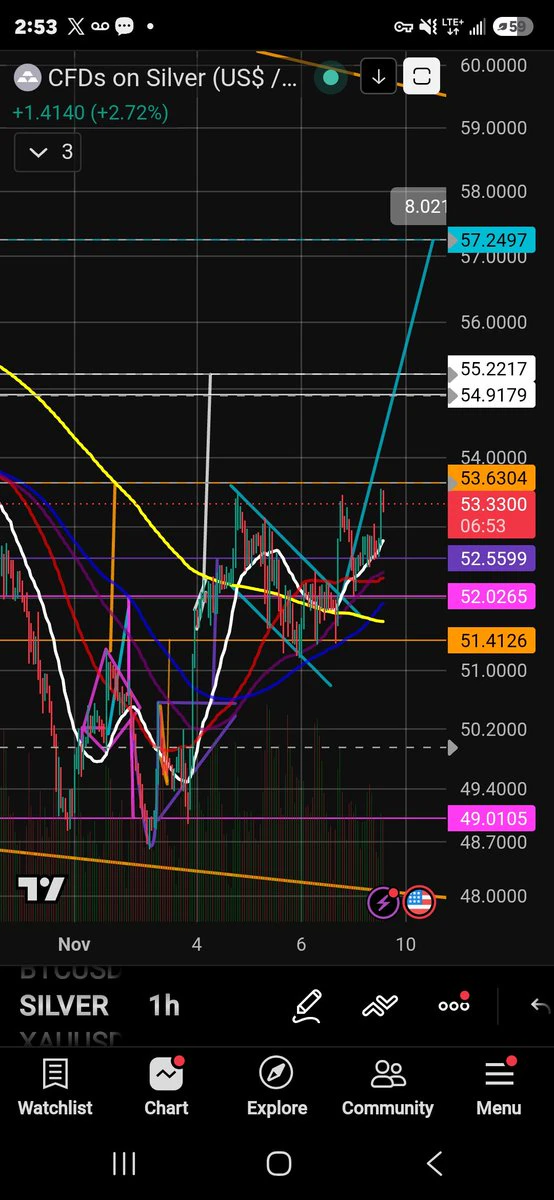
$SILVER Bullish Restest Of The Breakout Appears To Be Complete
Watching the next few targets closely.
$SILVER Targets 🎯
1) $53.63
2) $54.91
3) $55.22
NFA, DYOR ⚠️
#Crypto #Trading #SILVER
post-image
XAG+0.47%
🔹AI Stocks Plunge, but Tech Giants Say Demand Hasn’t Disappeared! Is This AI Sell-Off an Overreacti
live-cover
LIVE34
Load More

Join 40 M users in our growing community

⚡️ Join 40 M users in the crypto craze discussion

💬 Engage with your favorite top creators

👍 See what interests you

Trending Topics

USCPIDataIncoming

44.29k Views2.03k Discussing

The U.S. October CPI report will be released on November 10 at 8:30 a.m. ET. September CPI came in at 3.7% year over year, and markets will be watching closely for signs that inflation is cooling, especially in core CPI. A softer-than-expected reading could strengthen rate-cut expectations, while hotter inflation may pressure risk assets through higher Treasury yields and a stronger dollar. How do you think this CPI print will move $BTC, U.S. stocks and gold?

RedBullDoublePodiumInBrazil

9.98k Views30.59k Discussing

BTCFlashCrash

220.49k Views66.6k Discussing
View More