Square
Following
Hot
News
Profile
Share your thoughts
placeholder
Article
Btc market
live-cover
LIVE1,334
Every weekend is altcoin territory; now even this piece of trash $FIL is catching up with a rebound. Thinking back, this thing was once priced above $200. It bottomed at $0.6 and is now at $1.2, only a twofold rebound. Looks like, at $1, should I buy some spot and hold it? What if it ends up at tens or even hundreds of dollars later on? What do you think?
post-image
FIL+9.16%
BTC MARKET UPDATE
live-cover
LIVE18
10.10 BTC Analysis

Over the weekend, BTC remained range-bound within a narrow box. The one-hour BOLL channel narrowed, with the middle Bollinger band forming a short-term dividing line between bulls and bears. The price repeatedly moved back and forth near the middle band. The previous surge left a long upper shadow, indicating that selling pressure remains overhead. Trading volume failed to expand continuously after the rally, and bullish momentum weakened. The long-to-short position ratio leaned bullish, but new capital inflows were limited, making this a typical low-volume weekend consoli
post-image
BTC+0.25%
$PI Pick up a little spot every day and hold it😂 ‌
post-image
PI-0.28%
  • 1
$RAY bullish alignment remains intact; I only have one bottom line on the -2.3% pullback
$RAY is currently at 2.3483, with a 24h pullback of -2.3%. My judgment remains unchanged: buy the dip, with a bullish outlook.

The daily RSI is strong at 65.0, and MA7 remains above MA30 with the bullish alignment intact; the MACD golden cross above the zero line has only formed for 2 days, and the red histogram has flattened but has not turned green. It has already gained 62.02% over 30d, and the current price is sitting at the 30-day range level of 0.837. This is a pullback in profit-taking, not a tren
RAY-7.86%
Over performing in Ziggs list.
post-image
Ukraine’s president criticized Trump for lifting sanctions on imports of Russian diesel.
post-image
$RAD Current price: 0.327. The nearest resistance above is the Bollinger upper band at 0.3564, while support below is around 0.3247, the confluence zone of the Bollinger middle band and MA20. Among similar candidates, RAD is the only coin with a positive 24h performance (+12.76%), while $OGN
fell 13.81% and $RAY
fell 8.50%. The relative strength gap is clear—this is precisely why RAD deserves separate attention: capital is visibly favoring RAD within the sector.
Technical breakdown: MA5=0.3286 has moved above MA20=0.3247, indicating a bullish short-term moving-average structure; RSI=53.4 is
post-image
RAD+19.47%
OGN-21.26%
RAY-7.86%
#余币宝USDT享11%年化 #每周来晒
Skip this and you could miss out on 100 million—holding the same USDT, why can others earn twice as much interest?
There is a misconception in the investment world that money is wasted if it is not invested, so everyone spends day and night watching the market and drawing candlestick charts, only to end up with less money the more they trade. Little God of Wealth wants to say: stop watching the market every day. Smart people allocate their funds flexibly, allowing their money to generate returns while sitting in their accounts, without missing the chance to enter when th
post-image
$ENA Short-Term Shift: Why Has the 4-Hour Chart Still Not Capitulated?
$ENA 24-hour +3.30%, current price 0.2189. On the surface, this is merely a rise and fall, but the real conflict lies in the timeframes: the 1-hour chart is relatively strong, while the 4-hour chart is relatively weak. When two charts give opposing answers, the least useful approach is to pick the one you prefer and believe it completely.
Let’s return to the 24-hour range: low 0.2104, high 0.2212. Where the current price of 0.2189 sits within this range directly affects the meaning of the same signal. Near the high, strengt
post-image
ENA+3.15%
In trending markets,
everyone knows that catching one trend correctly
can make up for all previous losses
But the hardest part is
when facing market uncertainty
giving up execution for fear of being stopped out,
so after executing the first few times,
you fail to execute just once,
and miss the main upward wave,
This may be the pain of many
trend traders (myself included)
But Dongbi Cat's approach is very simple,
When you believe the market is in a major trend,
tell yourself to execute firmly,
hold on to the mindset that “it is better to be wrong,
than to miss out,”
The great path is simplicit
post-image
Featured10.10 Weekend Morning Market Overview: Weekend range at 82.5K; beware of false bullish signals
BTC formed a bullish candle with a long upper wick this morning, ending a four-day losing streak on the daily chart
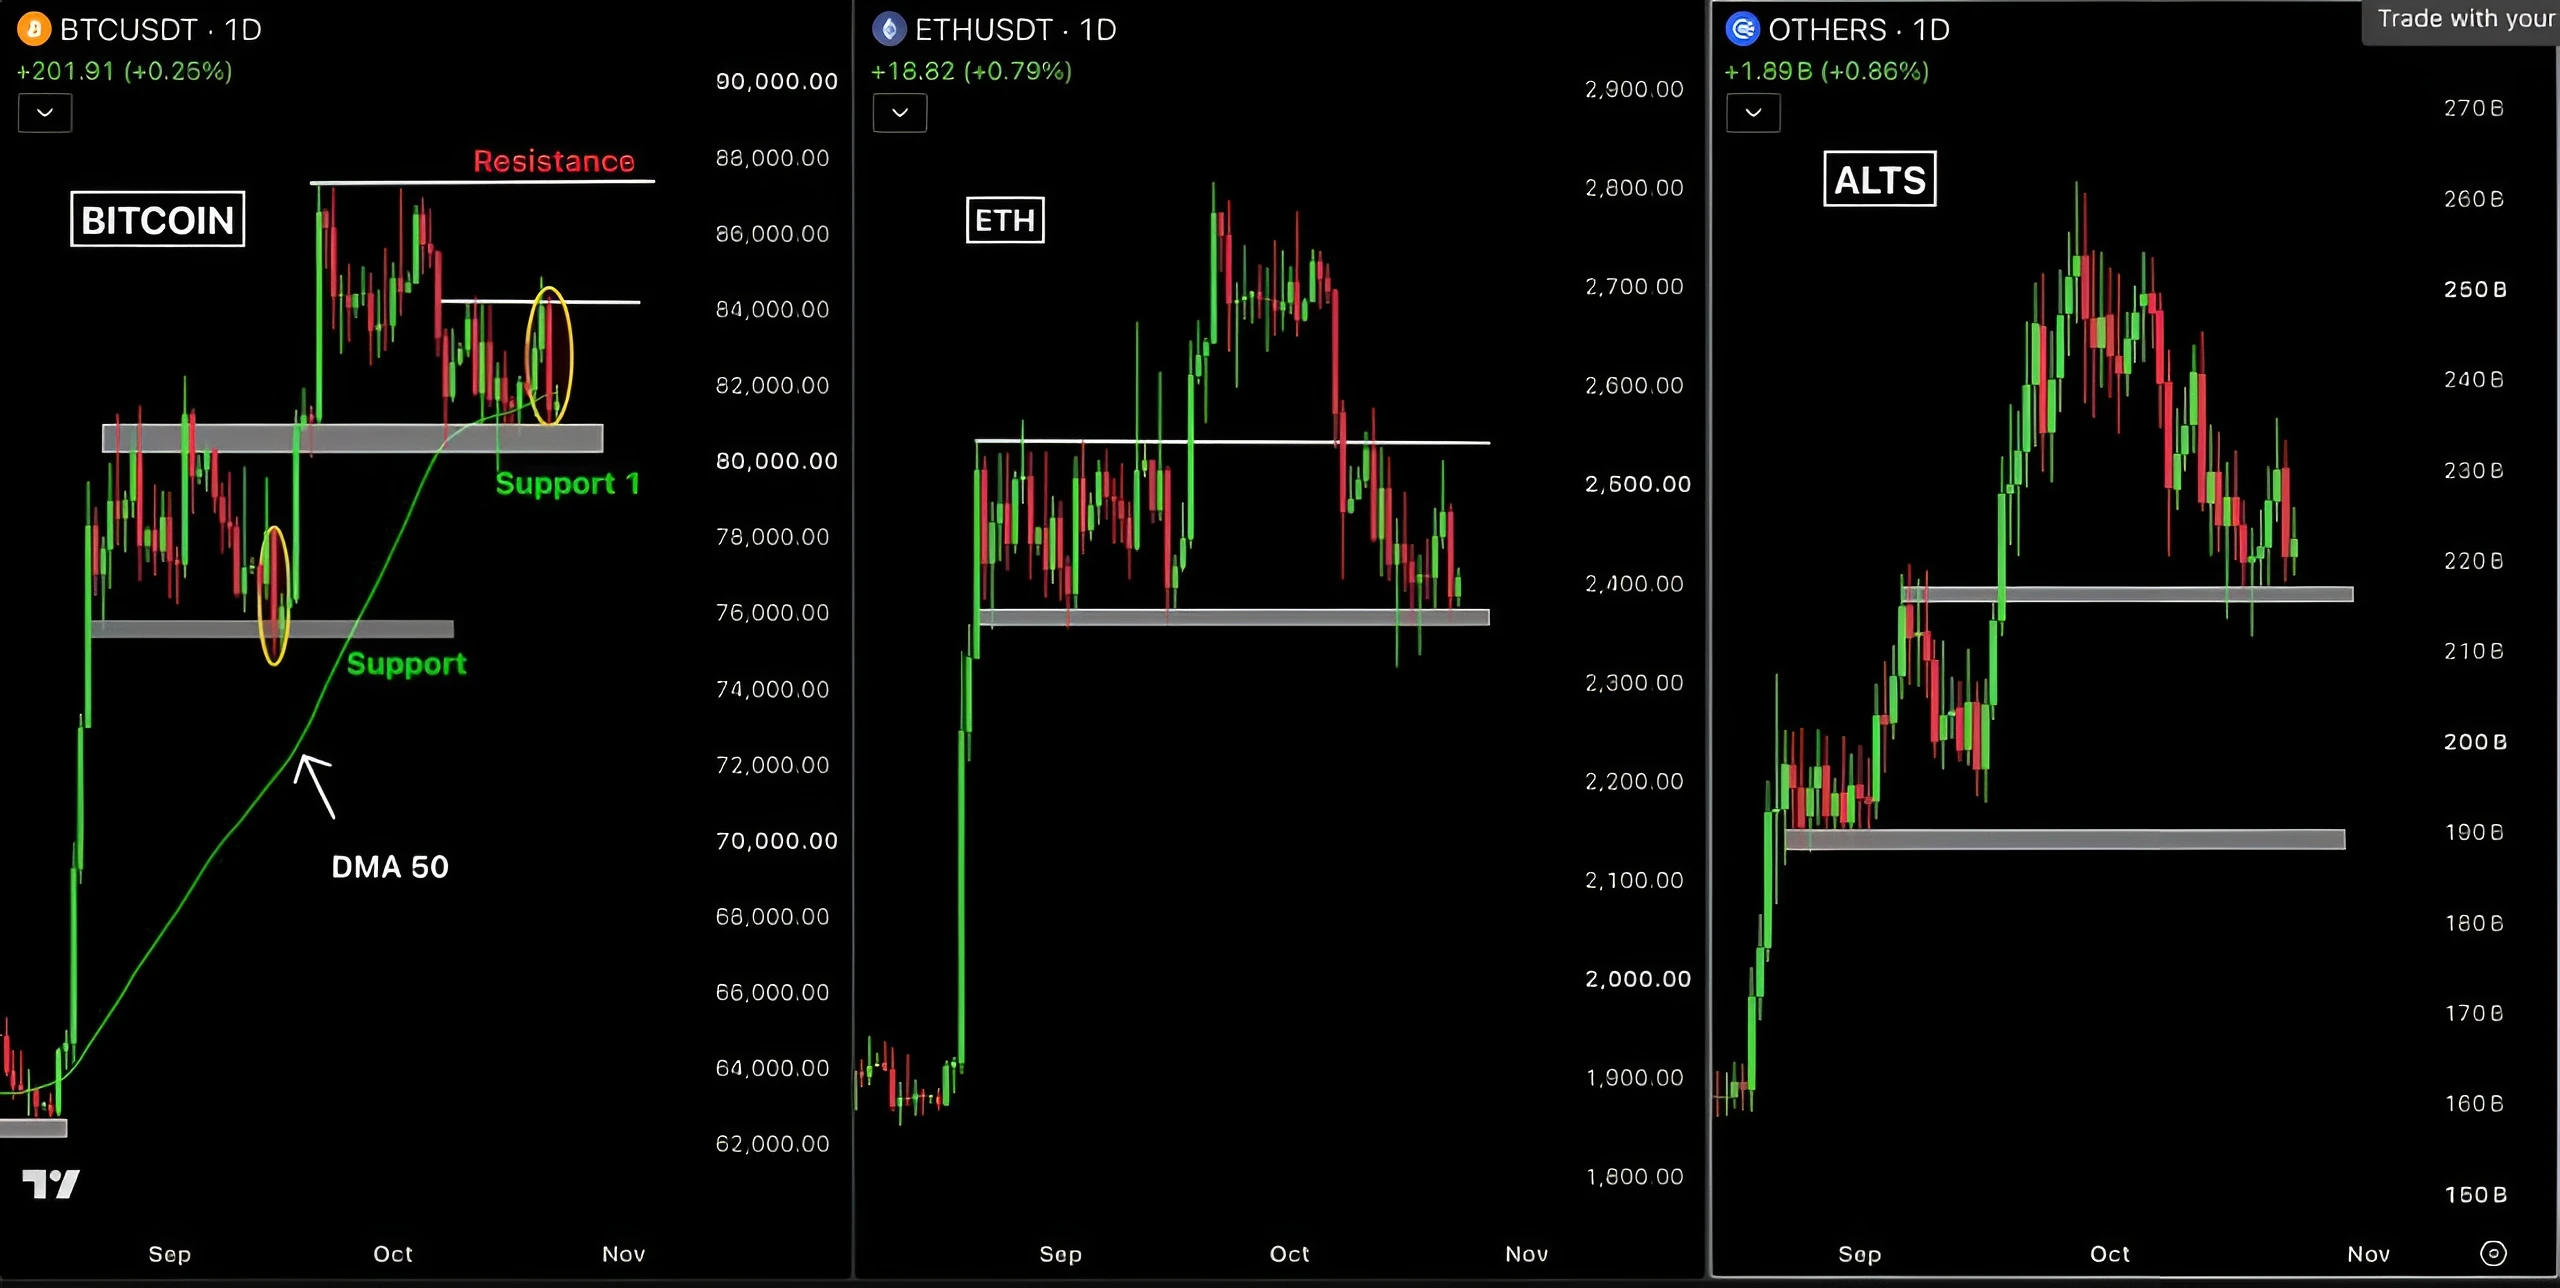
BTC wicked down to 80.3K before rebounding rapidly, and is now ranging around 82.5K, awaiting a signal
82.8K was previously a support level for repeated long positions. With support and resistance switching, the former support has become resistance. BTC will only return to the familiar trading range after breaking through and stabilizing above 82.8K; once confirmed, prioritizin
post-image
BTC+0.22%
  • 8
Are delivery drivers all this impressive now?
This couldn’t be a task assigned by the owner, could it?🫣
post-image
The most unusual detail in today’s market action is not on the top gainers list, but in $ZEC
: 24h trading volume was 145.6M USDT, 3.8 times that of $ADA
and 2.5 times that of $STRK
, yet the price closed down 0.62%, underperforming the two rising tokens in the same sector. Increased volume with a stagnant price indicates that selling pressure was absorbed rather than that capital exited.
Structurally, $ZEC ’s MA5=1212.95 remains below MA20=1218.85, so the short-term moving average has not recovered; however, the MACD histogram has turned positive at +0.1803, RSI=47.7 is in the neutral-to-wea
post-image
ZEC+0.09%
ADA+6.38%
STRK+4.17%
Good morning, recap
OP surged today and recovered my losses; now only the NVIDIA short remains
Still bullish on OP, feels like at least $0.5 to $1
NVIDIA short entry price around $200
Stay the course
post-image
OP+16.22%
NVDA-0.52%
The three major doomed Layer 2 projects have all pumped. Starknet ( ethereum:0xca14007eff0db1f8135f4c25b34de49ab0d42766 ) is considering breaking away from Ethereum’s L2 architecture and transitioning into an independent L1, striving to become a fully quantum-resistant public chain by 2027.
ZKsync ( $ZK ) teased that good news may be announced. Optimism ($OP ), a Layer 2 network developed by Uniswap, plans to migrate its testnet to OP Enterprise on October 13.
$ARB benefited from the Robinhood chain hype early on but has yet to move in this round; the rotation-driven gains in the secondary ma
post-image
STRK+4.17%
ETH+0.02%
ZK+16.81%
OP+16.22%
ARB+4.32%
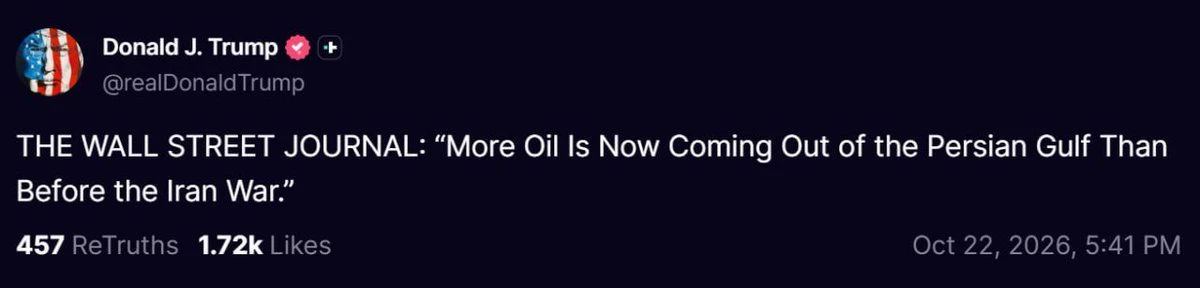
GM. Today my radar is locked onto two mutually constraining events—the geopolitical risks surrounding oil and the Federal Reserve’s policy path, because their trajectories are becoming deeply intertwined.
Oil: Supply has recovered, but the risk premium hasn’t gone away. Brent crude rose 2.42% this week, settling near $104.72 per barrel; WTI crude stood at $91.85, up 0.81% for the week. Middle Eastern oil flows have recovered to roughly 80% of pre-conflict levels, with crude exports exceeding pre-war levels on 4 days during the final week of September. But the risks have not subsided—crude flow
post-image
BZ+0.30%
GS+1.56%
  • 5
#CRCL领涨加密股 10/9 CRCL’s rise was driven more by sector beta and Bitcoin stabilizing than by Mizuho Bank’s rating news itself.

Facts from 10/9
- CRCL closed at $84.51, up 4.54%, with a wide intraday range of $80.40–$87.60, a market cap of $21.455 billion, and a P/E (TTM) of approximately 47.5.
​- The sector strengthened broadly but diverged internally: Coinb +5.90% and Block +2.93% led gains, while miner MARA weakened by 3.32%—capital favored “trading platforms + stablecoin issuance” over “miners,” and all three major indexes also closed higher.
​- Sector volatility was extreme this week: cry
post-image
CRCL+4.51%
  • 3
As of October 2026, Bitcoin is priced at approximately $85,000–$87,000, down about one-third from its all-time high set in October 2025. Despite experiencing a trough early in the year and sharp volatility midyear, Bitcoin has rebounded more than 40% from its yearly low and formed a “golden cross” in which the 50-day moving average crossed above the 200-day moving average, a technical pattern generally regarded as a sign of improving long-term momentum.
II. Price Forecasts from Major Institutions
Several Wall Street institutions have recently made frequent adjustments to their Bitcoin price ta
BTC+0.66%
Load More

Join 40 M users in our growing community

⚡️ Join 40 M users in the crypto craze discussion

💬 Engage with your favorite top creators

👍 See what interests you

Trending Topics

GateAtTOKEN2049

38.25k Views21.27k Discussing

Gate brought a series of major events to TOKEN2049 Singapore! From the official launch of Gate Money to the F1 Red Bull driver meet-and-greet and the Gate Gala, we witnessed a new chapter of "One Gate, Borderless Finance." Which moment from TOKEN2049 stood out most to you?

LedgerLossesNear90Million

38.27k Views101 Discussing

GateWCTCS9GlobalTradingCompetition

33.08k Views4.5k Discussing

View More