Share your thoughts
placeholder
Article
This $ARB trade was executed relatively steadily, using a scaled take-profit strategy. The entry premise was simple: the higher timeframe was still in a bullish structure, while the lower timeframe had merely experienced a rapid shakeout, trapping those chasing shorts before quickly recovering. I judged this to be a shakeout rather than a reversal, so I opened a long position at a key panic level. After the market validated the setup, I did not rush to exit everything, but first took profit on 80% to lock in the existing unrealized gains, while tracking the remaining position with a protective
post-image
ARB-11.71%
SOL-1.07%
BNB-0.71%
I originally only wanted to mooch a free breakfast, but the market ended up wrapping me in dumplings for half a year🥟. A few days ago, in the early morning, $BTC /BTC was still grinding around that level, while buying pressure was quietly strengthening. I went straight long without hesitation.

Now the bullish thesis has played out crystal clear, with the price climbing from 78760.0 all the way to 79267, locking in +109.61%. Feeling great, brothers—the harder it grinds beforehand, the more satisfying the breakout.

Taking 75% off first, and placing a cost-basis protection order for the remai
post-image
BTC-0.69%
BNB-0.71%
XRP-0.20%
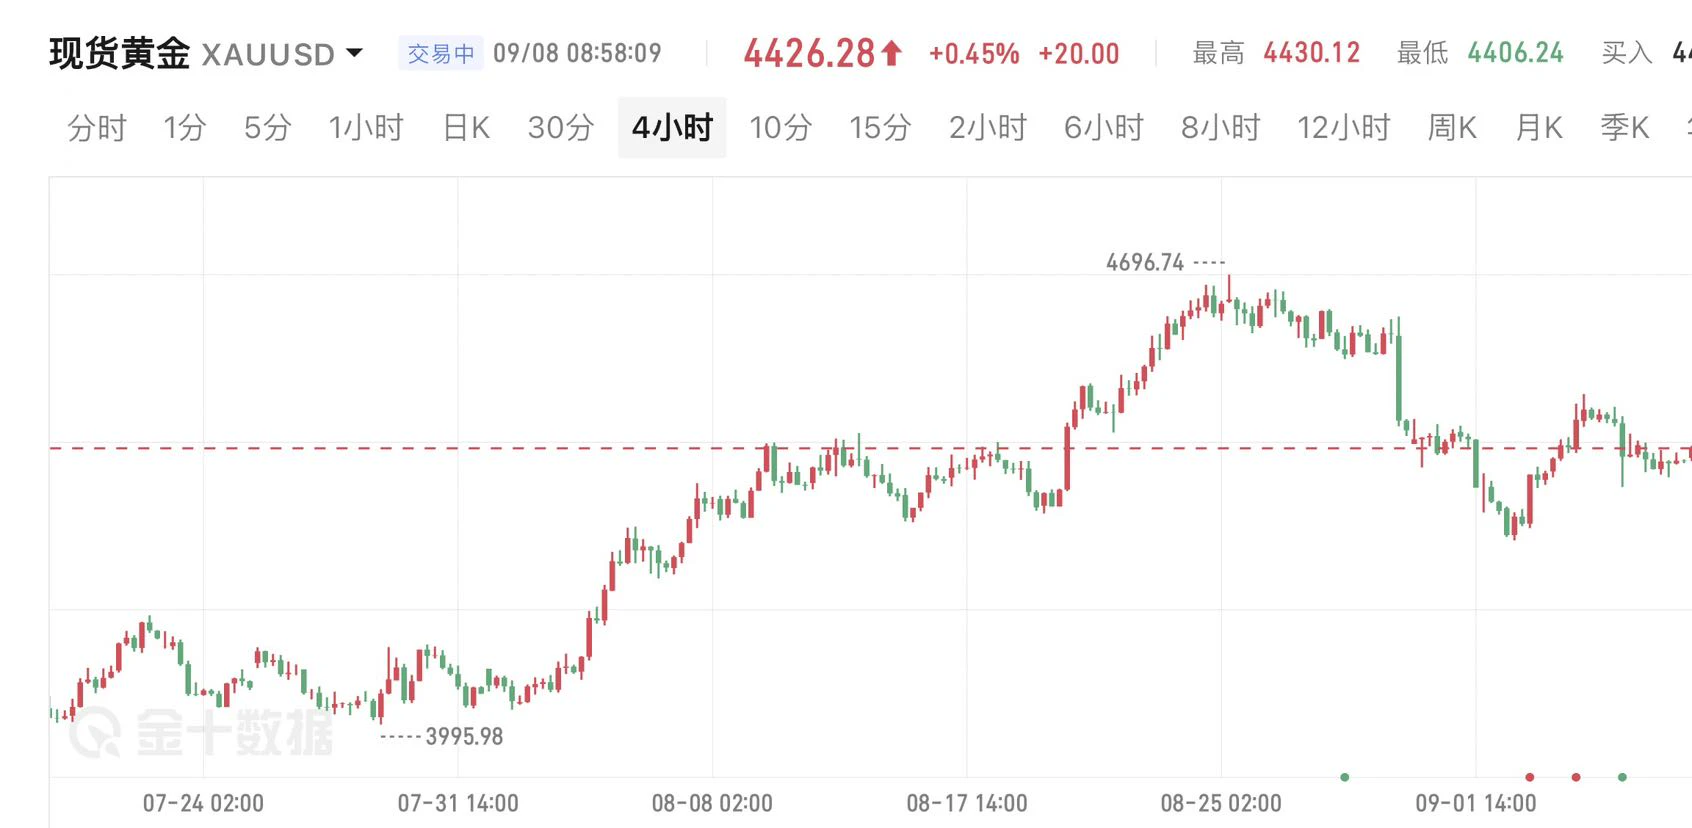
Yesterday, gold prices saw no major fluctuations, remaining in a weak, range-bound pattern overall. The rally encountered resistance around 4435, so do not chase the rise.
Multiple attempts to move higher were met with pressure and retraced. Bullish momentum weakened, while the stronger dollar and rising U.S. Treasury yields suppressed gold’s upside.
From the chart, the highs are gradually declining, and the rebound has clearly weakened. Selling pressure above remains evident, with bears still dominating in the short term.
This is currently a rebound correction following a sharp decline, and t
post-image
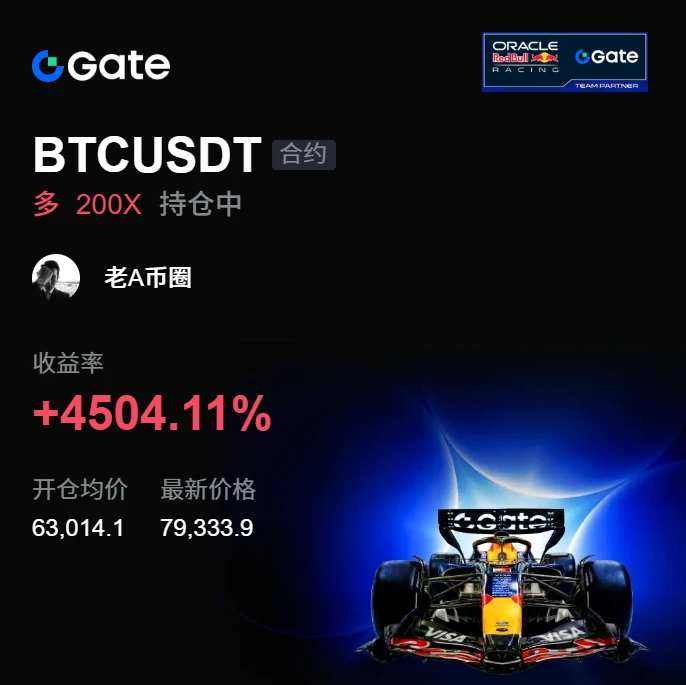
I was just about to curse it out, but then I checked my account—never mind, let it pump however it wants, I’ll keep quiet. Before the market had fully started moving, I saw the pullback hold steady, with funds stepping in every time it dipped, so I entered directly at 63014.1. It has now climbed to 79334, with a return of +4504.11%. I timed the rhythm right, and this run wasn’t endured in vain. It feels damn good, but don’t get carried away—take profit on 80% first, and execute the stop-loss as planned on the remaining 20%, letting the profits run. Don’t let profits inflate your ego, and don’t
post-image
BNB-0.71%
ETH-0.08%
$XAUT 9.8 morning gold outlook
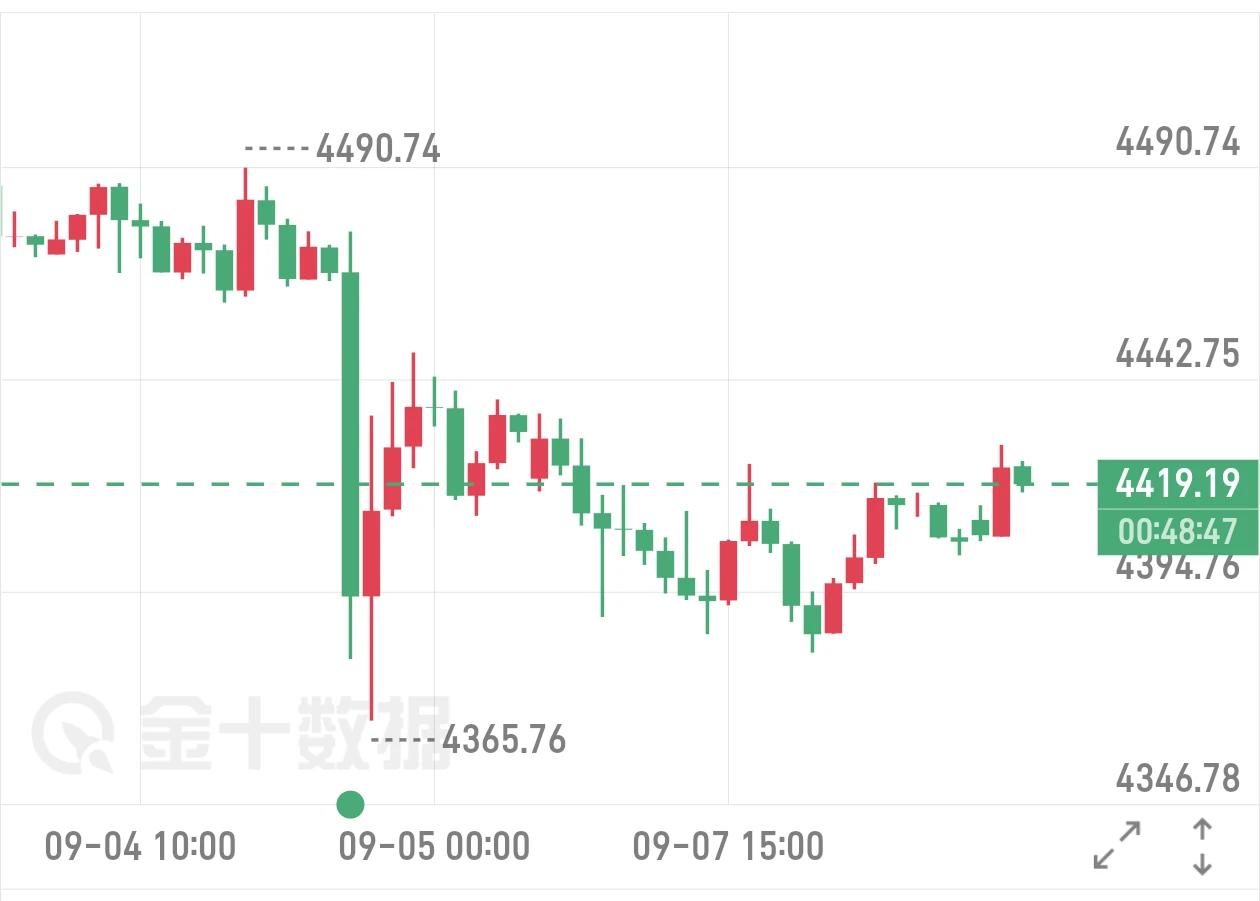
Yesterday’s price action can be summed up in one word: “weak.” After Friday’s bearish nonfarm payrolls data knocked the price down 110 points, the market entered a range-bound consolidation, with the candlesticks becoming progressively smaller.
Market conditions show that gold lacks sufficient upside momentum. U.S. Treasury yields remain elevated, while the dollar has stabilized. The current rebound in gold prices is merely a technical correction, not a trend reversal, so the strategy remains to sell rallies.
Trade reference: Short near 4435, with targets at 4370
post-image
XAUT+0.53%
#Gate用户突破6000万
60 MILLION USERS IS NOT THE FINISH LINE — IT IS THE START OF A BIGGER ECOSYSTEM. 🌍
Reaching 60 million users is more than a number on a platform dashboard. It represents millions of individuals entering the digital-asset economy with different goals, strategies, risk profiles, and expectations.
Some users arrive to trade. Others come to explore new assets, participate in campaigns, follow market trends, earn rewards, or simply understand how the next generation of financial infrastructure is developing.
The real challenge after reaching such a milestone is no longer simply att
GT+3.28%
$FLOCK Down 20% in 24 hours, with a wick low of 0.055, and now moving sideways around 0.0635—this is not a bottom-fishing signal, but a typical continuation move in a downtrend. Don't rush to catch a falling knife.
First, look at volume and price: the $150 million 24-hour trading volume combined with this decline shows that major players are distributing, not retail traders panicking. From 0.0795 down to 0.055, the drop exceeded 30%; the rebound to 0.0635 failed to reclaim even the 0.065 0.618 Fibonacci retracement level, showing extreme weakness. On the four-hour chart, MACD remains below the
FLOCK-14.98%
Smart money is quietly building a short position on SYMBOL while retail chases pumps.

$LTC /USDT - SHORT

Trade Plan:
Entry: 55.27 – 55.67
SL: 57.40
TP1: 54.02
TP2: 53.05
TP3: 51.61

Why this setup?
Why now? The daily trend is range-bound, which often precedes a directional breakdown, and the 1h ATR of 0.805067 confirms enough volatility to drive a move into our target zones. The 15m RSI sitting at 52.71 shows the asset is neither overbought nor oversold, leaving room for the downside to unfold. We are watching the 1h price of 55.48 as our reference point, with entries between 55.27 and 55
LTC+2.24%
$SNDK /USDT is about to break range and most traders are not ready

$SNDK /USDT - SHORT

Trade Plan:
Entry: 1784.55 – 1788.17
SL: 1803.77
TP1: 1773.30
TP2: 1764.59
TP3: 1751.53

Why this setup?
Why now? The 1h price is 1786.11, sitting inside the entry zone between 1784.55 and 1788.17, which means the setup is live and waiting for a trigger. The 15m RSI at 45.48 shows neither overbought nor oversold, so momentum is balanced but leans bearish for the short bias. The 1h ATR of 7.255354 tells us the average candle range, giving a realistic idea of how far price can move in an hour. The daily t
SNDK+2.18%
9.8 Su Wan Gold Morning View
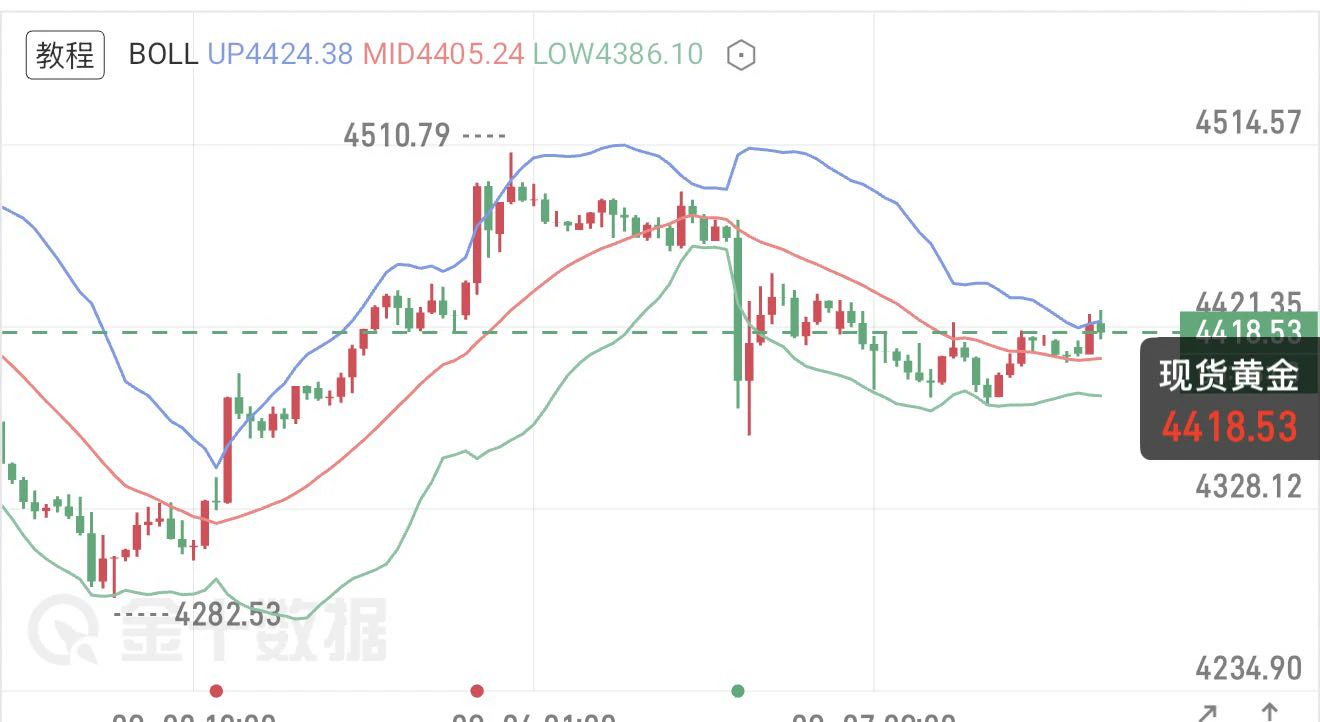
The current price is 4419, moving upward amid early-session consolidation. Continued gold purchases by central banks are providing support, while shifting rate-cut expectations are creating back-and-forth pressure. The U.S. dollar has weakened slightly, and short-term bulls are beginning to gain strength.
The Bollinger Bands are opening upward, and the price is above the middle band, indicating an overall strong trend. However, resistance above is heavy, so beware of a rapid plunge after a sharp rise.
Today’s main strategy is to buy on pullbacks
View
Go long on a p
post-image
XAUT+0.53%
hot Topics only
live-cover
LIVE2,017
Everyone is sleeping on UNI while the 1h setup screams long right now.

$UNI /USDT - LONG

Trade Plan:
Entry: 6.824 – 6.888
SL: 6.553
TP1: 7.083
TP2: 7.234
TP3: 7.462

Why this setup?
Why now? The daily trend is bullish and the 1h price is sitting at 6.856, perfectly aligned with a high-confidence entry zone between 6.824 and 6.888. The 15m RSI at 44.18 shows room to run before overbought territory, while the 1h ATR of 0.126158 confirms enough volatility to push toward the first target at 7.083 and beyond to 7.234. The daily structure supports a move toward 7.462, but this entire long thesi
UNI-0.24%
Why is the 1h RSI sitting at 54.59 right before a potential short squeeze on SYMBOL?

$XAUT /USDT - SHORT

Trade Plan:
Entry: 4416 – 4420
SL: 4442
TP1: 4400
TP2: 4388
TP3: 4371

Why this setup?
Why now? The daily trend is a range, which usually compresses before a directional break, and the 1h price is pinned at 4418. The 1h ATR of 9.877088 shows that volatility is still expanding, so a fast move toward TP1 at 4400 is within one average true range. If momentum stalls, the 15m RSI at 54.59 gives the short side room to push toward TP2 at 4388. The invalidation level at 4442 is the line in the
XAUT+0.54%
This was purely because market sentiment was good—the market casually tossed out a few gold coins, and one just happened to hit me on the head.

During the repeated intraday swings, I saw that $AERO had held its key level and that buy orders were still sitting at the bottom, so I went along with it and opened a long at 0.4598. The logic was straightforward: accept the loss if support broke, and let it choose its own direction if support held.

Taking another look just now, the price has already pushed up to 0.618, with unrealized profit on the position at +2443.04%. This was a satisfying pie
post-image
AERO+20.72%
ETH-0.08%
SNDK+2.18%
I had just switched the app to the background, and it shot right back up—are you playing hide-and-seek with me?

But don’t get me wrong, I’m watching the show from a short position. In that last glance before bed, I noticed that $IN ’s price action was quite subtle: trading volume kept shrinking, yet the price was still stubbornly holding up instead of falling. This kind of low-volume rebound is inherently suspicious. No volume means no conviction, and without conviction, don’t expect capital to carry you higher.

Sure enough, after today’s opening, the rebound was weak, with each upward push
post-image
IN-0.03%
BNB-0.71%
ETH-0.08%
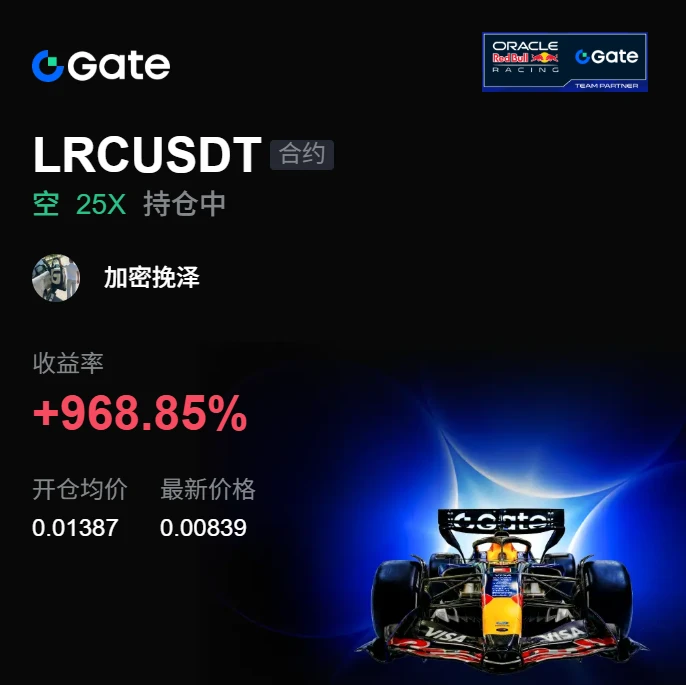
I originally wanted to sell at a loss as a sacrifice to the heavens, but the ritual failed and the meat roasted itself. 🔥
During the repeated intraday swings, each push upward had less strength than the last, while trading volume kept shrinking. Every time it touched a key level, it was pushed back down. This kind of fake rebound is enough to fool beginners, but to experienced traders, it is an obvious signal. I opened a short in the direction of the key level, entered at 0.01387, set the stop-loss in advance, and left the rest to me and the market to grind out slowly.
The market is won by wa
post-image
ADA+0.36%
LAB-1.73%
Insiders are quietly fading BNB while the crowd chases the pump.

$BNB /USDT - SHORT

Trade Plan:
Entry: 739.31 – 741.19
SL: 749.30
TP1: 733.46
TP2: 728.94
TP3: 722.15

Why this setup?
Why now? The daily trend is range, which means BNB is coiling for a directional move, and the 1h ATR of 3.770786 shows enough volatility to justify a short position. The 15m RSI at 53.38 is neutral, so the real edge comes from the entry zone of 739.31 to 741.19, where price is currently resting at 740.25 on the 1h timeframe. If shorts are triggered, TP1 at 733.46 and TP2 at 728.94 offer a clean risk-to-reward
BNB-0.71%
BTC is currently around $79,244, down slightly by 0.94% over 24 hours, repeatedly battling below the $80k round-number level: spot ETFs saw net inflows of $987 million last week, while positive remarks from the U.S. Treasury Secretary provided downside support; whale selling pressure, CPI/FOMC uncertainty, and multiple security incidents capped the upside. Technically, the RSI at 42.1 indicates a neutral-to-weak short-term bias, with the direction likely to be determined after macro developments play out. #Gate闲钱宝自动生息享3%年化
BTC-0.66%
BTC found support and rebounded near 78,600, but why shouldn’t we rush to say it has turned stronger before reclaiming 79,500?
After retreating from around 80,000 over the past two days, BTC found buying support near 78,600 and has now moved back above 79,000.
Seeing the rebound, many people’s first reaction is: the pullback is over, and the market is about to move higher again.
But the easiest thing to misread today is equating a “rebound after finding a floor” directly with a “structural recovery.”
From the one-hour structure, the fact that 78,600 has held for now shows there is buying inter
post-image
BTC-0.69%
  • 2
Load More

Join 40 M users in our growing community

⚡️ Join 40 M users in the crypto craze discussion

💬 Engage with your favorite top creators

👍 See what interests you

View More