
Square
Following
Hot
News
Profile
Share your thoughts
placeholder
Article
$ZRO is up more than 150% from the July low.
This month it poked above the downtrend line that's been capping it since early 2025, then came back to test it.
If that line holds as support, things can get interesting.
ZRO-5.23%
The government has ended the issuance of the old, machine readable, passports!
Pakistan has switched all new passport applications to e-passports, ending the issuance of machine-readable passports across the country.
The normal fee for a five-year, 36-page passport has doubled from Rs. 4,500 to Rs. 9,000, while the urgent fee has risen from Rs. 7,500 to Rs. 15,000.
Existing machine-readable passports remain valid until they expire.
By tajasus
post-image
Trenches
AGT
A
bade
b
AGT
0x5d...e274
Market Cap
$.
Change
.
24h Vol
$.
Holders
.
CNPY
C
bade
b
CNPY
0xc6...ddd2
Market Cap
$.
Change
.
24h Vol
$.
Holders
.
TSI
T
bade
b
TSI
0xa8...1c1e
Market Cap
$.
Change
.
24h Vol
$.
Holders
.
Gato
G
bade
b
Gato
55A3...pump
Market Cap
$.
Change
.
24h Vol
$.
Holders
.
hi
h
bade
b
hi
0x8a...a7f7
Market Cap
$.
Change
.
24h Vol
$.
Holders
.
$XMR - Update
Looking for shorts if we get the test at $690 as mapped out.
post-image
XMR+5.99%
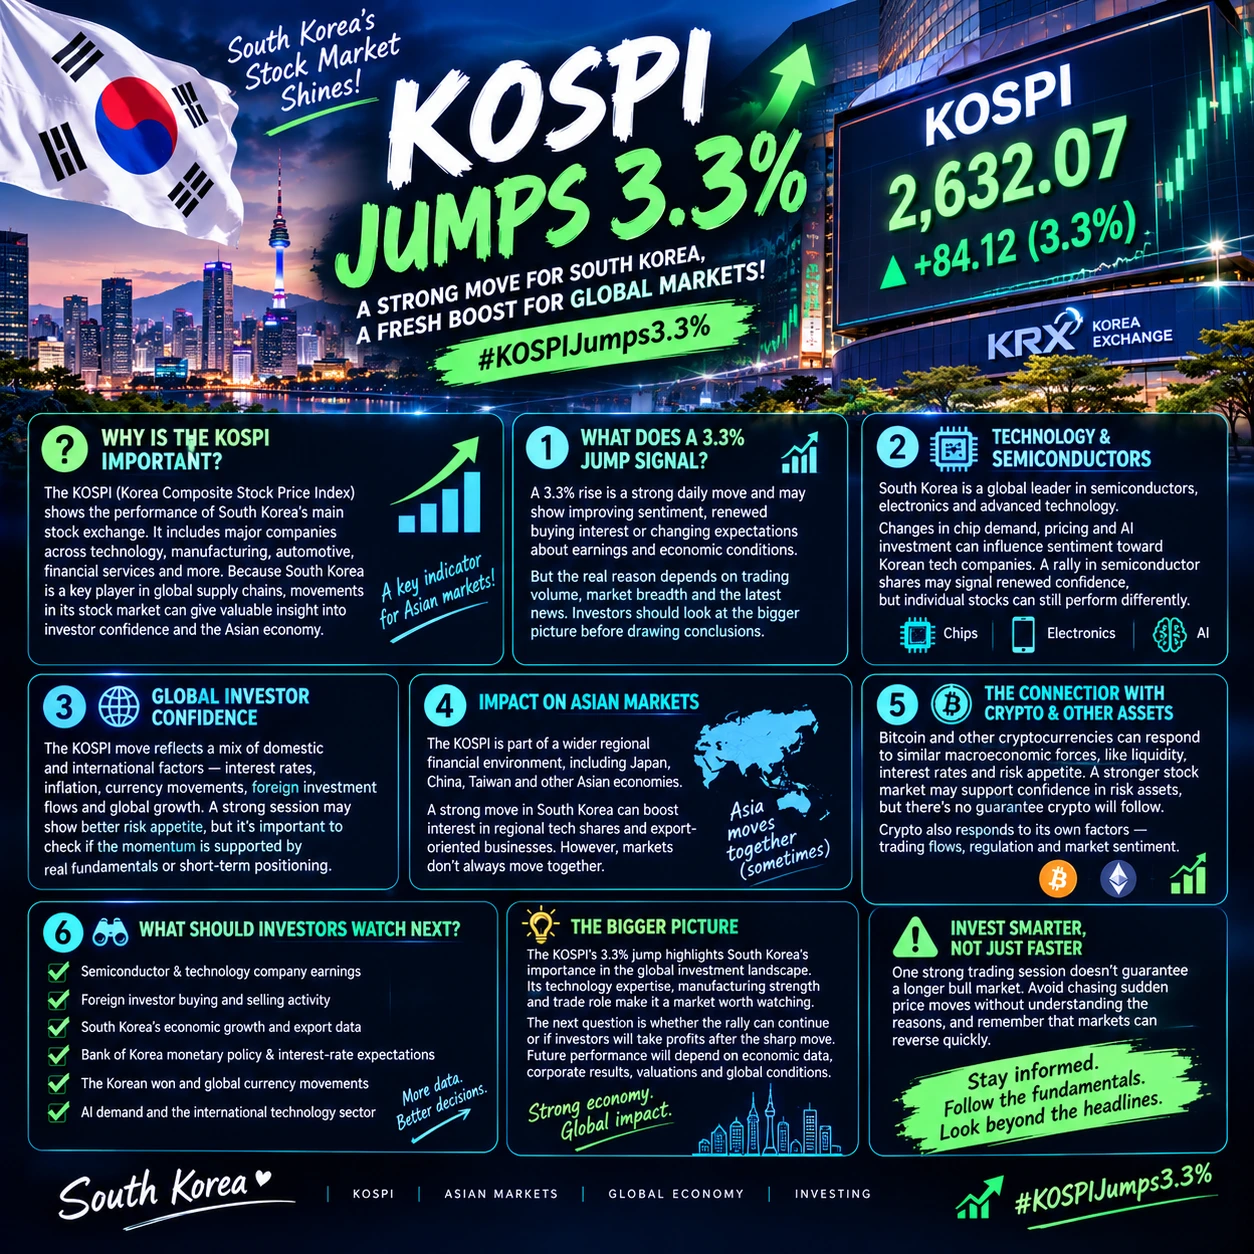
#KOSPIJumps3.3% #日韩股集体大跌
I spent my weekend going through the Asia selloff numbers, and my honest take is that this was more than a normal dip. It was a positioning event, and the memory names sat at the center of it.
The scoreboard first. On October 15, the Nikkei 225 closed down 3,318.34 points, or 4.90%, at 64,425.95, and the KOSPI closed down 7.56% at 5,554.27. The KOSPI fell more than 9% intraday and triggered its tenth circuit breaker of the year. The Nikkei drop was the third biggest point fall ever, and the index is now more than 10% below its June record of 72,831.73. Taiwan lost 3.4
post-image
JPN225-2.99%
SK Hynix+0.79%
DRAM-5.87%
MU-5.66%
$WLD has already moved. Why hasn't trading activity followed?
$WLD There is a very typical debate right now: one side cites the 24-hour -0.84% move as proof of direction, while the other pushes back with key levels. I’m not taking sides based on the percentage change for now, because the full picture is still unclear: $WLD has already moved, but trading activity and volume have yet to catch up. We can tentatively trust the direction, but not its continuation; a move without follow-through can be reversed at any time.
My view is that the direction is tentatively there, but low participation has
post-image
WLD-4.02%
solana:6x4Z2dr5DgHUBCKvta8T8GNsFTxJhsBZxNrycWQ8pump
6x4Z2dr5DgHUBCKvta8T8GNsFTxJhsBZxNrycWQ8pump
#crypto $sol
post-image
SOL-1.28%
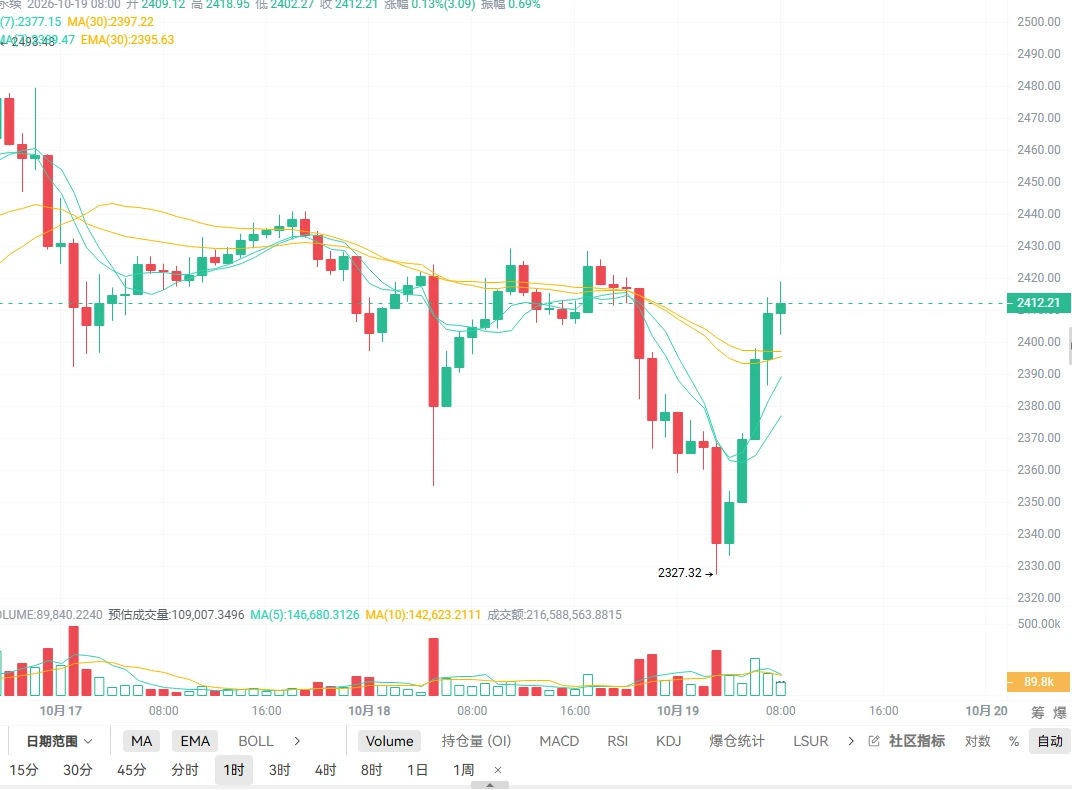
#WCTCS9 #每周来晒 Gold posted a recovery move this week, falling first and then rising. At the start of the week, it was hit by bearish CPI data, with prices plunging to a swing low of 4073, a recent low. Oversold buyers then entered the market in succession to provide support, driving gold to rebound in choppy trading. It is currently trading around 4163, with overall sideways consolidation in a low range.
After CPI came in above expectations, market expectations for a Fed rate cut in October cooled sharply, with bets even beginning to shift toward a further delay in the timing of rate cuts. Aft
ETH-1.44%
XAU-0.21%
  • 1
  • 1
Economic Calendar Outlook👁️
𝗠𝗼𝗻𝗱𝗮𝘆: Trade Day (wait for 9:30am) ✅
𝗧𝘂𝗲𝘀𝗱𝗮𝘆: Trade Day (wait for 9:30am) ✅
𝗪𝗲𝗱𝗻𝗲𝘀𝗱𝗮𝘆: Trade Day (wait for 9:30am) ✅
𝗧𝗵𝘂𝗿𝘀𝗱𝗮𝘆: Trade Day (wait for 9:30am) ✅
𝗙𝗿𝗶𝗱𝗮𝘆: Trade Day (wait for 9:30am) ✅

Our roadmap🗺
post-image
No more words—switching careers on the spot to create AI content.
post-image
Vitalik compares the costs of BTC mining and AI inference: electricity costs account for nearly half
live-cover
LIVE2,902
Tom Lee: Crypto and chip stocks have both pulled back to support levels, and a breakout is imminent.
live-cover
LIVE2,660
People have stopped laughing at Poland now…
Now ranking 3rd in GDP growth per Capita (3.9%) in Europe and among safest countries.
post-image
Saylor is back in accumulation mode.
Michael Saylor says Strategy is buying more #Bitcoin, adding another bullish signal to the institutional demand story.
The bigger question now: does this fresh buying help fuel the next $BTC leg higher?
We are so back.
post-image
BTC-0.16%
📊 Crypto Daily | Evening of Oct 18: $350 million liquidated in a single hour! BTC plunged to a low of 81,300, then bounced back—who is the market maker shaking out?

Guys, there's action in the market today: BTC dipped first, then rallied, hitting a low of 81,288 before V-shaped rebounding above 82,100 (+0.86% over 24h). A daytime liquidation storm wiped out longs, with about $350 million liquidated in a single hour. Then, in the evening, BTC climbed back above 82,000—the sharp drop and rebound looked just like a shakeout by market makers.

Market conditions:

1. Storm + rebound: Intense s
post-image
BTC-0.15%
ETH-1.64%
Gate has launched the ETF Treasure Hunt Edition 5. During the campaign, trade ETFs and complete designated tasks to earn draw chances for rewards including USDT, ZEC5L, ETF Trial Funds, and ETF Fee Rebate Vouchers. Complete advanced trading tasks to share a 30,000 USDT prize pool in WLFI. https://www.gate.com/campaigns/6654?ch=8706&ref=VLARBF1YAG&ref_type=132&utm_cmp=ITHlVqLm
post-image
ZEC5L-23.07%
WLFI-0.05%
  • 3
#ShareWeekly ‌$ZEC in ten numbers: a different way to read the week at $1,162
Instead of a standard chart review, here are ten numbers that explain where Zcash stands today, what they mean, and what to watch next.
1. $1,162: the price in context
Trackers show ZEC between about $1,144 and $1,176 on October 17, so $1,162 sits in the middle of the live range. Over the past 24 hours the high was $1,239.00 and the low was $1,130.36.
2. #10: its rank by size
ZEC ranks tenth by market cap. Its market cap is about $19.98 billion, which puts a privacy coin in the same top-ten conversation as the bigge
post-image
ZEC-4.45%
BTC-0.16%
ETH-1.44%
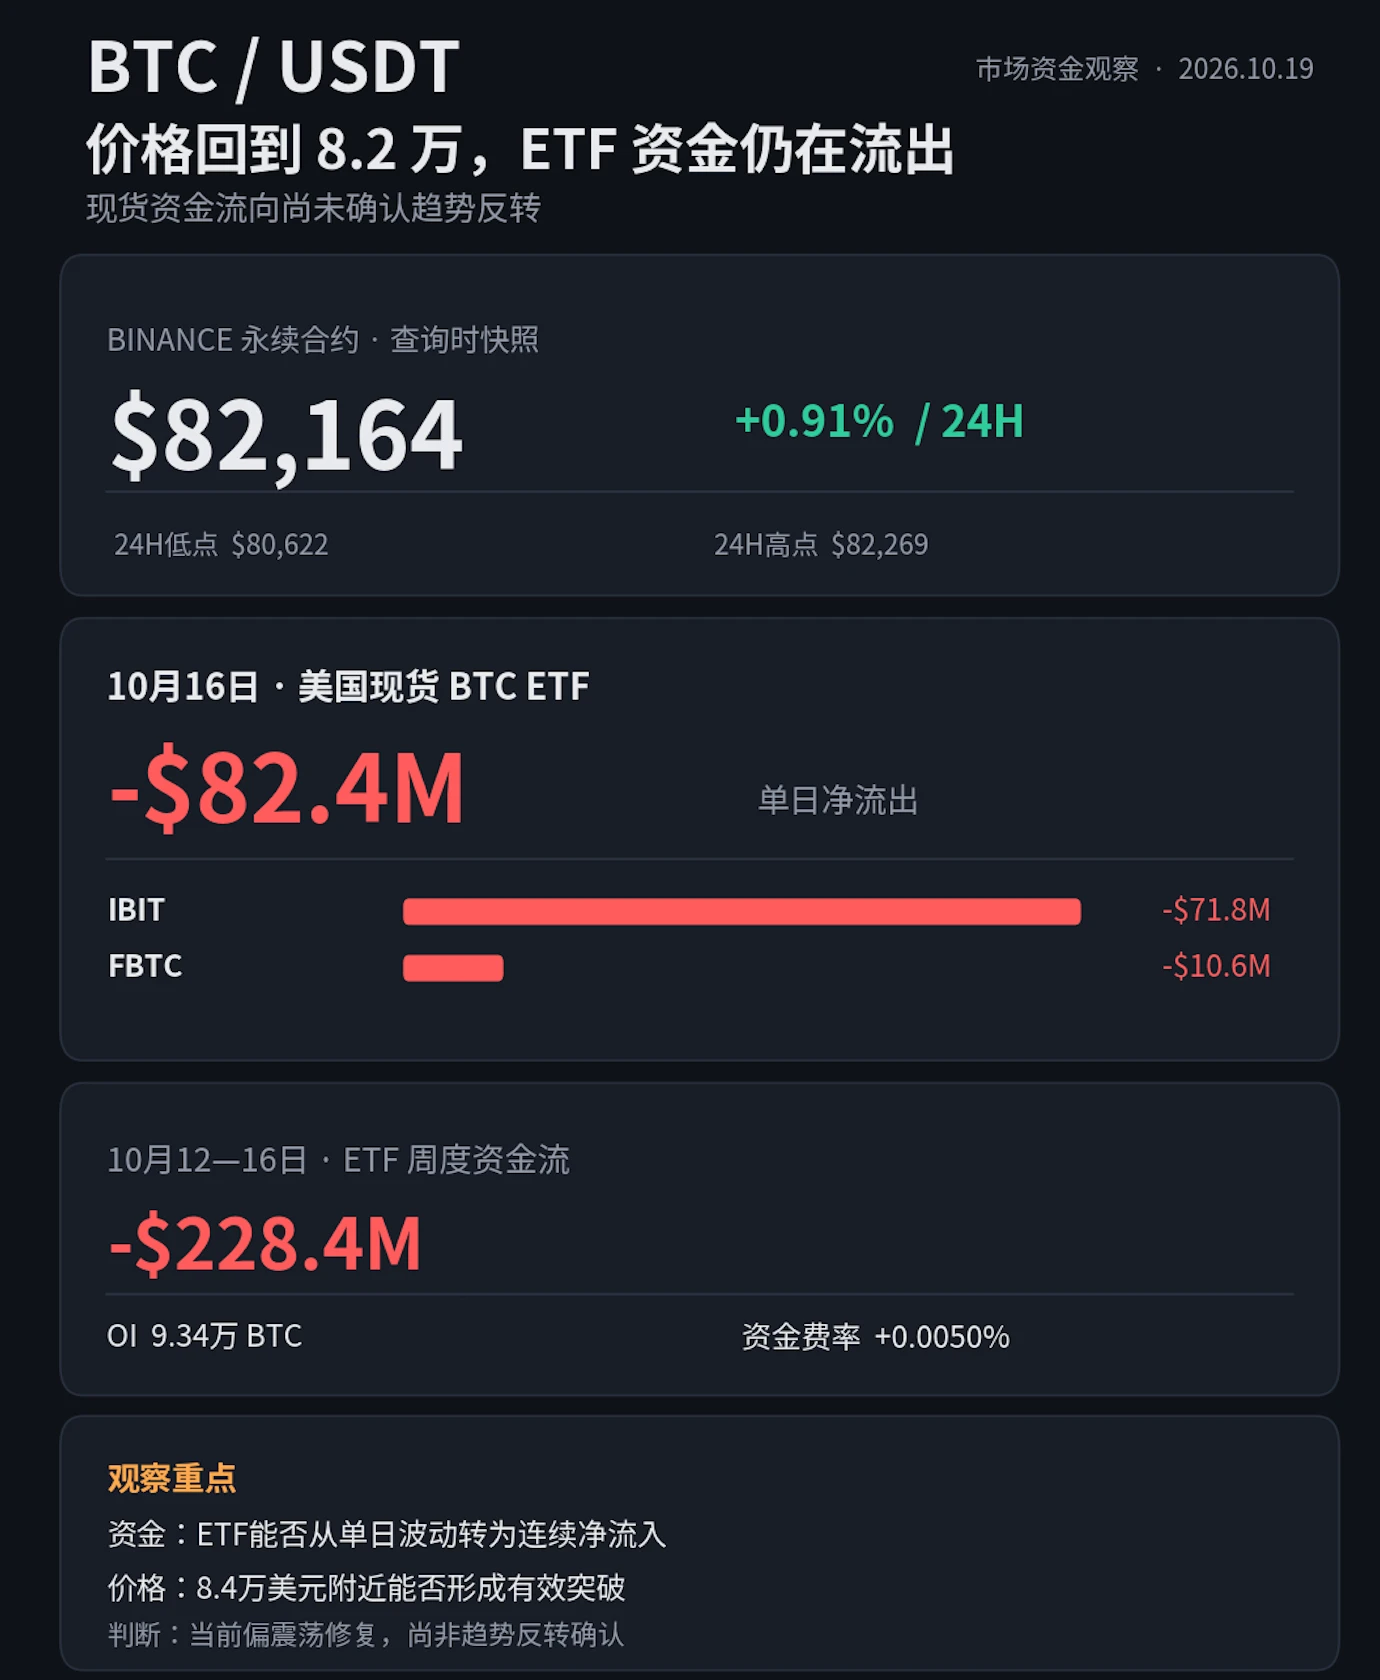
#BTC跌破8.2万 Technical read at $81,668: what the chart says about 81K and 80K
BTC is trading near $81,668, and the question on everyone's screen is whether 81K can hold or 80K gets tested next. Here is the technical picture, level by level, with no guesswork.
Where we came from
Early October looked bullish. BTC ran toward $87,000, then was rejected near that level on October 5, which triggered a cascade of leveraged long liquidations. The week's high was $84,323.70 on October 12, and the low was $79,841.60 on October 15, right after the hot CPI (3.7% year over year, core 2.6%). That is a 5.6% we
post-image
BTC-0.16%
it’s a beautiful day to not be french
rwo
post-image
𝐒𝐓𝐎𝐏..... 𝐒𝐓𝐎𝐏..... 𝐒𝐓𝐎𝐏 🚨$BT is approaching the decision zone!
Bitcoin may make another run at $87, but a liquidity sweep does not guarantee a breakout.
If sellers hold this higher-timeframe supply zone, BTC could pull back to 75K–67K before the next major move. But most traders overlook this: a deep pullback does not mean the bull market is over. 62.5K is a structural level I’m watching closely. 🎯 My strategy: Don’t chase gains or panic-sell. Let price show its direction. The next move itself matters less than how BTC reacts when it reaches the target zone. Watch liquidity fir
post-image
90K
90K90k Is All You Need
Pump.Fun
MC:$2.82KHolders:1
0%
BTC-0.16%
Load More

Join 40 M users in our growing community

⚡️ Join 40 M users in the crypto craze discussion

💬 Engage with your favorite top creators

👍 See what interests you

Trending Topics

USSeptemberPPIBeatsExpectations

91.35k Views1.93k Discussing

US September PPI came in at 6.3% YoY, well above the 5.3% market expectation, pointing to renewed producer-side inflation pressure. Weekly jobless claims were 199K, broadly in line with forecasts. Could hotter inflation further reduce room for rate cuts, and what does it mean for $BTC, US stocks, and gold?

GateWCTCS9GlobalTradingCompetition

37.87k Views6.78k Discussing

GateBTCAndETHFuturesVolumeRanksTop3

53.8k Views1.9k Discussing

View More